Koleksiyonlar ile düzeninizi koruyun
İçeriği tercihlerinize göre kaydedin ve kategorilere ayırın.
Çağrı yığınları, CPU sıcak noktalarını (yürütülmesi uzun süren kod bölümleri) belirlemek için yararlıdır. Çağrı yığınları, kodun hangi bölümünün yürütüldüğünü ve neden çağrıldığını anlamanıza yardımcı olur.
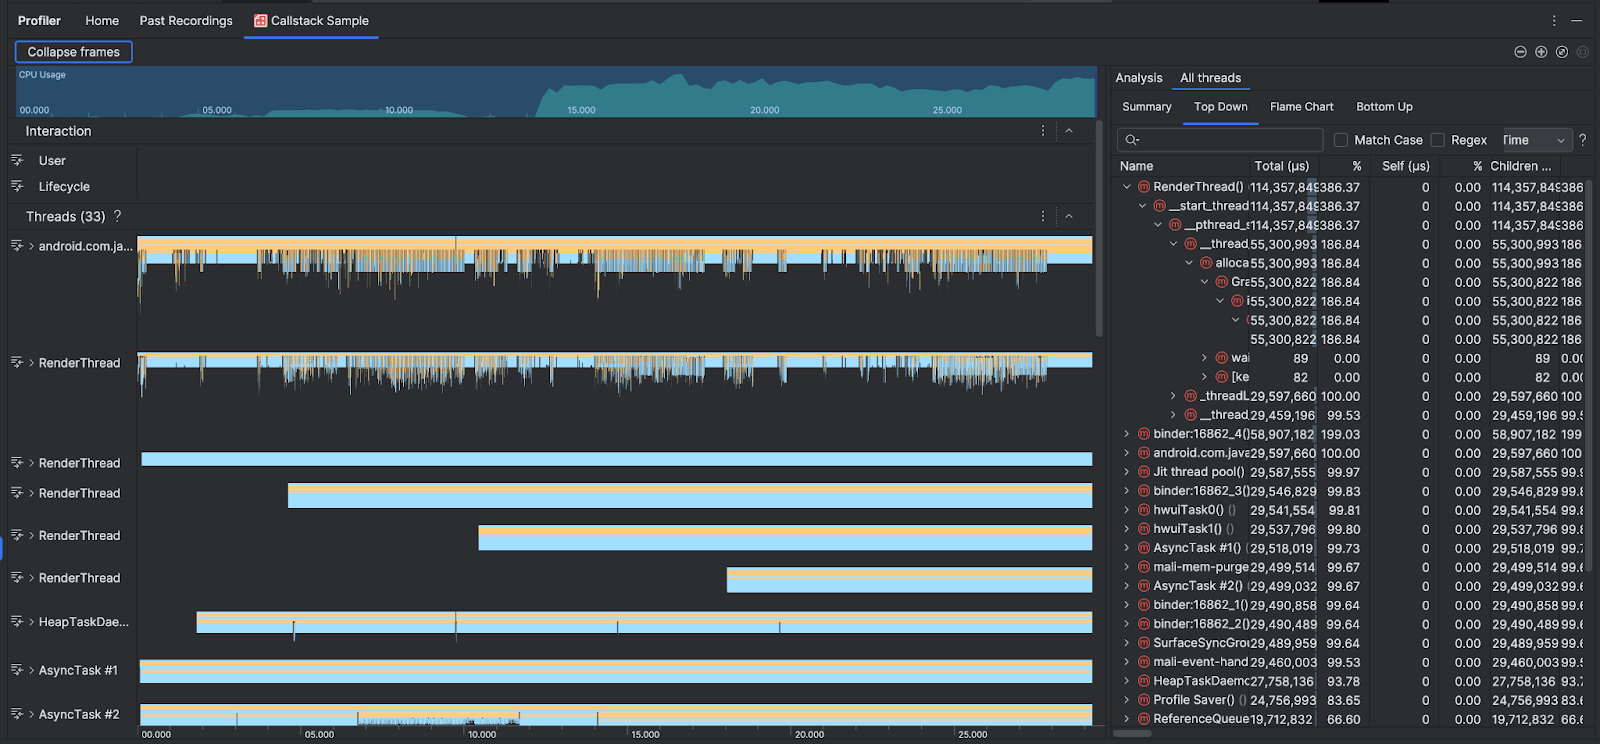
CPU Kullanımı ve Etkileşimler zaman çizelgelerini desteklemek için İş Parçacıkları bölümünde, uygulamanızın ve sistemin yaptığı her çağrıyla ilgili kareler gösterilir. Aşağıda, çağrı yığını örneğinde gezinmeyle ilgili bazı ipuçları verilmiştir:
İlgilendiğiniz iş parçacığını genişletin ve yığın çerçevelerinde gezinmek için klavye kısayollarını kullanın. Analiz bölmesinde etkinlik ve ilgili çağrılar hakkında ayrıntılı bilgi edinmek için bir yığın çerçevesini tıklayın.
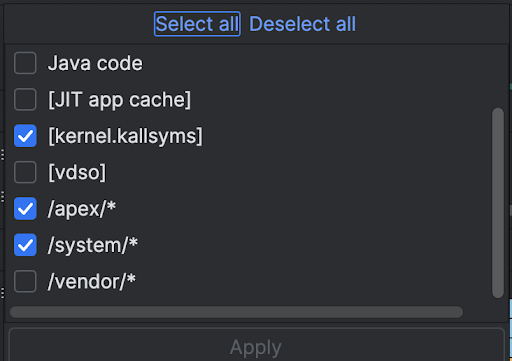
Belirli yığın çerçevesi türlerini filtrelemek için Çerçeveleri daralt'ı tıklayın ve gizlemek istediğiniz çerçeve türlerini işaretleyin. Çerçeveleri daralttığınızda hem İş Parçacıkları hem de Analiz bölümlerinden kaldırılırlar. İncelemenize bağlı olarak, Java sanal makinesindeki (ör. android::AndroidRuntime::start ve art::{...}) ve sistem çekirdeğindeki (ör. [kernel.kallsyms]+{offset}) çerçeveleri daraltmak isteyebilirsiniz. Bu genellikle [kernel.kallsyms], /apex/ ve /system/* ile ilgili çerçeveleri daraltmaya karşılık gelir.
Java/Kotlin programları genellikle bir Java sanal makinesi aracılığıyla yürütüldüğünden Android Studio, Java/Kotlin programı için çağrı yığınını topladığında çağrı yığını genellikle yalnızca Java/Kotlin kodunu değil, programın kendisini çalıştırmak ve programın sistemle ve donanımla iletişim kurması için gereken yerel kodu da içerir.
Bir yığın çerçevesiyle ilişkili kaynak koda gitmek için çerçeveyi sağ tıklayıp Kaynağa git'i tıklayın.
Etkinlik tablosunda bir etkinlikle ilişkili yığın çerçevesini vurgulamak için etkinliği tıklayın.
Android Studio, uygulamanızın yerel kodunu izlemek için dahili olarak simpleperf'ü kullanır. Simpleperf için ek seçenekler (ör. belirli cihaz CPU'larını örnekleme veya yüksek doğrulukta örnekleme süreleri belirtme) istiyorsanız Simpleperf'ü komut satırından kullanabilirsiniz.
Bu sayfadaki içerik ve kod örnekleri, İçerik Lisansı sayfasında açıklanan lisanslara tabidir. Java ve OpenJDK, Oracle ve/veya satış ortaklarının tescilli ticari markasıdır.
Son güncelleme tarihi: 2025-07-27 UTC.
[[["Anlaması kolay","easyToUnderstand","thumb-up"],["Sorunumu çözdü","solvedMyProblem","thumb-up"],["Diğer","otherUp","thumb-up"]],[["İhtiyacım olan bilgiler yok","missingTheInformationINeed","thumb-down"],["Çok karmaşık / çok fazla adım var","tooComplicatedTooManySteps","thumb-down"],["Güncel değil","outOfDate","thumb-down"],["Çeviri sorunu","translationIssue","thumb-down"],["Örnek veya kod sorunu","samplesCodeIssue","thumb-down"],["Diğer","otherDown","thumb-down"]],["Son güncelleme tarihi: 2025-07-27 UTC."],[],[],null,["# Sample the callstack\n\nCallstacks are useful for identifying *CPU hot spots*, or sections of code that\ntake a long time to execute. Callstacks help you understand which part of the\ncode has been executed, and why it was invoked.\n| **Note:** To sample the callstack, you must deploy your app to a device running Android 8.0 (API level 26) or higher.\n\nCallstack sample overview\n-------------------------\n\nTo sample the callstack,\n[select the **Find CPU Hotspots (Callstack Sample)** task](/studio/profile#start-profiling)\nfrom the Android Studio Profiler **Home** tab. After the recording is parsed you\nsee the following visuals:\n\nTo supplement the\n[**CPU Usage** and **Interactions** timelines](/studio/profile/cpu-profiler),\nthe **Threads** section shows frames for every call that your app and the system\nmakes. Here are some tips for navigating the callstack sample:\n\n- Expand the thread of interest and use [keyboard shortcuts](/studio/profile/cpu-profiler#ui-shortcuts) to navigate the stack frames. Click a stack frame to get details about the event and related calls in the **Analysis** pane.\n- To filter to certain types of stack frames, click **Collapse frames** and check the frame types you want to hide. Collapsing frames removes them from both the **Threads** and **Analysis** sections. Depending on your investigation, you might want to collapse frames from the Java virtual machine (for example `android::AndroidRuntime::start` and `art::{...}`), and the system kernel (for example `[kernel.kallsyms]+{offset}`). Usually this corresponds to collapsing frames related to `[kernel.kallsyms]`, `/apex/`, and `/system/*`.\n\nBecause a Java/Kotlin program typically executes through a Java virtual machine,\nwhen Android Studio collects the callstack for a Java/Kotlin program, the\ncallstack usually includes not just the Java/Kotlin code but also the native\ncode required to run the program itself and for the program to talk with the\nsystem and hardware.\n\n- To jump to the source code associated with a stack frame, right-click the frame and click **Jump to source**.\n- To highlight the stack frame associated with an event in the event table, click the event.\n\nFor information about the other visuals, see\n[Record a system trace](/studio/profile/cpu-profiler) and the\n[chart glossary](/studio/profile/chart-glossary/flame-chart).\n\nSample native code using the command line\n-----------------------------------------\n\nInternally, Android Studio uses [simpleperf](/ndk/guides/simpleperf) to trace\nyour app's native code. If you want to specify additional options for\nSimpleperf, such as sampling specific device CPUs or specifying sampling\ndurations at a high accuracy, you can\n[use simpleperf from the command line](https://android.googlesource.com/platform/system/extras/+/master/simpleperf/doc/README.md)."]]