Sử dụng bộ sưu tập để sắp xếp ngăn nắp các trang
Lưu và phân loại nội dung dựa trên lựa chọn ưu tiên của bạn.
Các ngăn xếp lệnh gọi rất hữu ích trong việc xác định các điểm nóng CPU hoặc các phần mã mất nhiều thời gian để thực thi. Ngăn xếp lệnh gọi giúp bạn nắm rõ được phần nào của mã đã được thực thi và lý do lệnh đó được gọi.
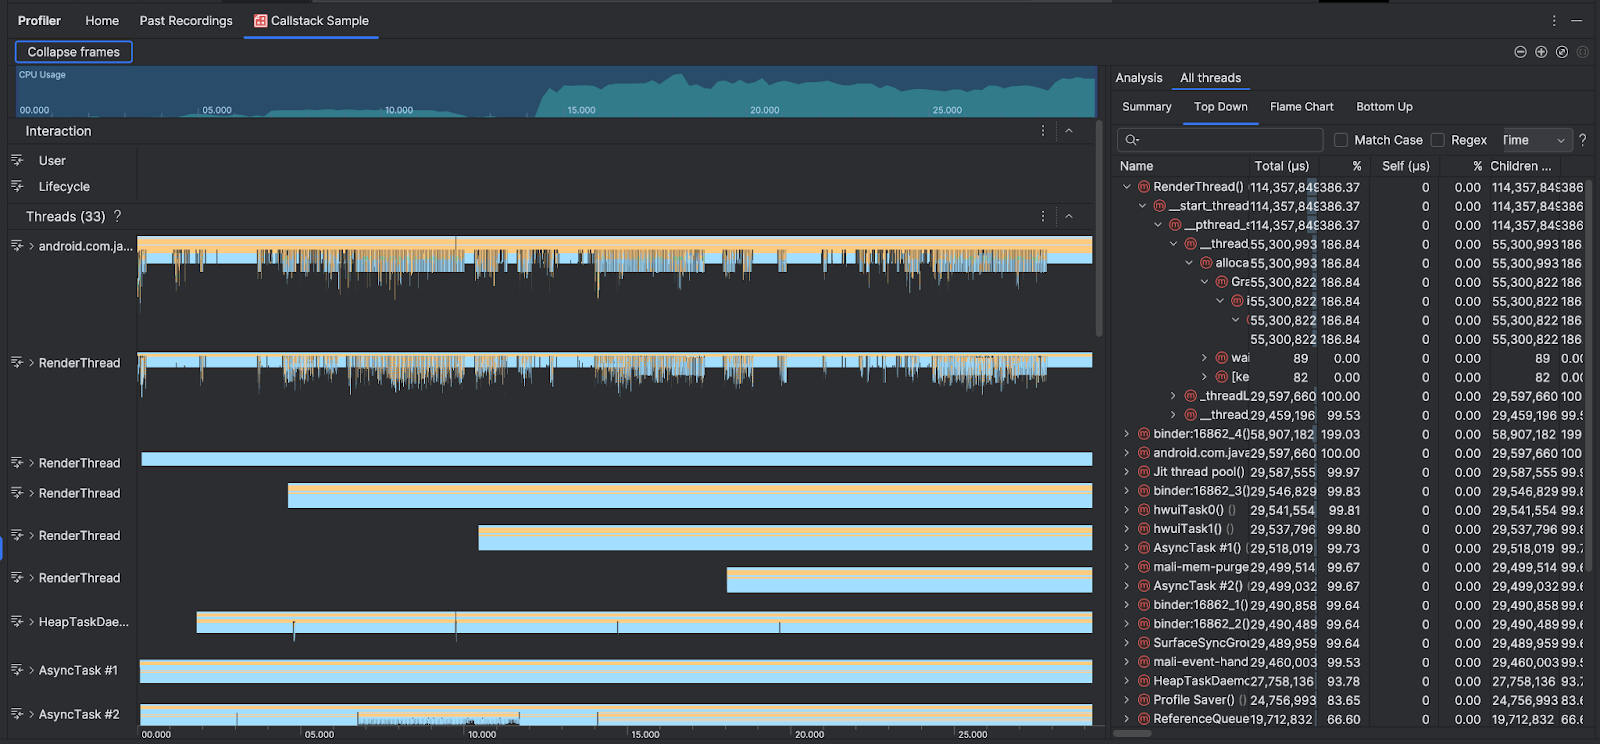
Để bổ sung cho Mức sử dụng CPU và Tiến trình tương tác, phần Luồng cho thấy các khung hình cho mọi lệnh gọi mà ứng dụng và hệ thống thực hiện. Sau đây là một số mẹo để điều hướng mẫu callstack:
Mở rộng luồng mà bạn quan tâm và sử dụng phím tắt để di chuyển các khung ngăn xếp. Nhấp vào một khung ngăn xếp để xem thông tin chi tiết về sự kiện và các lệnh gọi liên quan trong ngăn Phân tích.
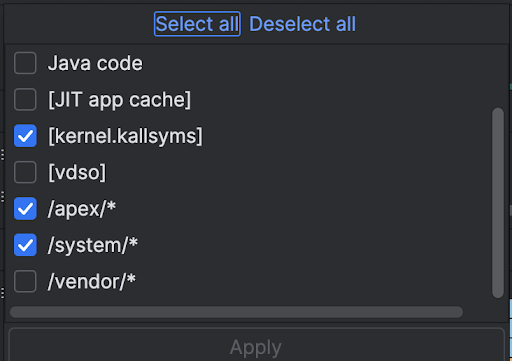
Để lọc theo một số loại khung ngăn xếp, hãy nhấp vào Thu gọn khung rồi đánh dấu vào các loại khung mà bạn muốn ẩn. Khi bạn thu gọn các khung, chúng sẽ bị xoá khỏi cả mục Threads (Luồng) và Analysis (Phân tích). Tuỳ thuộc vào quá trình điều tra, bạn có thể muốn thu gọn các khung từ máy ảo Java (ví dụ: android::AndroidRuntime::start và art::{...}) và nhân hệ thống (ví dụ: [kernel.kallsyms]+{offset}). Thông thường, thao tác này tương ứng với việc thu gọn các khung liên quan đến [kernel.kallsyms], /apex/ và /system/*.
Vì chương trình Java/Kotlin thường thực thi thông qua một máy ảo Java, nên khi Android Studio thu thập ngăn xếp lệnh gọi cho một chương trình Java/Kotlin, ngăn xếp lệnh gọi đó thường không chỉ bao gồm mã Java/Kotlin mà còn bao gồm mã gốc cần thiết để chạy chương trình và để chương trình giao tiếp với hệ thống và phần cứng.
Để chuyển đến mã nguồn được liên kết với một khung ngăn xếp, hãy nhấp chuột phải vào khung đó rồi nhấp vào Jump to source (Chuyển đến nguồn).
Để làm nổi bật khung ngăn xếp được liên kết với một sự kiện trong bảng sự kiện, hãy nhấp vào sự kiện đó.
Trong nội bộ, Android Studio sử dụng simpleperf để theo dõi mã gốc của ứng dụng. Nếu muốn chỉ định các tuỳ chọn khác cho Simpleperf, chẳng hạn như lấy mẫu các CPU cụ thể trong thiết bị hoặc chỉ định thời lượng lấy mẫu ở độ chính xác cao, bạn có thể sử dụng simpleperf từ dòng lệnh.
Nội dung và mã mẫu trên trang này phải tuân thủ các giấy phép như mô tả trong phần Giấy phép nội dung. Java và OpenJDK là nhãn hiệu hoặc nhãn hiệu đã đăng ký của Oracle và/hoặc đơn vị liên kết của Oracle.
Cập nhật lần gần đây nhất: 2025-07-27 UTC.
[[["Dễ hiểu","easyToUnderstand","thumb-up"],["Giúp tôi giải quyết được vấn đề","solvedMyProblem","thumb-up"],["Khác","otherUp","thumb-up"]],[["Thiếu thông tin tôi cần","missingTheInformationINeed","thumb-down"],["Quá phức tạp/quá nhiều bước","tooComplicatedTooManySteps","thumb-down"],["Đã lỗi thời","outOfDate","thumb-down"],["Vấn đề về bản dịch","translationIssue","thumb-down"],["Vấn đề về mẫu/mã","samplesCodeIssue","thumb-down"],["Khác","otherDown","thumb-down"]],["Cập nhật lần gần đây nhất: 2025-07-27 UTC."],[],[],null,["# Sample the callstack\n\nCallstacks are useful for identifying *CPU hot spots*, or sections of code that\ntake a long time to execute. Callstacks help you understand which part of the\ncode has been executed, and why it was invoked.\n| **Note:** To sample the callstack, you must deploy your app to a device running Android 8.0 (API level 26) or higher.\n\nCallstack sample overview\n-------------------------\n\nTo sample the callstack,\n[select the **Find CPU Hotspots (Callstack Sample)** task](/studio/profile#start-profiling)\nfrom the Android Studio Profiler **Home** tab. After the recording is parsed you\nsee the following visuals:\n\nTo supplement the\n[**CPU Usage** and **Interactions** timelines](/studio/profile/cpu-profiler),\nthe **Threads** section shows frames for every call that your app and the system\nmakes. Here are some tips for navigating the callstack sample:\n\n- Expand the thread of interest and use [keyboard shortcuts](/studio/profile/cpu-profiler#ui-shortcuts) to navigate the stack frames. Click a stack frame to get details about the event and related calls in the **Analysis** pane.\n- To filter to certain types of stack frames, click **Collapse frames** and check the frame types you want to hide. Collapsing frames removes them from both the **Threads** and **Analysis** sections. Depending on your investigation, you might want to collapse frames from the Java virtual machine (for example `android::AndroidRuntime::start` and `art::{...}`), and the system kernel (for example `[kernel.kallsyms]+{offset}`). Usually this corresponds to collapsing frames related to `[kernel.kallsyms]`, `/apex/`, and `/system/*`.\n\nBecause a Java/Kotlin program typically executes through a Java virtual machine,\nwhen Android Studio collects the callstack for a Java/Kotlin program, the\ncallstack usually includes not just the Java/Kotlin code but also the native\ncode required to run the program itself and for the program to talk with the\nsystem and hardware.\n\n- To jump to the source code associated with a stack frame, right-click the frame and click **Jump to source**.\n- To highlight the stack frame associated with an event in the event table, click the event.\n\nFor information about the other visuals, see\n[Record a system trace](/studio/profile/cpu-profiler) and the\n[chart glossary](/studio/profile/chart-glossary/flame-chart).\n\nSample native code using the command line\n-----------------------------------------\n\nInternally, Android Studio uses [simpleperf](/ndk/guides/simpleperf) to trace\nyour app's native code. If you want to specify additional options for\nSimpleperf, such as sampling specific device CPUs or specifying sampling\ndurations at a high accuracy, you can\n[use simpleperf from the command line](https://android.googlesource.com/platform/system/extras/+/master/simpleperf/doc/README.md)."]]