앱을 계측하여 트레이스 로그 생성
컬렉션을 사용해 정리하기
내 환경설정을 기준으로 콘텐츠를 저장하고 분류하세요.
앱 실행의 메서드 트레이스를 생성하려면 Debug
클래스를 사용하여 앱을 계측할 수 있습니다. 이 방법으로 앱을 계측하면 기기에서 추적 정보 기록을 시작하고 중지하는 시점을 더 정확하게 관리할 수 있습니다. 기기에서는 또한 사용자가 지정한 이름을 사용하여 트레이스 로그를 저장하므로 나중에 각 로그를 쉽게 식별할 수 있습니다. 그런 다음 Android 스튜디오 CPU 프로파일러를 사용하여 각 트레이스 로그를 볼 수 있습니다.
앱의 코드를 계측하지 않고 CPU 프로파일러에서 추적을 시작하고 중지할 수도 있습니다.
트레이스 로그 생성을 시작하기 전에 앱이 앱별 디렉터리에 트레이스 로그를 저장하는 로직을 추가했는지 확인하세요.
앱 계측
트레이스 로그를 생성하려면 시스템에서 추적 데이터 로깅을 시작할 위치에서 startMethodTracing()
을 호출하세요.
호출 시 .trace
파일의 이름을 지정할 수 있으며 시스템은 대상 기기의 영구 앱 데이터를 위한 패키지별 디렉터리에 파일을 저장합니다. 이 디렉터리는 getExternalFilesDir()
에서 반환하는 것과 동일한 디렉터리이며 대부분의 기기에서 ~/sdcard/
디렉터리에 있습니다.
이 파일에는 바이너리 메서드 트레이스 데이터와 매핑 테이블이 스레드 및 메서드 이름과 함께 포함됩니다. 추적을 중지하려면 stopMethodTracing()
을 호출하세요.
다음 샘플에서는 이름이 sample.trace
인 트레이스 로그의 기록을 시작하고 중지합니다.
Kotlin
// Starts recording a trace log with the name you provide. For example, the
// following code tells the system to start recording a .trace file to the
// device with the name "sample.trace".
Debug.startMethodTracing("sample")
// The system begins buffering the generated trace data, until your
// application calls <code><a href="/reference/android/os/Debug.html#stopMethodTracing()">stopMethodTracing()</a></code>, at which time it writes
// the buffered data to the output file.
Debug.stopMethodTracing()
자바
// Starts recording a trace log with the name you provide. For example, the
// following code tells the system to start recording a .trace file to the
// device with the name "sample.trace".
Debug.startMethodTracing("sample");
...
// The system begins buffering the generated trace data, until your
// application calls <code><a href="/reference/android/os/Debug.html#stopMethodTracing()">stopMethodTracing()</a></code>, at which time it writes
// the buffered data to the output file.
Debug.stopMethodTracing();
앱에서 트레이스 로그의 이름을 변경하지 않고 startMethodTracing()
을 다시 호출하면 기기에 저장된 기존 로그를 덮어씁니다. 각 트레이스 로그의 이름을 동적으로 변경하는 방법을 알아보려면 여러 로그 저장에 관한 섹션을 참고하세요.
stopMethodTracing()
을 호출하기 전에 시스템이 최대 버퍼 크기에 도달하면 추적을 중지하고 콘솔에 알림을 보냅니다.
추적을 시작하고 중지하는 메서드는 앱 프로세스 전체에서 작동합니다. 즉, 활동의 onCreate(Bundle)
메서드에서 startMethodTracing()
을 호출하고 이 활동의 onDestroy()
메서드에서 stopMethodTracing()
을 호출할 수 있습니다.
프로파일링이 사용 설정된 경우 앱이 더 느리게 실행됩니다. 즉, 절대 타이밍(예: 'foo()
메서드를 실행하는 데 2.5초가 걸림')을 판단하기 위해 프로파일링 데이터를 사용해서는 안 됩니다. 트레이스 로그의 타이밍 정보는 이전 트레이스 로그와 비교하는 경우에만 유용하므로 최근 변경으로 인해 앱이 더 빨라졌는지 또는 느려졌는지 확인할 수 있습니다.
Android 5.0(API 수준 21) 이상을 실행하는 기기에 배포하는 경우 샘플 기반 프로파일링을 사용하여 런타임 성능에 미치는 영향을 최소화하면서 프로파일링할 수 있습니다. 샘플 프로파일링을 사용 설정하려면 startMethodTracing()
을 호출하는 대신 지정된 샘플링 간격으로 startMethodTracingSampling()
을 호출합니다. 시스템은 앱이 stopMethodTracing()
을 호출할 때까지 주기적으로 샘플을 수집합니다.
여러 로그 저장
앱에서 트레이스 로그에 새 이름을 지정하지 않고 메서드 트레이스를 여러 번 시작하고 중지하는 경우 기기에서 이전 트레이스 로그를 새 트레이스 로그로 덮어씁니다. 즉, 가장 최근의 트레이스 로그만 유지됩니다. 여러 트레이스 로그를 기기에 저장하려면 앱에서 startMethodTracing()
을 호출할 때마다 동적으로 트레이스 로그의 이름을 바꾸세요.
아래 샘플에서는 SimpleDateFormat
클래스를 사용하여 각 트레이스 로그의 이름을 지정할 때 현재 날짜와 시간을 포함합니다.
Kotlin
// Uses the <code><a href="/reference/java/text/SimpleDateFormat.html">SimpleDateFormat</a></code> class to create a String with
// the current date and time.
val dateFormat: DateFormat = SimpleDateFormat("dd_MM_yyyy_hh_mm_ss", Locale.getDefault())
val logDate: String = dateFormat.format(Date())
// Applies the date and time to the name of the trace log.
Debug.startMethodTracing("sample-$logDate")
Java
// Uses the <code><a href="/reference/java/text/SimpleDateFormat.html">SimpleDateFormat</a></code> class to create a String with
// the current date and time.
SimpleDateFormat dateFormat =
new SimpleDateFormat("dd_MM_yyyy_hh_mm_ss", Locale.getDefault());
String logDate = dateFormat.format(new Date());
// Applies the date and time to the name of the trace log.
Debug.startMethodTracing(
"sample-" + logDate);
기기의 트레이스 로그 액세스
시스템에서 기기에 트레이스 로그를 생성한 후 다음 중 한 가지 방법으로 파일에 액세스할 수 있습니다.
Device Explorer 사용
Device Explorer를 열려면 View > Tool Windows > Device Explorer를 클릭하세요. 또는 도구 창 모음에서 Device Explorer
버튼을 클릭합니다. 그림 1과 같이 앱의 패키지별 디렉터리로 이동하여 .trace
파일을 찾을 수 있습니다.
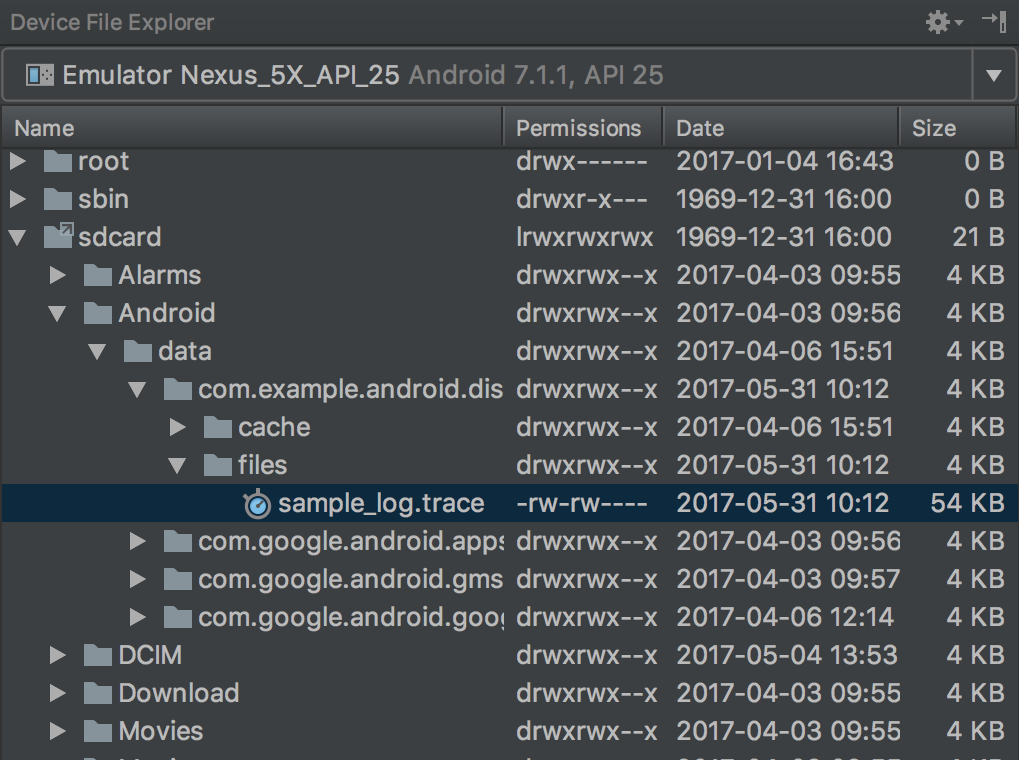
그림 1. Device Explorer를 사용하여 트레이스 로그 찾기
adb pull
명령어를 사용하여 파일을 로컬 머신에 복사합니다.
아래 명령어는 sample.trace
라는 트레이스 로그를 기기에서 로컬 머신의 ~/Documents/trace-logs/
디렉터리에 복사합니다.
adb pull path-on-device/sample.trace ~/Documents/trace-logs/
그런 다음
CPU 프로파일러를 사용하여 트레이스 파일 가져오기
이 페이지에 나와 있는 콘텐츠와 코드 샘플에는 콘텐츠 라이선스에서 설명하는 라이선스가 적용됩니다. 자바 및 OpenJDK는 Oracle 및 Oracle 계열사의 상표 또는 등록 상표입니다.
최종 업데이트: 2025-07-27(UTC)
[[["이해하기 쉬움","easyToUnderstand","thumb-up"],["문제가 해결됨","solvedMyProblem","thumb-up"],["기타","otherUp","thumb-up"]],[["필요한 정보가 없음","missingTheInformationINeed","thumb-down"],["너무 복잡함/단계 수가 너무 많음","tooComplicatedTooManySteps","thumb-down"],["오래됨","outOfDate","thumb-down"],["번역 문제","translationIssue","thumb-down"],["샘플/코드 문제","samplesCodeIssue","thumb-down"],["기타","otherDown","thumb-down"]],["최종 업데이트: 2025-07-27(UTC)"],[],[],null,["# Generate Trace Logs by Instrumenting Your App\n\nTo generate a method trace of your app's execution, you can instrument your app\nusing the [Debug](/reference/android/os/Debug)\nclass. Instrumenting your app this way gives you more control over exactly when\nthe device starts and stops recording tracing information. The device also saves\nyour trace logs using the names you specify, so you can easily identify each log\nlater. You can then view each trace log using the Android Studio\n[CPU Profiler](/studio/profile/cpu-profiler).\n\nYou can also\n[start and stop tracing in the CPU Profiler](/studio/profile/cpu-profiler#method_traces)\nwithout instrumenting your app's code.\n\nBefore you start generating trace logs, make sure your app has added logic to\nsave trace logs to its [app-specific\ndirectory](/training/data-storage/app-specific).\n\nInstrument your app\n-------------------\n\nTo create trace logs, call [startMethodTracing()](/reference/android/os/Debug#startMethodTracing())\nwhere you want the system to start logging tracing data.\n\nIn the call, you can specify the name for the\n`.trace` file, and the system saves it to a package-specific\ndirectory that's intended for persistent app data on the target device---this is\nthe same directory that is returned by\n[getExternalFilesDir()](/reference/android/content/Context#getExternalFilesDir(java.lang.String))\nand is located in the `~/sdcard/` directory on most devices.\nThis file contains the binary method trace data and a mapping table with thread\nand method names. To stop tracing, call\n[stopMethodTracing()](/reference/android/os/Debug#stopMethodTracing()).\n\nThe following sample starts and stops recording a trace log with the name\n`sample.trace`: \n\n### Kotlin\n\n```kotlin\n// Starts recording a trace log with the name you provide. For example, the\n// following code tells the system to start recording a .trace file to the\n// device with the name \"sample.trace\".\nDebug.startMethodTracing(\"sample\")\n\n// The system begins buffering the generated trace data, until your\n// application calls \u003ccode\u003e\u003ca href=\"/reference/android/os/Debug.html#stopMethodTracing()\"\u003estopMethodTracing()\u003c/a\u003e\u003c/code\u003e, at which time it writes\n// the buffered data to the output file.\nDebug.stopMethodTracing()\n```\n\n### Java\n\n```java\n// Starts recording a trace log with the name you provide. For example, the\n// following code tells the system to start recording a .trace file to the\n// device with the name \"sample.trace\".\nDebug.startMethodTracing(\"sample\");\n...\n// The system begins buffering the generated trace data, until your\n// application calls \u003ccode\u003e\u003ca href=\"/reference/android/os/Debug.html#stopMethodTracing()\"\u003estopMethodTracing()\u003c/a\u003e\u003c/code\u003e, at which time it writes\n// the buffered data to the output file.\nDebug.stopMethodTracing();\n```\n\nNote that if your app calls the\n[startMethodTracing()](/reference/android/os/Debug#startMethodTracing())\nagain without changing the name of the trace log, it overwrites the existing log\nsaved to the device. To learn how to dynamically change the name of each trace\nlog, go to the section about [saving multiple logs](#save_multiple_logs).\n\nIf the system reaches the maximum buffer size before you call\n[stopMethodTracing()](/reference/android/os/Debug#stopMethodTracing()),\nthe system stops tracing and sends a notification to the console.\nThe methods that start and stop traces work across your entire app process. That\nis, you could call\n[startMethodTracing()](/reference/android/os/Debug#startMethodTracing())\nin your activity's\n[onCreate(Bundle)](/reference/android/app/Activity#onCreate(android.os.Bundle))\nmethod, and call [stopMethodTracing()](/reference/android/os/Debug#stopMethodTracing())\nin that activity's [onDestroy()](/reference/android/app/Activity#onDestroy())\nmethod.\n\nNote that your app runs more slowly when profiling is enabled. That is, you\nshouldn't use the profiling data to determine absolute timings (such as, \"method\n`foo()` takes 2.5 seconds to run\"). The timing information in the trace logs are\nuseful only when comparing it to previous trace logs, so you can see if recent\nchanges make your app faster or slower.\n\nWhen deploying to devices running Android 5.0 (API level 21) and higher, you can\nuse sample-based profiling to profile with less runtime performance impact. To\nenable sample profiling, call\n[startMethodTracingSampling()](/reference/android/os/Debug#startMethodTracingSampling(java.lang.String, int, int))\n(instead of calling `startMethodTracing()`) with a specified sampling\ninterval. The system gathers samples periodically until your app calls\n[stopMethodTracing()](/reference/android/os/Debug#stopMethodTracing()).\n\n### Save multiple logs\n\nIf your app starts and stops a method trace multiple times without specifying a\nnew name for the trace log, the device overwrites the older trace log with the\nnew one---that is, it only keeps the most recent trace log. To save multiple\ntrace logs to your device, dynamically rename the trace log each time your app\ncalls [startMethodTracing()](/reference/android/os/Debug#startMethodTracing()).\nThe sample below uses the [SimpleDateFormat](/reference/java/text/SimpleDateFormat)\nclass to include the current date and time when naming each trace log: \n\n### Kotlin\n\n```kotlin\n// Uses the \u003ccode\u003e\u003ca href=\"/reference/java/text/SimpleDateFormat.html\"\u003eSimpleDateFormat\u003c/a\u003e\u003c/code\u003e class to create a String with\n// the current date and time.\nval dateFormat: DateFormat = SimpleDateFormat(\"dd_MM_yyyy_hh_mm_ss\", Locale.getDefault())\nval logDate: String = dateFormat.format(Date())\n// Applies the date and time to the name of the trace log.\nDebug.startMethodTracing(\"sample-$logDate\")\n```\n\n### Java\n\n```java\n// Uses the \u003ccode\u003e\u003ca href=\"/reference/java/text/SimpleDateFormat.html\"\u003eSimpleDateFormat\u003c/a\u003e\u003c/code\u003e class to create a String with\n// the current date and time.\nSimpleDateFormat dateFormat =\n new SimpleDateFormat(\"dd_MM_yyyy_hh_mm_ss\", Locale.getDefault());\nString logDate = dateFormat.format(new Date());\n// Applies the date and time to the name of the trace log.\nDebug.startMethodTracing(\n \"sample-\" + logDate);\n```\n\nAccess trace logs on the device\n-------------------------------\n\nAfter the system creates the trace log on your device, you can access the file\nin one of the following ways:\n\n- [Use the Device Explorer](/studio/debug/device-file-explorer).\n To open the Device Explorer, click\n **View \\\u003e Tool Windows \\\u003e Device Explorer** (or click the\n **Device Explorer**\n button in the tool window bar). As shown in figure 1\n you can locate the `.trace` files by navigating to your app's\n package-specific directory.\n\n\n **Figure 1.** Locating the trace logs using the Device Explorer.\n\n \u003cbr /\u003e\n\n- Copy the file to your local machine using the `adb pull` command.\n The command below copies a trace log named `sample.trace` from the device to\n the `~/Documents/trace-logs/` directory of your local machine.\n\n ```\n adb pull path-on-device/sample.trace ~/Documents/trace-logs/\n ```\n\n \u003cbr /\u003e\n\nYou can then\n[import the trace file](/studio/profile/import-traces) with the CPU Profiler."]]