با ابزار دقیق برنامه خود، لاگ های ردیابی ایجاد کنید
با مجموعهها، منظم بمانید
ذخیره و طبقهبندی محتوا براساس اولویتهای شما.
برای ایجاد ردیابی متد از اجرای برنامه خود، می توانید برنامه خود را با استفاده از کلاس Debug
ابزارسازی کنید. ابزار دقیق برنامه خود را به این روش به شما کنترل بیشتری بر روی دقیقا زمانی که دستگاه شروع می شود و ضبط اطلاعات ردیابی را متوقف می کند. این دستگاه همچنین گزارش های ردیابی شما را با استفاده از نام هایی که شما مشخص می کنید ذخیره می کند، بنابراین بتوانید بعداً به راحتی هر گزارش را شناسایی کنید. سپس می توانید هر گزارش ردیابی را با استفاده از نمایه CPU Android Studio مشاهده کنید.
همچنین میتوانید ردیابی را در CPU Profiler بدون ابزار دقیق کد برنامهتان شروع و متوقف کنید .
قبل از شروع به تولید گزارشهای ردیابی، مطمئن شوید که برنامه شما منطقی برای ذخیره گزارشهای ردیابی در فهرست برنامههای خاص خود اضافه کرده است.
برنامه خود را ابزار کنید
برای ایجاد گزارشهای ردیابی، startMethodTracing()
را فراخوانی کنید، جایی که میخواهید سیستم شروع به ثبت دادههای ردیابی کند.
در فراخوانی، میتوانید نام فایل .trace
را مشخص کنید و سیستم آن را در یک پوشه مخصوص بسته ذخیره میکند که برای دادههای برنامه دائمی در دستگاه هدف در نظر گرفته شده است - این همان فهرستی است که توسط getExternalFilesDir()
بازگردانده میشود و در پوشه ~/sdcard/
در اکثر دستگاه ها قرار دارد. این فایل حاوی داده های ردیابی متد باینری و یک جدول نگاشت با رشته ها و نام های متد است. برای توقف ردیابی، stopMethodTracing()
را فراخوانی کنید.
نمونه زیر ضبط یک گزارش ردیابی را با نام sample.trace
شروع و متوقف می کند:
کاتلین
// Starts recording a trace log with the name you provide. For example, the
// following code tells the system to start recording a .trace file to the
// device with the name "sample.trace".
Debug.startMethodTracing("sample")
// The system begins buffering the generated trace data, until your
// application calls <code><a href="/reference/android/os/Debug.html#stopMethodTracing()">stopMethodTracing()</a></code>, at which time it writes
// the buffered data to the output file.
Debug.stopMethodTracing()
جاوا
// Starts recording a trace log with the name you provide. For example, the
// following code tells the system to start recording a .trace file to the
// device with the name "sample.trace".
Debug.startMethodTracing("sample");
...
// The system begins buffering the generated trace data, until your
// application calls <code><a href="/reference/android/os/Debug.html#stopMethodTracing()">stopMethodTracing()</a></code>, at which time it writes
// the buffered data to the output file.
Debug.stopMethodTracing();
توجه داشته باشید که اگر برنامه شما دوباره startMethodTracing()
بدون تغییر نام گزارش ردیابی فراخوانی کند، گزارش موجود ذخیره شده در دستگاه را بازنویسی می کند. برای یادگیری نحوه تغییر پویا نام هر گزارش ردیابی، به بخش ذخیره چندین گزارش بروید.
اگر سیستم قبل از فراخوانی stopMethodTracing()
به حداکثر اندازه بافر برسد، سیستم ردیابی را متوقف می کند و یک اعلان به کنسول ارسال می کند. روشهایی که ردیابی را شروع و متوقف میکنند در کل فرآیند برنامه شما کار میکنند. یعنی می توانید startMethodTracing()
در متد onCreate(Bundle)
فعالیت خود و stopMethodTracing()
در متد onDestroy()
آن فعالیت فراخوانی کنید.
توجه داشته باشید که وقتی پروفایل فعال است، برنامه شما کندتر اجرا می شود. یعنی، شما نباید از داده های پروفایل برای تعیین زمان بندی مطلق استفاده کنید (مانند، "method foo()
2.5 ثانیه طول می کشد تا اجرا شود"). اطلاعات زمانبندی در گزارشهای ردیابی فقط هنگام مقایسه آن با گزارشهای ردیابی قبلی مفید است، بنابراین میتوانید ببینید آیا تغییرات اخیر برنامه شما را سریعتر یا کندتر میکند.
هنگام استقرار در دستگاههای دارای Android نسخه 5.0 (سطح API 21) و بالاتر، میتوانید از نمایهسازی مبتنی بر نمونه برای نمایه با تأثیر کمتری بر عملکرد زمان اجرا استفاده کنید. برای فعال کردن پروفایل نمونه، startMethodTracingSampling()
(به جای فراخوانی startMethodTracing()
) را با بازه نمونه برداری مشخص فراخوانی کنید. سیستم به صورت دوره ای نمونه ها را جمع آوری می کند تا زمانی که برنامه شما stopMethodTracing()
را فراخوانی کند.
چندین گزارش را ذخیره کنید
اگر برنامه شما یک ردیابی روش را چندین بار بدون تعیین نام جدیدی برای گزارش ردیابی شروع و متوقف کند، دستگاه گزارش ردیابی قدیمیتر را با گزارش جدید بازنویسی میکند - یعنی فقط آخرین گزارش ردیابی را نگه میدارد. برای ذخیره چندین گزارش ردیابی در دستگاه خود، هر بار که برنامه شما با startMethodTracing()
تماس می گیرد، به صورت پویا نام گزارش ردیابی را تغییر دهید. نمونه زیر از کلاس SimpleDateFormat
استفاده میکند تا تاریخ و زمان فعلی را هنگام نامگذاری هر گزارش ردیابی شامل شود:
کاتلین
// Uses the <code><a href="/reference/java/text/SimpleDateFormat.html">SimpleDateFormat</a></code> class to create a String with
// the current date and time.
val dateFormat: DateFormat = SimpleDateFormat("dd_MM_yyyy_hh_mm_ss", Locale.getDefault())
val logDate: String = dateFormat.format(Date())
// Applies the date and time to the name of the trace log.
Debug.startMethodTracing("sample-$logDate")
جاوا
// Uses the <code><a href="/reference/java/text/SimpleDateFormat.html">SimpleDateFormat</a></code> class to create a String with
// the current date and time.
SimpleDateFormat dateFormat =
new SimpleDateFormat("dd_MM_yyyy_hh_mm_ss", Locale.getDefault());
String logDate = dateFormat.format(new Date());
// Applies the date and time to the name of the trace log.
Debug.startMethodTracing(
"sample-" + logDate);
به گزارشهای ردیابی روی دستگاه دسترسی داشته باشید
پس از اینکه سیستم گزارش ردیابی را در دستگاه شما ایجاد کرد، می توانید به یکی از روش های زیر به فایل دسترسی داشته باشید:
از Device Explorer استفاده کنید . برای باز کردن Device Explorer، روی View > Tool Windows > Device Explorer (یا روی Device Explorer کلیک کنید
دکمه در نوار پنجره ابزار). همانطور که در شکل 1 نشان داده شده است، می توانید فایل های .trace
را با پیمایش به دایرکتوری مخصوص بسته برنامه خود پیدا کنید.

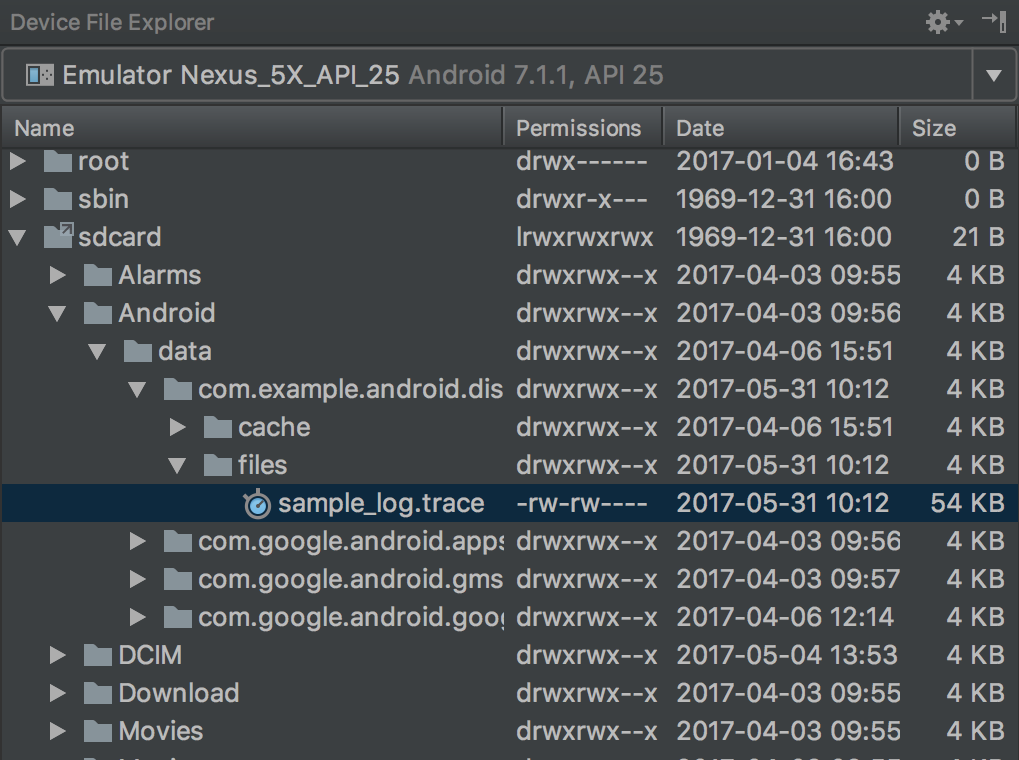
شکل 1. مکان یابی گزارش های ردیابی با استفاده از Device Explorer.
با استفاده از دستور adb pull
فایل را در دستگاه محلی خود کپی کنید. دستور زیر یک گزارش ردیابی به نام sample.trace
را از دستگاه در دایرکتوری ~/Documents/trace-logs/
ماشین محلی شما کپی می کند.
adb pull path-on-device/sample.trace ~/Documents/trace-logs/
سپس می توانید فایل ردیابی را با CPU Profiler وارد کنید .
محتوا و نمونه کدها در این صفحه مشمول پروانههای توصیفشده در پروانه محتوا هستند. جاوا و OpenJDK علامتهای تجاری یا علامتهای تجاری ثبتشده Oracle و/یا وابستههای آن هستند.
تاریخ آخرین بهروزرسانی 2025-07-29 بهوقت ساعت هماهنگ جهانی.
[[["درک آسان","easyToUnderstand","thumb-up"],["مشکلم را برطرف کرد","solvedMyProblem","thumb-up"],["غیره","otherUp","thumb-up"]],[["اطلاعاتی که نیاز دارم وجود ندارد","missingTheInformationINeed","thumb-down"],["بیشازحد پیچیده/ مراحل بسیار زیاد","tooComplicatedTooManySteps","thumb-down"],["قدیمی","outOfDate","thumb-down"],["مشکل ترجمه","translationIssue","thumb-down"],["مشکل کد / نمونهها","samplesCodeIssue","thumb-down"],["غیره","otherDown","thumb-down"]],["تاریخ آخرین بهروزرسانی 2025-07-29 بهوقت ساعت هماهنگ جهانی."],[],[],null,["# Generate Trace Logs by Instrumenting Your App\n\nTo generate a method trace of your app's execution, you can instrument your app\nusing the [Debug](/reference/android/os/Debug)\nclass. Instrumenting your app this way gives you more control over exactly when\nthe device starts and stops recording tracing information. The device also saves\nyour trace logs using the names you specify, so you can easily identify each log\nlater. You can then view each trace log using the Android Studio\n[CPU Profiler](/studio/profile/cpu-profiler).\n\nYou can also\n[start and stop tracing in the CPU Profiler](/studio/profile/cpu-profiler#method_traces)\nwithout instrumenting your app's code.\n\nBefore you start generating trace logs, make sure your app has added logic to\nsave trace logs to its [app-specific\ndirectory](/training/data-storage/app-specific).\n\nInstrument your app\n-------------------\n\nTo create trace logs, call [startMethodTracing()](/reference/android/os/Debug#startMethodTracing())\nwhere you want the system to start logging tracing data.\n\nIn the call, you can specify the name for the\n`.trace` file, and the system saves it to a package-specific\ndirectory that's intended for persistent app data on the target device---this is\nthe same directory that is returned by\n[getExternalFilesDir()](/reference/android/content/Context#getExternalFilesDir(java.lang.String))\nand is located in the `~/sdcard/` directory on most devices.\nThis file contains the binary method trace data and a mapping table with thread\nand method names. To stop tracing, call\n[stopMethodTracing()](/reference/android/os/Debug#stopMethodTracing()).\n\nThe following sample starts and stops recording a trace log with the name\n`sample.trace`: \n\n### Kotlin\n\n```kotlin\n// Starts recording a trace log with the name you provide. For example, the\n// following code tells the system to start recording a .trace file to the\n// device with the name \"sample.trace\".\nDebug.startMethodTracing(\"sample\")\n\n// The system begins buffering the generated trace data, until your\n// application calls \u003ccode\u003e\u003ca href=\"/reference/android/os/Debug.html#stopMethodTracing()\"\u003estopMethodTracing()\u003c/a\u003e\u003c/code\u003e, at which time it writes\n// the buffered data to the output file.\nDebug.stopMethodTracing()\n```\n\n### Java\n\n```java\n// Starts recording a trace log with the name you provide. For example, the\n// following code tells the system to start recording a .trace file to the\n// device with the name \"sample.trace\".\nDebug.startMethodTracing(\"sample\");\n...\n// The system begins buffering the generated trace data, until your\n// application calls \u003ccode\u003e\u003ca href=\"/reference/android/os/Debug.html#stopMethodTracing()\"\u003estopMethodTracing()\u003c/a\u003e\u003c/code\u003e, at which time it writes\n// the buffered data to the output file.\nDebug.stopMethodTracing();\n```\n\nNote that if your app calls the\n[startMethodTracing()](/reference/android/os/Debug#startMethodTracing())\nagain without changing the name of the trace log, it overwrites the existing log\nsaved to the device. To learn how to dynamically change the name of each trace\nlog, go to the section about [saving multiple logs](#save_multiple_logs).\n\nIf the system reaches the maximum buffer size before you call\n[stopMethodTracing()](/reference/android/os/Debug#stopMethodTracing()),\nthe system stops tracing and sends a notification to the console.\nThe methods that start and stop traces work across your entire app process. That\nis, you could call\n[startMethodTracing()](/reference/android/os/Debug#startMethodTracing())\nin your activity's\n[onCreate(Bundle)](/reference/android/app/Activity#onCreate(android.os.Bundle))\nmethod, and call [stopMethodTracing()](/reference/android/os/Debug#stopMethodTracing())\nin that activity's [onDestroy()](/reference/android/app/Activity#onDestroy())\nmethod.\n\nNote that your app runs more slowly when profiling is enabled. That is, you\nshouldn't use the profiling data to determine absolute timings (such as, \"method\n`foo()` takes 2.5 seconds to run\"). The timing information in the trace logs are\nuseful only when comparing it to previous trace logs, so you can see if recent\nchanges make your app faster or slower.\n\nWhen deploying to devices running Android 5.0 (API level 21) and higher, you can\nuse sample-based profiling to profile with less runtime performance impact. To\nenable sample profiling, call\n[startMethodTracingSampling()](/reference/android/os/Debug#startMethodTracingSampling(java.lang.String, int, int))\n(instead of calling `startMethodTracing()`) with a specified sampling\ninterval. The system gathers samples periodically until your app calls\n[stopMethodTracing()](/reference/android/os/Debug#stopMethodTracing()).\n\n### Save multiple logs\n\nIf your app starts and stops a method trace multiple times without specifying a\nnew name for the trace log, the device overwrites the older trace log with the\nnew one---that is, it only keeps the most recent trace log. To save multiple\ntrace logs to your device, dynamically rename the trace log each time your app\ncalls [startMethodTracing()](/reference/android/os/Debug#startMethodTracing()).\nThe sample below uses the [SimpleDateFormat](/reference/java/text/SimpleDateFormat)\nclass to include the current date and time when naming each trace log: \n\n### Kotlin\n\n```kotlin\n// Uses the \u003ccode\u003e\u003ca href=\"/reference/java/text/SimpleDateFormat.html\"\u003eSimpleDateFormat\u003c/a\u003e\u003c/code\u003e class to create a String with\n// the current date and time.\nval dateFormat: DateFormat = SimpleDateFormat(\"dd_MM_yyyy_hh_mm_ss\", Locale.getDefault())\nval logDate: String = dateFormat.format(Date())\n// Applies the date and time to the name of the trace log.\nDebug.startMethodTracing(\"sample-$logDate\")\n```\n\n### Java\n\n```java\n// Uses the \u003ccode\u003e\u003ca href=\"/reference/java/text/SimpleDateFormat.html\"\u003eSimpleDateFormat\u003c/a\u003e\u003c/code\u003e class to create a String with\n// the current date and time.\nSimpleDateFormat dateFormat =\n new SimpleDateFormat(\"dd_MM_yyyy_hh_mm_ss\", Locale.getDefault());\nString logDate = dateFormat.format(new Date());\n// Applies the date and time to the name of the trace log.\nDebug.startMethodTracing(\n \"sample-\" + logDate);\n```\n\nAccess trace logs on the device\n-------------------------------\n\nAfter the system creates the trace log on your device, you can access the file\nin one of the following ways:\n\n- [Use the Device Explorer](/studio/debug/device-file-explorer).\n To open the Device Explorer, click\n **View \\\u003e Tool Windows \\\u003e Device Explorer** (or click the\n **Device Explorer**\n button in the tool window bar). As shown in figure 1\n you can locate the `.trace` files by navigating to your app's\n package-specific directory.\n\n\n **Figure 1.** Locating the trace logs using the Device Explorer.\n\n \u003cbr /\u003e\n\n- Copy the file to your local machine using the `adb pull` command.\n The command below copies a trace log named `sample.trace` from the device to\n the `~/Documents/trace-logs/` directory of your local machine.\n\n ```\n adb pull path-on-device/sample.trace ~/Documents/trace-logs/\n ```\n\n \u003cbr /\u003e\n\nYou can then\n[import the trace file](/studio/profile/import-traces) with the CPU Profiler."]]