Merekam pelacakan sistem
Tetap teratur dengan koleksi
Simpan dan kategorikan konten berdasarkan preferensi Anda.
Rekaman aktivitas sistem menampilkan aktivitas dan penggunaan resource di seluruh sistem, sehingga Anda dapat melihat cara proses aplikasi dijadwalkan dan dijalankan. Tampilan rekaman aktivitas sistem di
Profiler Android Studio biasanya digunakan untuk menyelidiki hal berikut:
- Cara proses aplikasi dan sistem didistribusikan di seluruh inti dan thread perangkat.
- Seberapa lancar UI dirender.
- Penggunaan daya di tingkat perangkat dan aplikasi.
Halaman ini memberikan ringkasan visual yang paling umum digunakan dalam tampilan rekaman aktivitas sistem. Lihat glosarium diagram
untuk mengetahui detail selengkapnya tentang visualisasi yang tidak dijelaskan di sini. Untuk contoh yang lebih mendetail tentang penggunaan rekaman aktivitas sistem, lihat halaman lain di bagian ini.
Setelah Anda merekam pelacakan sistem, Anda akan melihat
visualisasi berikut ditampilkan di linimasa. Anda harus berfokus pada korelasi berbagai resource sistem; misalnya, jika Anda melihat lonjakan pada jalur daya modem, Anda harus membuka bagian thread dan melihat aktivitas thread apa yang dapat menyebabkan lonjakan pada saat itu.
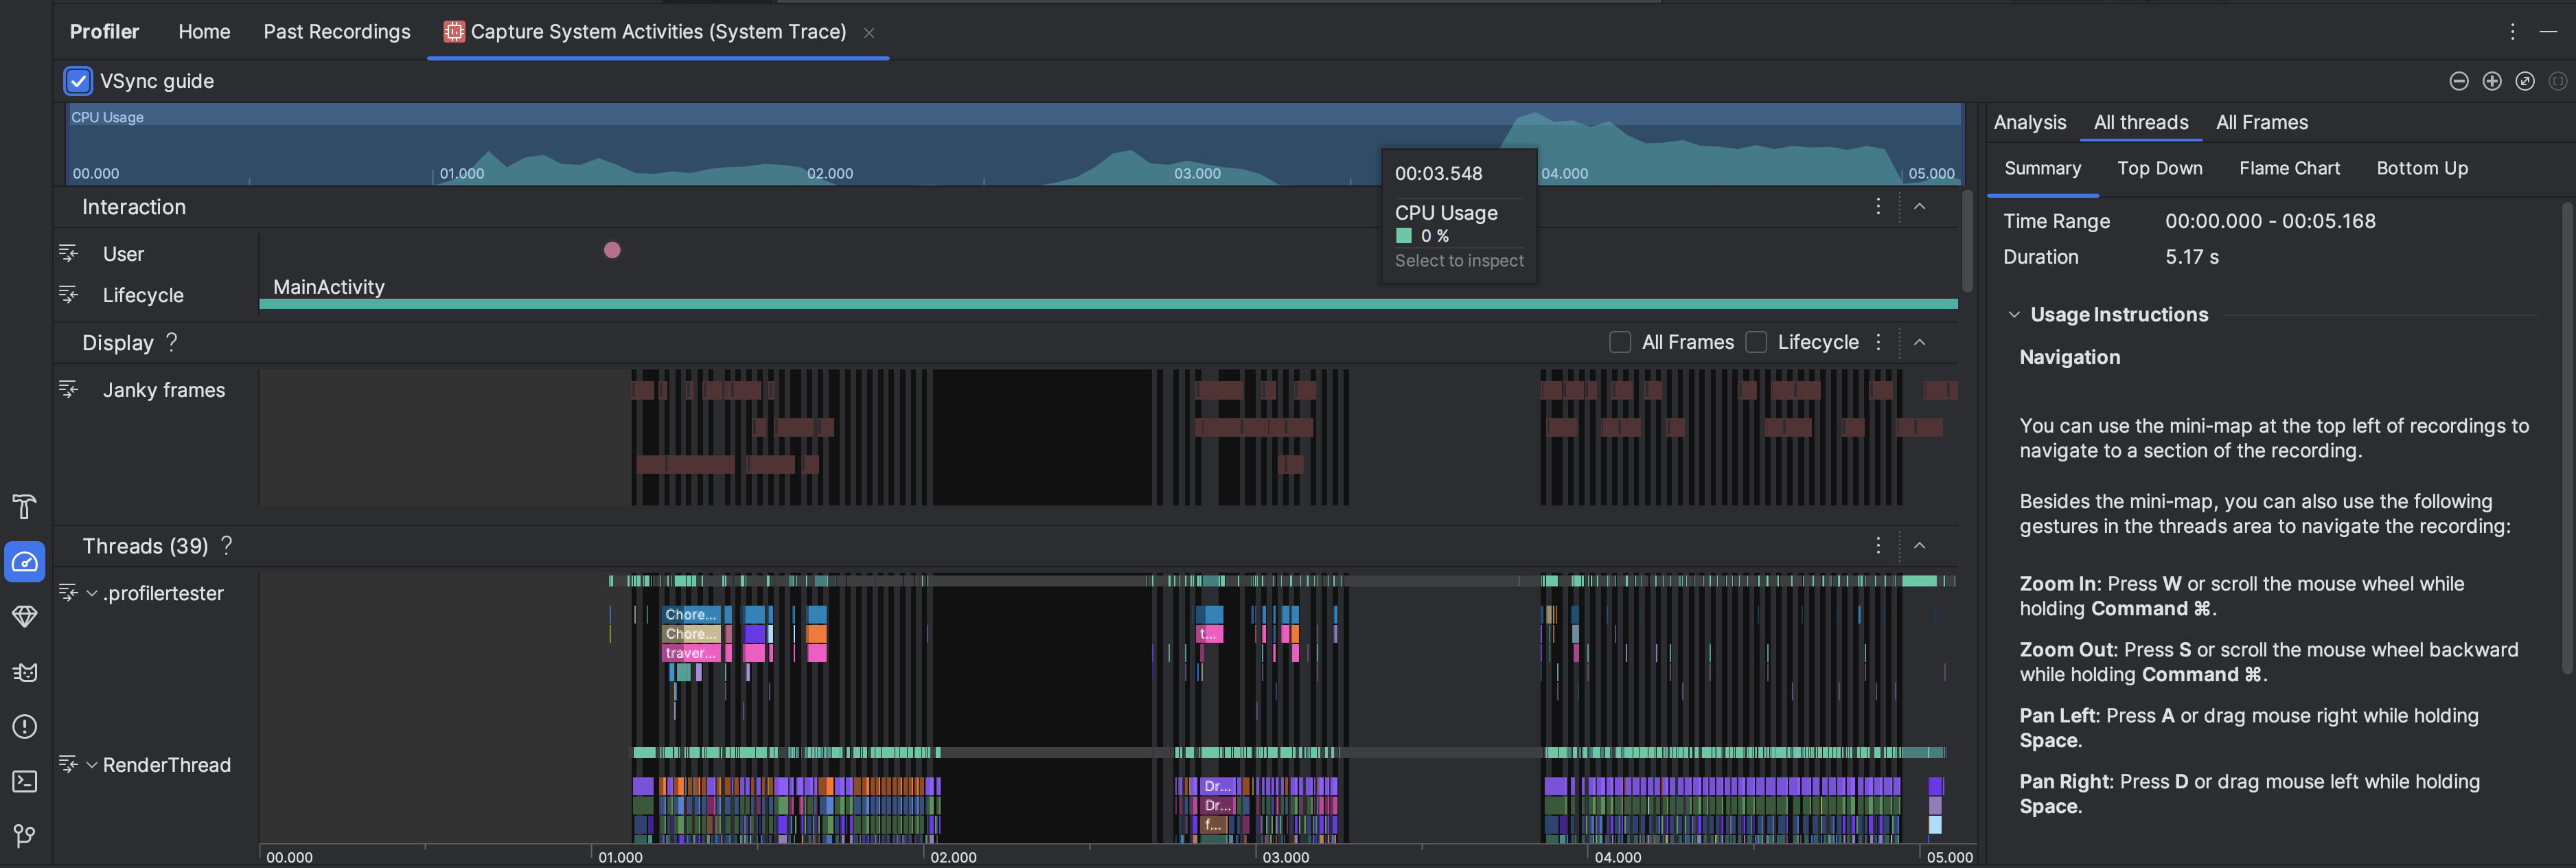
- Penggunaan CPU: Menampilkan penggunaan CPU aplikasi Anda sebagai persentase dari total kapasitas CPU yang tersedia menurut waktu. Tandai bagian linimasa untuk memfilter detail jangka waktu tersebut.
- Interaksi: Menampilkan interaksi pengguna dan peristiwa siklus proses aplikasi di sepanjang
linimasa (memerlukan proses aplikasi yang dapat di-debug
dan perangkat yang menjalankan level API 26 atau yang lebih tinggi).
- Tampilan: Menampilkan info terkait kelancaran rendering UI aplikasi Anda. Pilih
Siklus Proses untuk memeriksa waktu yang dibutuhkan aplikasi untuk merender setiap frame pada
thread utama dan
RenderThread
. Info ini berguna untuk menyelidiki
hambatan yang menyebabkan jank pada UI dan frekuensi gambar rendah.
Threads: Menampilkan thread yang dijalankan aplikasi Anda dan berbagai proses sistem. Untuk mempelajari cara menggunakan rekaman aktivitas sistem guna menyelidiki dan membantu mengurangi jank UI, lihat Mendeteksi jank UI.
Tips: Saat memeriksa linimasa
Threads, tersedia pintasan
berikut:
- Memperbesar: Tekan W atau scroll roda mouse sambil
menahan Ctrl (Command di macOS).
- Memperkecil: Tekan S atau scroll roda mouse ke belakang
sambil menahan Ctrl (Command di macOS).
- Menggeser ke kiri: Tekan A atau tarik mouse ke kanan sambil
menahan Spasi.
- Menggeser ke kanan: Tekan D atau tarik mouse ke kiri sambil menahan
Spasi.
- Meluaskan atau menciutkan thread: Klik dua kali nama thread atau
tekan Enter saat thread dipilih.
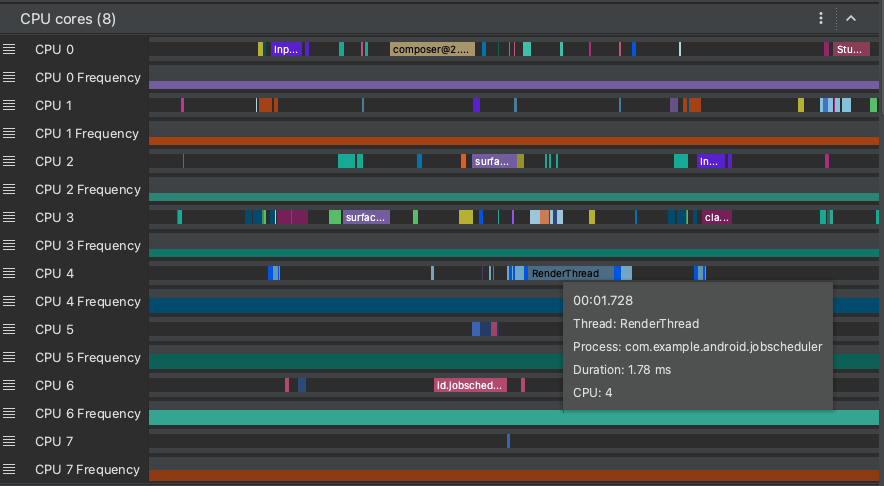
Inti CPU: Menampilkan aktivitas di setiap inti pada perangkat Anda. Melihat
aktivitas menurut inti dapat memberi Anda gambaran tentang inti mana yang merupakan inti"besar" atau
"kecil" dalam
prosesor seluler modern. Arahkan kursor ke aktivitas thread untuk
melihat thread mana yang dijalankan inti ini pada waktu tertentu.
Memori Proses (RSS): Menampilkan jumlah memori fisik yang saat ini digunakan
oleh aplikasi. Untuk mengetahui detail selengkapnya, lihat glosarium diagram.
Power Rails: Muncul saat Anda membuat profil di perangkat fisik. Untuk mengetahui info selengkapnya, lihat Memeriksa penggunaan daya.
Baterai: Menampilkan penggunaan baterai aplikasi Anda.
Konten dan contoh kode di halaman ini tunduk kepada lisensi yang dijelaskan dalam Lisensi Konten. Java dan OpenJDK adalah merek dagang atau merek dagang terdaftar dari Oracle dan/atau afiliasinya.
Terakhir diperbarui pada 2025-07-27 UTC.
[[["Mudah dipahami","easyToUnderstand","thumb-up"],["Memecahkan masalah saya","solvedMyProblem","thumb-up"],["Lainnya","otherUp","thumb-up"]],[["Informasi yang saya butuhkan tidak ada","missingTheInformationINeed","thumb-down"],["Terlalu rumit/langkahnya terlalu banyak","tooComplicatedTooManySteps","thumb-down"],["Sudah usang","outOfDate","thumb-down"],["Masalah terjemahan","translationIssue","thumb-down"],["Masalah kode / contoh","samplesCodeIssue","thumb-down"],["Lainnya","otherDown","thumb-down"]],["Terakhir diperbarui pada 2025-07-27 UTC."],[],[],null,["# Record a system trace\n\nA system trace shows you system-wide activities and resource usage, so you can\nsee how your app processes are scheduled and run. The system trace view in the\nAndroid Studio Profiler is commonly used to investigate the following:\n\n- How app and system processes are distributed across device cores and threads.\n- How smoothly the UI renders.\n- Power usage at both the device and app level.\n\nThis page provides an overview of the most commonly used visuals in the system\ntrace view. See the [chart glossary](/studio/profile/chart-glossary/flame-chart)\nfor more details about visualizations not described here. For more detailed\nexamples of what to use a system trace for, see the other pages in this section.\n\nAfter you [record a system trace](/studio/profile#start-profiling), you see the\nfollowing visualizations displayed over a timeline. You should focus on how\ndifferent system resources are correlated; for example, if you notice a spike in\nthe modem power rail, you should go to the threads section and see what thread\nactivity could be causing the spike at the time.\n\n- **CPU Usage**: Shows CPU usage of your app as a percentage of total available CPU capacity by time. Highlight a section of the timeline to filter to the details for that time period.\n- **Interactions** : Shows user interaction and app lifecycle events along a timeline (requires a [debuggable](/studio/profile#profileable-v-debuggable) app process and a device running API level 26 or higher).\n- **Display** : Shows info related to how smooth your app UI renders. Select **Lifecycle** to inspect how long it takes your app to render each frame on the main thread and `RenderThread`. This info is helpful for [investigating\n bottlenecks that cause UI jank and low\n framerates](/studio/profile/jank-detection).\n- **Threads** : Shows the threads that your app and various system processes run\n on. To learn about how to use system traces to investigate and help reduce UI\n jank, see [Detect UI jank](/studio/profile/jank-detection).\n\n **Tip:** When inspecting the **Threads** timeline, the following shortcuts are available:\n - **Zoom in:** Press \u003ckbd\u003eW\u003c/kbd\u003e or scroll the mouse wheel while holding \u003ckbd\u003eCtrl\u003c/kbd\u003e (\u003ckbd\u003eCommand\u003c/kbd\u003e on macOS).\n - **Zoom out:** Press \u003ckbd\u003eS\u003c/kbd\u003e or scroll the mouse wheel backward while holding \u003ckbd\u003eCtrl\u003c/kbd\u003e (\u003ckbd\u003eCommand\u003c/kbd\u003e on macOS).\n - **Pan left:** Press \u003ckbd\u003eA\u003c/kbd\u003e or drag mouse right while holding \u003ckbd\u003eSpace\u003c/kbd\u003e.\n - **Pan right:** Press \u003ckbd\u003eD\u003c/kbd\u003e or drag mouse left while holding \u003ckbd\u003eSpace\u003c/kbd\u003e.\n - **Expand or collapse a thread:** Double-click the thread name or press \u003ckbd\u003eEnter\u003c/kbd\u003e while a thread is selected.\n- **CPU cores** : Shows the activity on each core in your device. Viewing the\n activity by core might give you an idea of which ones are the [\"big\" or\n \"little\" cores](https://en.wikipedia.org/wiki/ARM_big.LITTLE) in\n modern mobile processors. Hold the pointer over a thread activity to\n see which thread this core is running on at that particular time.\n\n- **Process Memory (RSS)**: Shows the amount of physical memory currently in use\n by the app. For more details, see the chart glossary.\n\n- **Power Rails** : Appears when you profile on a physical device. For more info,\n see [Inspect power usage](/studio/profile/power-profiler).\n\n- **Battery**: Shows your app's battery usage."]]