하향식 및 하향식 차트
컬렉션을 사용해 정리하기
내 환경설정을 기준으로 콘텐츠를 저장하고 분류하세요.
Top Down 탭에는 메서드 또는 함수 노드를 확장하면 피호출자가 표시되는 호출 목록이 표시됩니다. 그림 2에는 다음 호출 차트에 관한 하향식 그래프가 표시되어 있습니다. 그래프의 각 화살표가 호출자에서 피호출자를 가리킵니다.
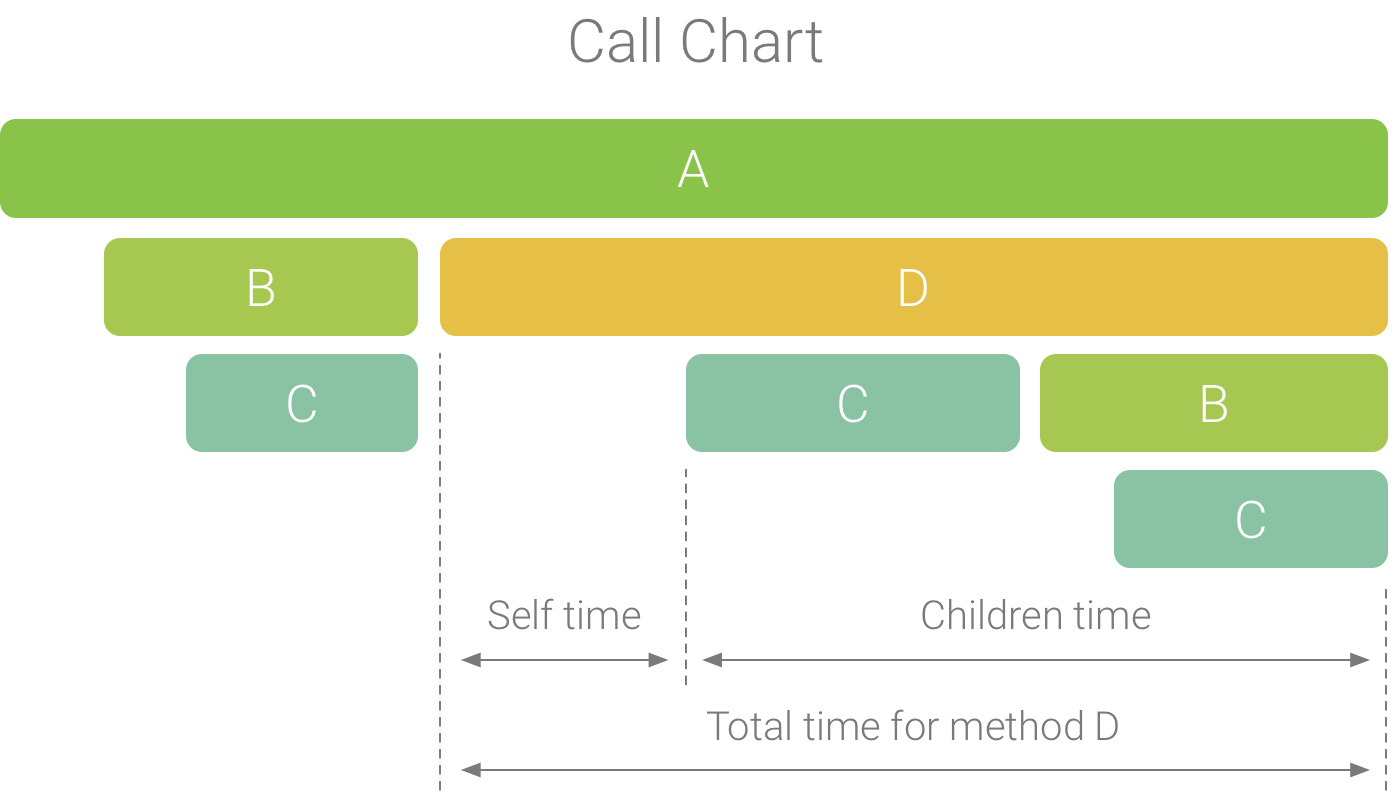
그림 1. 메서드 D의 Self 시간, Children 시간, Total 시간을 보여주는 호출 차트의 예
그림 2와 같이 Top Down 탭에서 메서드 A의 노드를 확장하면 피호출자인 메서드 B와 D가 표시됩니다. 그런 다음 메서드 D의 노드를 확장하면 메서드 B와 C와 같은 피호출자가 노출됩니다. Flame chart 탭과 마찬가지로 하향식 트리는 같은 호출 스택을 공유하는 동일한 메서드의 트레이스 정보를 집계합니다. 즉, Flame chart 탭에는 Top Down 탭이 그래픽으로 표시됩니다.
Top Down 탭에는 각 호출에 사용된 CPU 시간을 설명하는 데 도움이 되는 다음과 같은 정보가 표시됩니다 (시간은 선택된 범위에 대한 스레드의 총 시간의 비율로도 표시됨).
- Self: 그림 1에 메서드 D에 관해 표시된 대로, 메서드 또는 함수 호출에서 피호출자의 코드가 아니라 자체 코드를 실행하는 데 사용한 시간.
- Children: 그림 1에 메서드 D에 관해 표시된 대로, 메서드 또는 함수 호출에서 자체 코드가 아니라 피호출자를 실행하는 데 사용한 시간.
- Total: 메서드의 Self 및 Children 시간의 합. 그림 1에 메서드 D에 관해 표시된 대로, 앱에서 호출을 실행하는 데 사용된 총 시간을 나타냅니다.
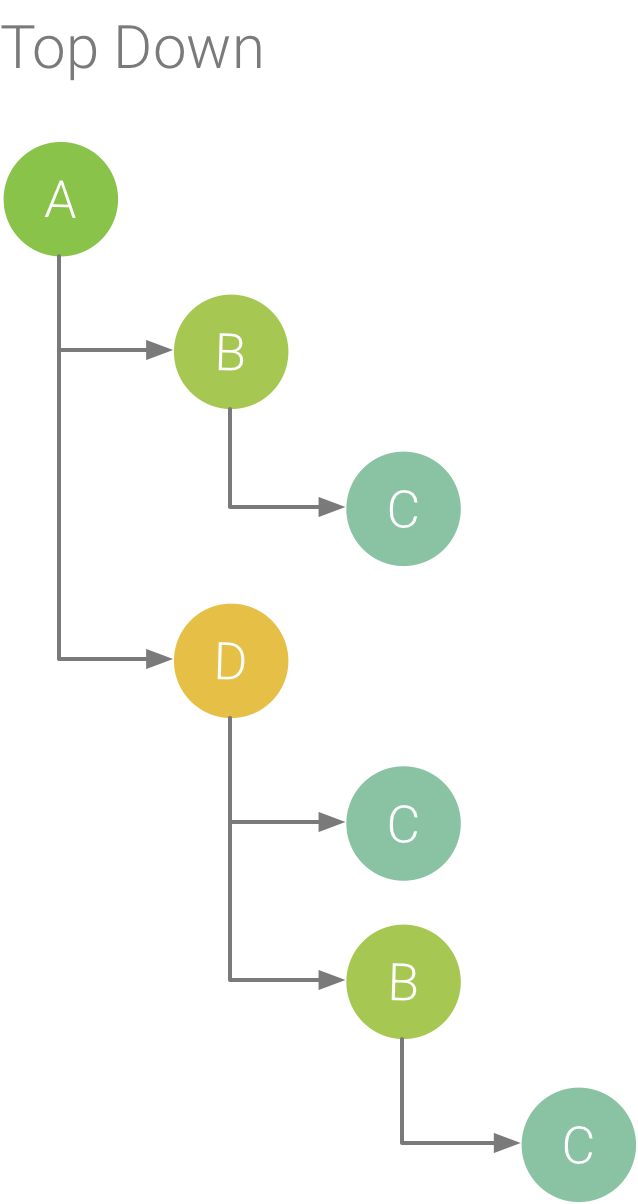
그림 2. Top Down 트리
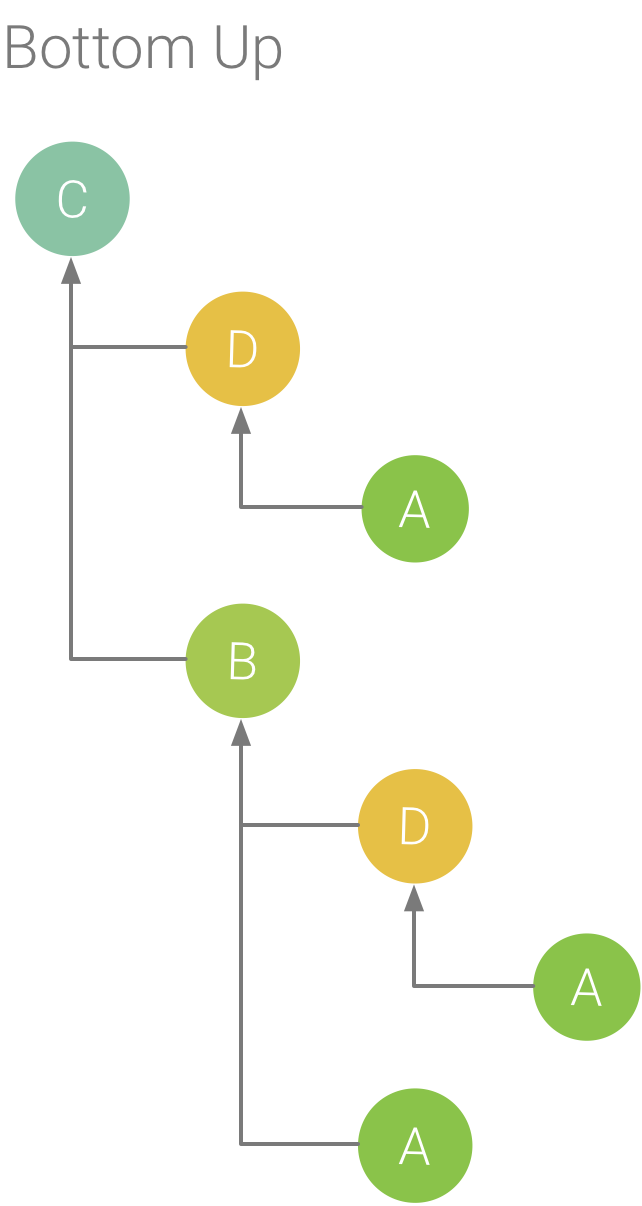
그림 3. 그림 5의 메서드 C에 관한 Bottom Up 트리
Bottom Up 탭에는 함수 또는 메서드의 노드를 확장하면 호출자가 표시되는 호출 목록이 표시됩니다. 그림 3은 그림 2의 트레이스 예를 사용하여 메서드 C의 상향식 트리를 제공합니다. 상향식 트리에서 메서드 C의 노드를 열면 고유한 호출자인 메서드 B와 D가 각각 표시됩니다. B가 C를 두 번 호출하지만 B는 상향식 트리에서 메서드 C의 노드를 확장할 때 한 번만 표시됩니다. 그런 다음 B의 노드를 확장하면 B의 호출자인 메서드 A와 D가 표시됩니다.
Bottom Up 탭은 CPU 시간을 가장 많이(또는 가장 적게) 소비하는 메서드 또는 함수를 정렬하는 데 유용합니다. 각 노드를 검사하여 어느 호출자가 메서드 또는 함수를 호출하기 위해 CPU 시간을 가장 많이 사용하는지 확인할 수 있습니다.
하향식 트리와 비교하여, 상향식 트리에 있는 각 메서드 또는 함수의 타이밍 정보는 각 트리의 상단에 있는 메서드(최상위 노드)에 관한 것입니다.
CPU 시간은 해당 기록 중 스레드의 총 시간의 비율로도 표시됩니다. 다음 표에서는 최상위 노드 및 그 호출자(하위 노드)의 타이밍 정보를 해석하는 방법을 설명합니다.
|
Self |
Children |
Total |
상향식 트리의 상단에 있는 메서드 또는 함수(최상위 노드) |
메서드 또는 함수에서 피호출자의 코드가 아니라 자체 코드를 실행하는 데 사용된 총 시간을 나타냅니다. 하향식 트리와 비교하여, 이 타이밍 정보는 기록 기간에 이 메서드 또는 함수의 모든 호출의 합을 나타냅니다.
|
메서드 또는 함수에서 자체 코드가 아니라 피호출자를 실행하는 데 사용된 총 시간을 나타냅니다. 하향식 트리와 비교하여, 이 타이밍 정보는 기록 기간에 이 메서드 또는 함수의 피호출자의 모든 호출의 합을 나타냅니다.
|
Self 시간과 Children 시간의 합
|
호출자(하위 노드) |
호출자에 의해 호출될 때 피호출자의 총 Self 시간을 나타냅니다. 예를 들어, 그림 6의 상향식 트리에서 메서드 B의 Self 시간은 B에 의해 호출될 때 메서드 C의 각 실행에 관한 Self 시간의 합과 같습니다.
|
호출자에 의해 호출될 때 피호출자의 총 Children 시간을 나타냅니다. 예를 들어, 그림 6의 상향식 트리에서 메서드 B의 Children 시간은 B에 의해 호출될 때 메서드 C의 각 실행에 관한 Children 시간의 합과 같습니다.
|
Self 시간과 Children 시간의 합
|
참고: 주어진 기록에 관해 프로파일러가 파일 크기 한도에 도달하면 Android 스튜디오에서 새로운 데이터 수집을 중지합니다(하지만 기록이 중단되지는 않습니다). 계측된 트레이스에서는 샘플링된 트레이스보다 짧은 기간에 더 많은 데이터를 수집하므로 계측된 트레이스를 수행하면 보통 이런 상황이 훨씬 더 빠르게 발생합니다. 검사 시간을 한도에 도달한 후 발생한 기록 기간으로 확장해도 사용 가능한 새로운 데이터가 없으므로 트레이스 창의 타이밍 데이터가 변경되지 않습니다. 또한 사용 가능한 데이터가 없는 기록 부분만 선택하는 경우 트레이스 창에 타이밍 정보로 NaN이 표시됩니다.
이 페이지에 나와 있는 콘텐츠와 코드 샘플에는 콘텐츠 라이선스에서 설명하는 라이선스가 적용됩니다. 자바 및 OpenJDK는 Oracle 및 Oracle 계열사의 상표 또는 등록 상표입니다.
최종 업데이트: 2025-07-27(UTC)
[[["이해하기 쉬움","easyToUnderstand","thumb-up"],["문제가 해결됨","solvedMyProblem","thumb-up"],["기타","otherUp","thumb-up"]],[["필요한 정보가 없음","missingTheInformationINeed","thumb-down"],["너무 복잡함/단계 수가 너무 많음","tooComplicatedTooManySteps","thumb-down"],["오래됨","outOfDate","thumb-down"],["번역 문제","translationIssue","thumb-down"],["샘플/코드 문제","samplesCodeIssue","thumb-down"],["기타","otherDown","thumb-down"]],["최종 업데이트: 2025-07-27(UTC)"],[],[],null,["# Top down and bottom up charts\n\nThe **Top Down** tab displays a list of calls in which expanding a method or\nfunction node displays its callees. Figure 2 shows a top down graph for the\nfollowing call chart. Each arrow in the graph points from a caller to a callee.\n\n\n**Figure 1.** An example call chart that illustrates\nself, children, and total time for method D.\n\n\u003cbr /\u003e\n\nAs shown in Figure 2, expanding the node for method A in the **Top Down** tab\ndisplays its callees, methods B and D. After that, expanding the node for method\nD exposes its callees, such as methods B and C. Similar to the\n[**Flame chart**](/studio/profile/chart-glossary/flame-chart) tab, the top down\ntree aggregates trace information for identical methods that share the same call\nstack. That is, the **Flame chart** tab provides a graphical representation of\nthe **Top Down** tab.\n\nThe **Top Down** tab provides the following information to help describe CPU\ntime spent on each call (times are also represented as a percentage of the\nthread's total time over the selected range):\n\n- **Self:** the time the method or function call spent executing its own code and not that of its callees, as illustrated in Figure 1 for method D.\n- **Children:** the time the method or function call spent executing its callees and not its own code, as illustrated in Figure 1 for method D.\n- **Total:** the sum of the method's **Self** and **Children** time. This represents the total time the app spent executing a call, as illustrated in Figure 1 for method D.\n\n**Figure 2.** A Top Down tree.\n\n\u003cbr /\u003e\n\n**Figure 3.** A Bottom Up tree for method C from\nFigure 5.\n\n\u003cbr /\u003e\n\nThe **Bottom Up** tab displays a list of calls in which expanding a function or\nmethod's node displays its callers. Using the example trace shown in Figure 2,\nfigure 3 provides a bottom up tree for method C. Opening the node for method C\nin the bottom up tree displays each of its unique callers, methods B and D. Note\nthat, although B calls C twice, B appears only once when expanding the node for\nmethod C in the bottom up tree. After that, expanding the node for B displays\nits caller, methods A and D.\n\nThe **Bottom Up** tab is useful for sorting methods or functions by those that\nconsume the most (or least) CPU time. You can inspect each node to determine\nwhich callers spend the most CPU time invoking those methods or functions.\nCompared to the top down tree, timing info for each method or function in a\nbottom up tree is in reference to the method at the top of each tree (top node).\nCPU time is also represented as a percentage of the thread's total time during\nthat recording. The following table helps explain how to interpret timing\ninformation for the top node and its callers (sub-nodes).\n\n| | Self | Children | Total |\n| Method or function at the top of the bottom up tree (top node) | Represents the total time the method or function spent executing its own code and not that of its callees. Compared to the top down tree, this timing information represents a sum of all calls to this method or function over the duration of the recording. | Represents the total time the method or function spent executing its callees and not its own code. Compared to the top down tree, this timing information represents the sum of all calls to this method or function's callees over the duration of the recording. | The sum of the self time and children time. |\n| Callers (sub-nodes) | Represents the total self time of the callee when being called by the caller. Using the bottom up tree in Figure 6 as an example, the self time for method B would equal the sum of the self times for each execution of method C when called by B. | Represents the total children time of the callee when being invoked by the caller. Using the bottom up tree in Figure 6 as an example, the children time for method B would equal the sum of the children times for each execution of method C when called by B. | The sum of the self time and children time. |\n|----------------------------------------------------------------|----------------------------------------------------------------------------------------------------------------------------------------------------------------------------------------------------------------------------------------------------------------|--------------------------------------------------------------------------------------------------------------------------------------------------------------------------------------------------------------------------------------------------------------------|---------------------------------------------|\n\n\n**Note:** For a given recording, Android Studio stops collecting new data\nwhen the profiler reaches the file size limit (however, this does not stop the\nrecording). This typically happens much more quickly when performing\ninstrumented traces because this type of tracing collects more data in a shorter\ntime, compared to a sampled trace. If you extend the inspection time into a\nperiod of the recording that occurred after reaching the limit, timing data in\nthe trace pane does not change (because no new data is available). Additionally,\nthe trace pane displays **NaN** for timing information when you select only\nthe portion of a recording that has no data available."]]