Flame Chart
컬렉션을 사용해 정리하기
내 환경설정을 기준으로 콘텐츠를 저장하고 분류하세요.
Flame Chart 탭에는 동일한 호출 스택을 집계하는 반전 호출 차트가 표시됩니다. 즉, 같은 호출자 순서를 공유하는 동일한 메서드 또는 함수가 수집되어 Flame Chart에 (호출 차트에 표시된 것처럼 짧은 막대 여러 개가 아니라) 긴 막대 하나로 표시됩니다. 따라서 어느 메서드 또는 함수가 가장 많은 시간을 소비하는지 더 쉽게 확인할 수 있습니다. 하지만 가로축은 타임라인을 표시하지 않으며 대신 각 메서드 또는 함수가 실행되는 데 걸리는 상대적인 시간을 나타냅니다.
이 개념을 설명하려면 그림 1의 호출 차트를 이용해보세요. 메서드 D는 B를 여러 번 호출하며(B1, B2, B3) 그중 일부는 C를 호출합니다(C1 및 C3).
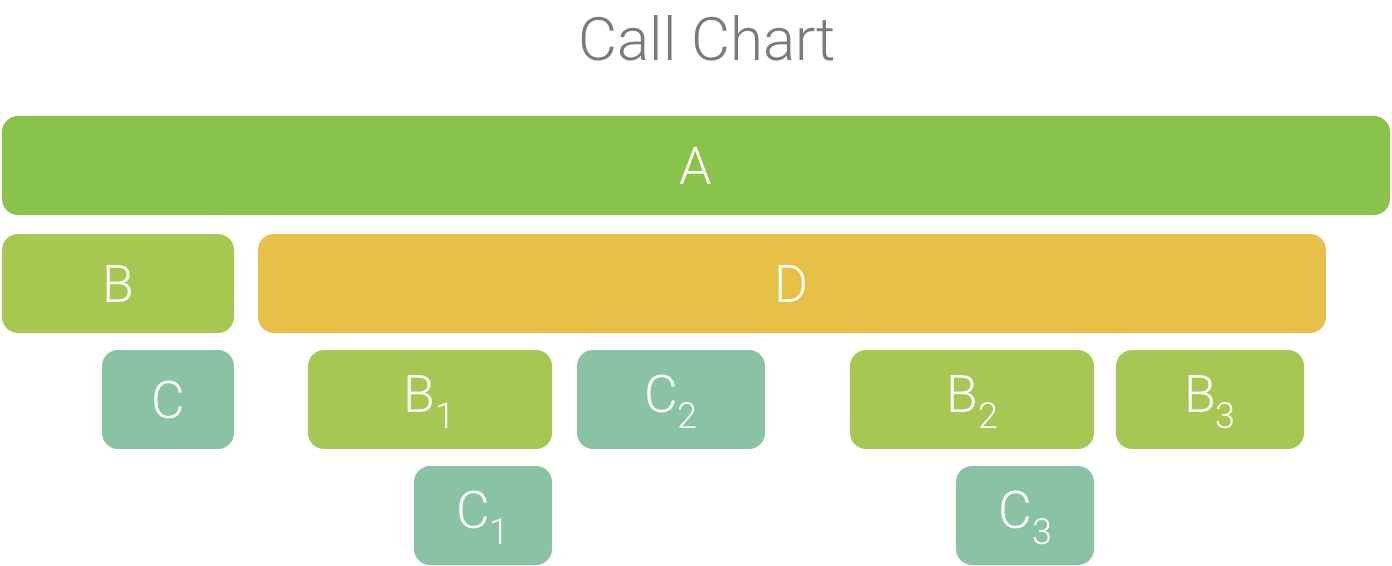
그림 1. 여러 메서드 호출에서 공통된 호출자 순서를 공유하는 호출 차트
B1, B2, B3은 동일한 호출자 순서 (A → D → B)를 공유하므로 그림 2와 같이 집계됩니다. 마찬가지로 C1과 C3도 동일한 호출자 순서(A → D → B → C)를 공유하므로 집계됩니다. C2는 호출자 순서(A → D → C)가 다르기 때문에 포함되지 않습니다.
그림 2. 같은 호출 스택을 공유하는 동일한 메서드 집계
집계된 호출은 그림 3에 표시된 것과 같은 Flame Chart를 만드는 데 사용됩니다.
Flame Chart의 각 호출에 관해 CPU 시간을 가장 많이 소비하는 피호출자가 먼저 표시됩니다.
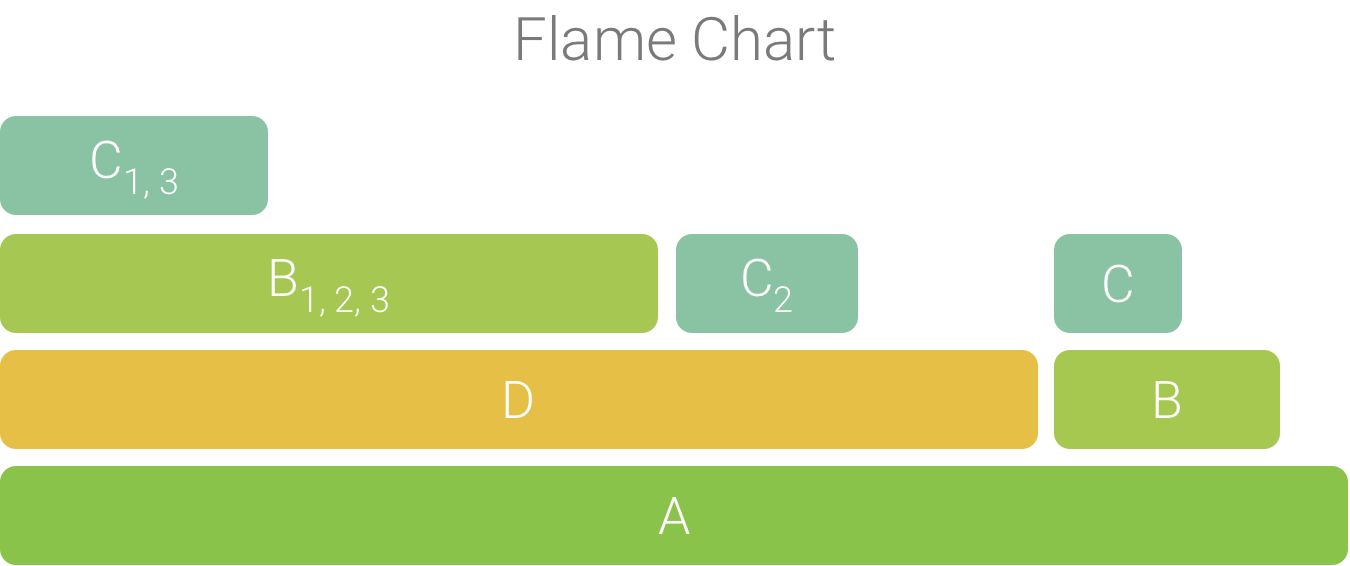
그림 3. 그림 5에 표시된 호출 차트를 표현한 Flame Chart
이 페이지에 나와 있는 콘텐츠와 코드 샘플에는 콘텐츠 라이선스에서 설명하는 라이선스가 적용됩니다. 자바 및 OpenJDK는 Oracle 및 Oracle 계열사의 상표 또는 등록 상표입니다.
최종 업데이트: 2025-07-27(UTC)
[[["이해하기 쉬움","easyToUnderstand","thumb-up"],["문제가 해결됨","solvedMyProblem","thumb-up"],["기타","otherUp","thumb-up"]],[["필요한 정보가 없음","missingTheInformationINeed","thumb-down"],["너무 복잡함/단계 수가 너무 많음","tooComplicatedTooManySteps","thumb-down"],["오래됨","outOfDate","thumb-down"],["번역 문제","translationIssue","thumb-down"],["샘플/코드 문제","samplesCodeIssue","thumb-down"],["기타","otherDown","thumb-down"]],["최종 업데이트: 2025-07-27(UTC)"],[],[],null,["# Flame chart\n\nThe **Flame Chart** tab provides an inverted call chart that aggregates\nidentical call stacks. That is, identical methods or functions that share the\nsame sequence of callers are collected and represented as one longer bar in a\nflame chart (rather than displaying them as multiple shorter bars, as shown in a\ncall chart). This makes it easier to see which methods or functions consume the\nmost time. However, this also means that the horizontal axis doesn't represent a\ntimeline; instead, it indicates the relative amount of time each method or\nfunction takes to execute.\n\nTo help illustrate this concept, consider the call chart in Figure 1. Note\nthat method D makes multiple calls to B (B~1~, B~2~, and\nB~3~), and some of those calls to B make a call to C (C~1~ and\nC~3~).\n\n\n**Figure 1.** A call chart with multiple method calls\nthat share a common sequence of callers.\n\n\u003cbr /\u003e\n\nBecause B~1~, B~2~, and B~3~ share the same sequence\nof callers (A → D → B) they are aggregated, as shown in Figure 2. Similarly,\nC~1~ and C~3~ are aggregated because they share the same\nsequence of callers (A → D → B → C); note that C~2~ is not included\nbecause it has a different sequence of callers (A → D → C).\n\n\n**Figure 2.** Aggregating identical methods that share\nthe same call stack.\n\n\u003cbr /\u003e\n\nThe aggregated calls are used to create the flame chart, as shown in Figure 3.\nNote that, for any given call in a flame chart, the callees that consume the\nmost CPU time appear first.\n\n\n**Figure 3.** A flame chart representation of the call\nchart shown in figure 5.\n\n\u003cbr /\u003e"]]