フレーム チャート
コレクションでコンテンツを整理
必要に応じて、コンテンツの保存と分類を行います。
[Flame Chart] タブには、同一のコールスタックが集約される反転された呼び出しチャートが表示されます。つまり、同じシーケンスの呼び出し元を共有する同一のメソッドまたは関数が集められ、(呼び出しチャートのようにメソッドまたは関数を複数の短いバーで表示せずに)フレーム チャートに 1 つの長いバーとして表されます。これにより、最も時間を消費しているメソッドまたは関数がわかりやすくなります。ただし、この場合横軸はタイムラインを表さず、その代わりに各メソッドの実行にかかった相対的な時間が示されます。
このコンセプトについて、図 1 に示す呼び出しチャートを例に説明します。メソッド D が B に対して複数の呼び出し(B1、B2、B3)を行い、B に対するこれらの呼び出しの一部が C に対して呼び出し(C1 と C3)を行っていることに注意してください。
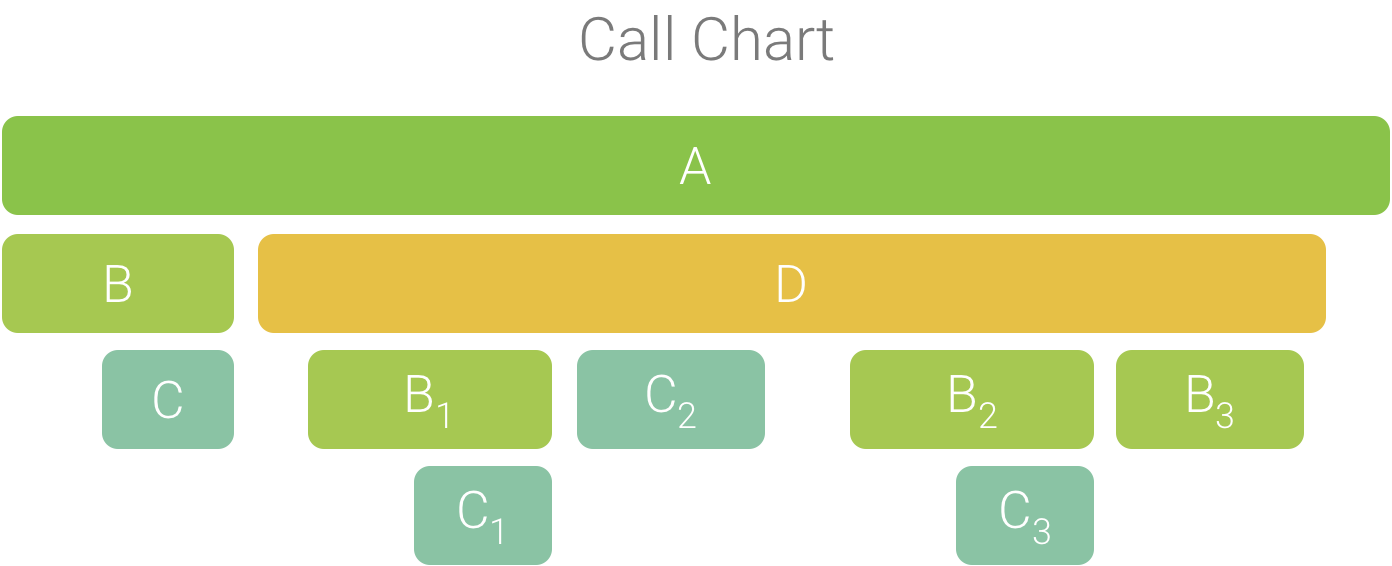
図 1. 共通のシーケンスの呼び出し元を共有している複数のメソッド呼び出しが含まれた呼び出しチャート。
B1、B2、B3 は、同じシーケンスの呼び出し元(A → D → B)を共有しているため、図 2 のように集約されます。同様に、同じシーケンスの呼び出し元(A → D → B → C)を共有している C1 と C3 も集約されます。C2 の呼び出し元のシーケンスは異なるため(A → D → C)、集約に含まれないことに注意してください。
図 2. 同じコールスタックを共有している同一のメソッドの集約。
集約された呼び出しは、図 3 に示すようにフレーム チャートの作成に使用されます。フレーム チャート内の特定の呼び出しについて、最も CPU 時間を消費する呼び出し先が最初に表示されることに注意してください。
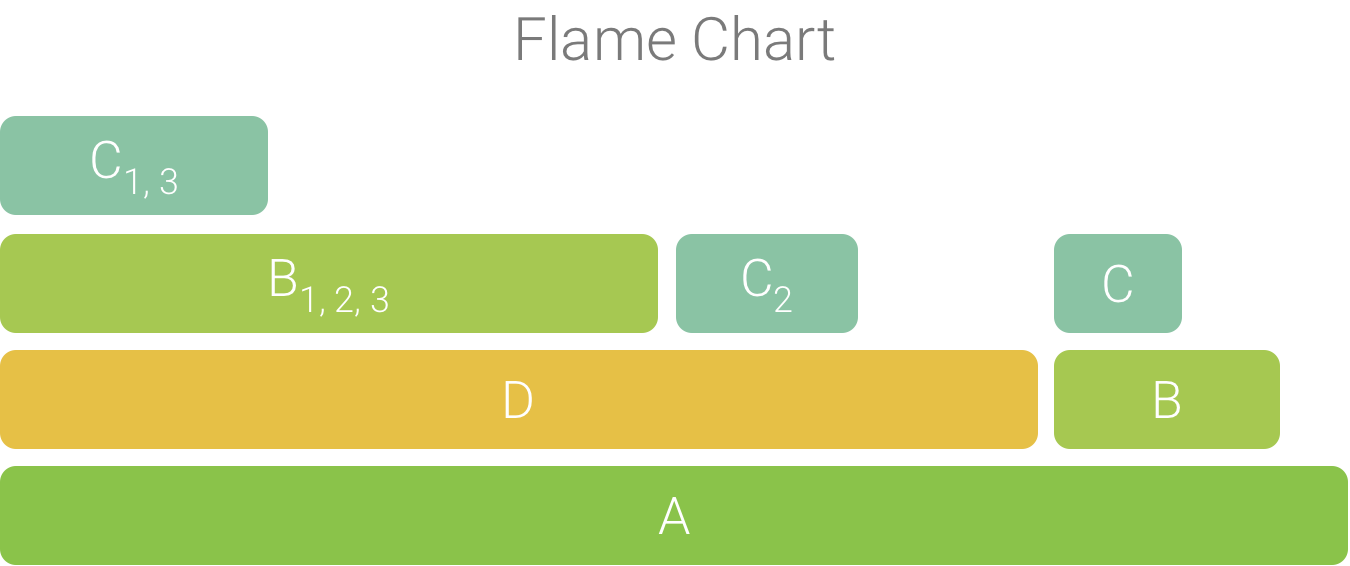
図 3. 図 5 の呼び出しチャートをフレーム チャートで表した図。
このページのコンテンツやコードサンプルは、コンテンツ ライセンスに記載のライセンスに従います。Java および OpenJDK は Oracle および関連会社の商標または登録商標です。
最終更新日 2025-07-27 UTC。
[[["わかりやすい","easyToUnderstand","thumb-up"],["問題の解決に役立った","solvedMyProblem","thumb-up"],["その他","otherUp","thumb-up"]],[["必要な情報がない","missingTheInformationINeed","thumb-down"],["複雑すぎる / 手順が多すぎる","tooComplicatedTooManySteps","thumb-down"],["最新ではない","outOfDate","thumb-down"],["翻訳に関する問題","translationIssue","thumb-down"],["サンプル / コードに問題がある","samplesCodeIssue","thumb-down"],["その他","otherDown","thumb-down"]],["最終更新日 2025-07-27 UTC。"],[],[],null,["# Flame chart\n\nThe **Flame Chart** tab provides an inverted call chart that aggregates\nidentical call stacks. That is, identical methods or functions that share the\nsame sequence of callers are collected and represented as one longer bar in a\nflame chart (rather than displaying them as multiple shorter bars, as shown in a\ncall chart). This makes it easier to see which methods or functions consume the\nmost time. However, this also means that the horizontal axis doesn't represent a\ntimeline; instead, it indicates the relative amount of time each method or\nfunction takes to execute.\n\nTo help illustrate this concept, consider the call chart in Figure 1. Note\nthat method D makes multiple calls to B (B~1~, B~2~, and\nB~3~), and some of those calls to B make a call to C (C~1~ and\nC~3~).\n\n\n**Figure 1.** A call chart with multiple method calls\nthat share a common sequence of callers.\n\n\u003cbr /\u003e\n\nBecause B~1~, B~2~, and B~3~ share the same sequence\nof callers (A → D → B) they are aggregated, as shown in Figure 2. Similarly,\nC~1~ and C~3~ are aggregated because they share the same\nsequence of callers (A → D → B → C); note that C~2~ is not included\nbecause it has a different sequence of callers (A → D → C).\n\n\n**Figure 2.** Aggregating identical methods that share\nthe same call stack.\n\n\u003cbr /\u003e\n\nThe aggregated calls are used to create the flame chart, as shown in Figure 3.\nNote that, for any given call in a flame chart, the callees that consume the\nmost CPU time appear first.\n\n\n**Figure 3.** A flame chart representation of the call\nchart shown in figure 5.\n\n\u003cbr /\u003e"]]