תרשים להבה
קל לארגן דפים בעזרת אוספים
אפשר לשמור ולסווג תוכן על סמך ההעדפות שלך.
בכרטיסייה Flame Chart מוצג תרשים הפוך של קריאות, שמצטברות
במחסניות זהות של קריאות. כלומר, שיטות או פונקציות זהות שמשתפות את אותו רצף של קוראים נאספות ומיוצגות כעמודה ארוכה אחת בתרשים להבה (במקום להציג אותן כעמודות קצרות יותר, כמו בתרשים שיחות). כך קל יותר לראות אילו שיטות או פונקציות צורכות את רוב הזמן. עם זאת, המשמעות היא גם שהציר האופקי לא מייצג ציר זמן, אלא מציין את כמות הזמן היחסית שכל שיטה או פונקציה צורכות כדי לפעול.
כדי להמחיש את הרעיון הזה, אפשר לעיין בתרשים השיחות באיור 1. שימו לב שה-method D שולח כמה קריאות ל-method B (B1, B2 ו-B3), וחלק מהקריאות האלה ל-method B שולחות קריאה ל-method C (C1 ו-C3).
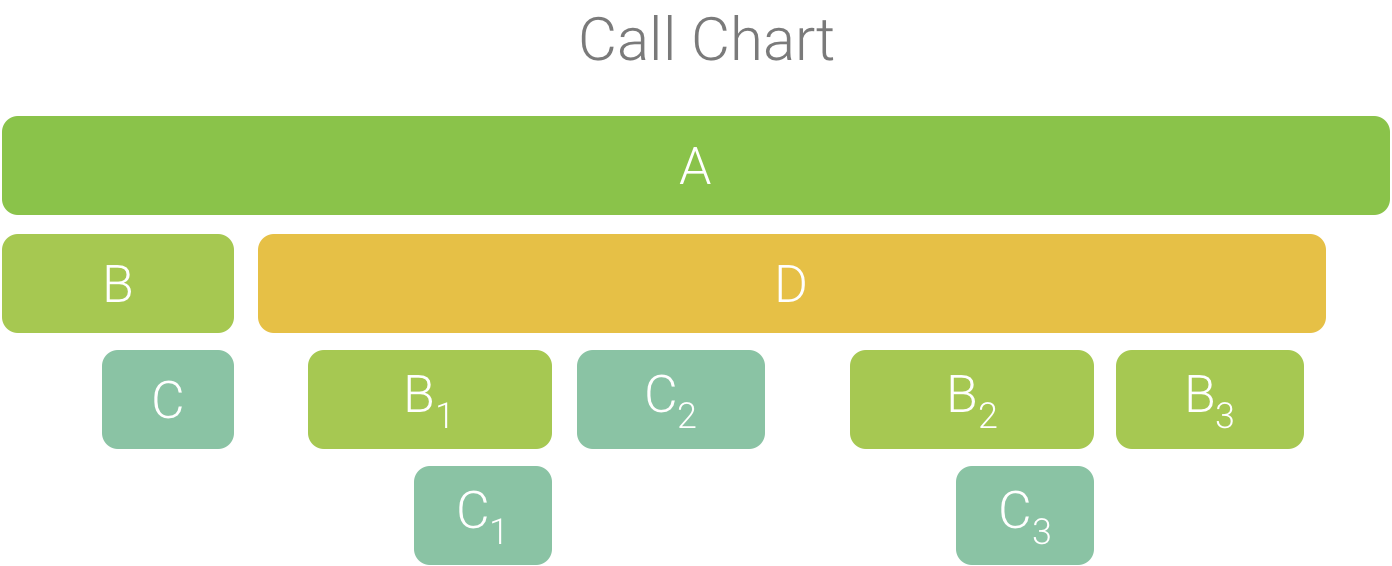
איור 1. תרשים של שיחות עם כמה קריאות לשיטות שמשותפות ברצף משותף של מתקשרים.
מכיוון שהקריאות B1, B2 ו-B3 חולקות את אותו רצף של קריאות (A → D → B), הן מצטברות, כפי שמוצג באיור 2. באופן דומה, C1 ו-C3 מצטברים כי יש להם את אותו רצף של מתקשרים (A → D → B → C). שימו לב ש-C2 לא נכלל כי יש לו רצף שונה של מתקשרים (A → D → C).
איור 2. צבירה של שיטות זהות שחולקות את אותו מחסנית קריאות.
השיחות המצטברות משמשות ליצירת תרשים הלהבות, כמו שמוצג באיור 3.
שימו לב שבכל שיחה בתרשים הלהבה, הנמענים שצורכים את הזמן הכי רב של המעבד מופיעים ראשונים.
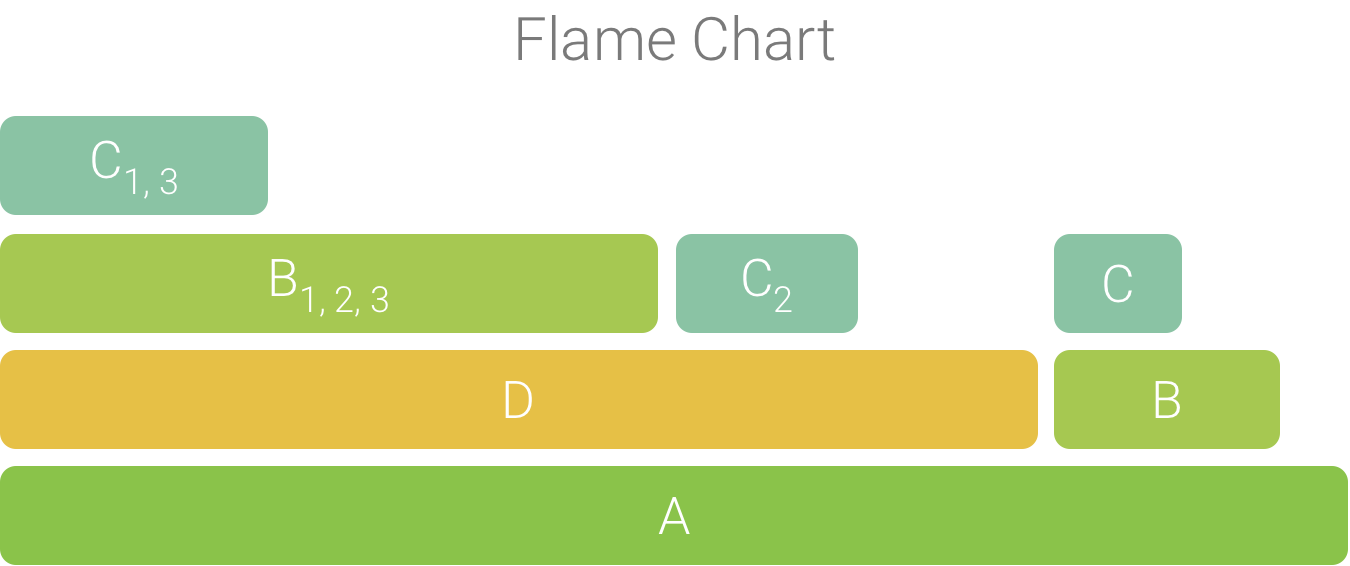
איור 3. תרשים להבה שמייצג את תרשים השיחות שמוצג באיור 5.
דוגמאות התוכן והקוד שבדף הזה כפופות לרישיונות המפורטים בקטע רישיון לתוכן. Java ו-OpenJDK הם סימנים מסחריים או סימנים מסחריים רשומים של חברת Oracle ו/או של השותפים העצמאיים שלה.
עדכון אחרון: 2025-07-27 (שעון UTC).
[[["התוכן קל להבנה","easyToUnderstand","thumb-up"],["התוכן עזר לי לפתור בעיה","solvedMyProblem","thumb-up"],["סיבה אחרת","otherUp","thumb-up"]],[["חסרים לי מידע או פרטים","missingTheInformationINeed","thumb-down"],["התוכן מורכב מדי או עם יותר מדי שלבים","tooComplicatedTooManySteps","thumb-down"],["התוכן לא עדכני","outOfDate","thumb-down"],["בעיה בתרגום","translationIssue","thumb-down"],["בעיה בדוגמאות/בקוד","samplesCodeIssue","thumb-down"],["סיבה אחרת","otherDown","thumb-down"]],["עדכון אחרון: 2025-07-27 (שעון UTC)."],[],[],null,["# Flame chart\n\nThe **Flame Chart** tab provides an inverted call chart that aggregates\nidentical call stacks. That is, identical methods or functions that share the\nsame sequence of callers are collected and represented as one longer bar in a\nflame chart (rather than displaying them as multiple shorter bars, as shown in a\ncall chart). This makes it easier to see which methods or functions consume the\nmost time. However, this also means that the horizontal axis doesn't represent a\ntimeline; instead, it indicates the relative amount of time each method or\nfunction takes to execute.\n\nTo help illustrate this concept, consider the call chart in Figure 1. Note\nthat method D makes multiple calls to B (B~1~, B~2~, and\nB~3~), and some of those calls to B make a call to C (C~1~ and\nC~3~).\n\n\n**Figure 1.** A call chart with multiple method calls\nthat share a common sequence of callers.\n\n\u003cbr /\u003e\n\nBecause B~1~, B~2~, and B~3~ share the same sequence\nof callers (A → D → B) they are aggregated, as shown in Figure 2. Similarly,\nC~1~ and C~3~ are aggregated because they share the same\nsequence of callers (A → D → B → C); note that C~2~ is not included\nbecause it has a different sequence of callers (A → D → C).\n\n\n**Figure 2.** Aggregating identical methods that share\nthe same call stack.\n\n\u003cbr /\u003e\n\nThe aggregated calls are used to create the flame chart, as shown in Figure 3.\nNote that, for any given call in a flame chart, the callees that consume the\nmost CPU time appear first.\n\n\n**Figure 3.** A flame chart representation of the call\nchart shown in figure 5.\n\n\u003cbr /\u003e"]]