
يمكنك الاطّلاع على بيانات أعطال التطبيقات واتّخاذ إجراءات بشأنها من Firebase Crashlytics و Android Vitals مباشرةً في Android Studio. تستردّ عملية الدمج هذه بيانات تتبُّع تسلسل استدعاء الدوال الإجرائية وإحصاءات الأعطال من Crashlytics وGoogle Play إلى نافذة أداة إحصاءات جودة التطبيق في بيئة التطوير المتكاملة (IDE) في "استوديو Android"، ما يغنيك عن التنقّل بين المتصفّح وبيئة التطوير المتكاملة. يمكن لفِرق التطوير الاستفادة من الإمكانات الرئيسية، بما في ذلك ما يلي:
- يمكنك الاطّلاع على أسطر في الرمز الخاص بك تم تمييزها عندما تتضمّن بيانات أحداث ذات صلة في Crashlytics.
- اطّلِع على تتبُّع تسلسل استدعاء الدوال البرمجية لأهم الأعطال، وانقر على تتبُّع تسلسل استدعاء الدوال البرمجية للانتقال إلى الأسطر ذات الصلة في الرمز البرمجي.
- اطّلِع على إحصاءات ملخّصة حول أهم أحداث الأعطال والأحداث غير الفادحة، مثل المجمّعة حسب الشركة المصنّعة للجهاز وإصدار Android.
- فلترة الأحداث حسب السمات، بما في ذلك الخطورة والوقت وإصدار التطبيق
- الحصول على رابط متصفّح يفتح صفحة لوحة بيانات Crashlytics التي تتضمّن المزيد من التفاصيل حول الحدث
- الحصول على إحصاءات تساعدك في فهم الأسباب الجذرية لبعض المشاكل وحلّها بسهولة أكبر
تتوفّر تقارير "مؤشرات Android الحيوية" لجميع التطبيقات المنشورة على Google Play. إذا لم تكن تستخدم Crashlytics بعد وتريد معرفة المزيد عن الميزات التي توفّرها، يمكنك الاطّلاع على Firebase Crashlytics.
البدء
للاطّلاع على بيانات Crashlytics في Android Studio، عليك إعداد Firebase وCrashlytics في مشروع تطبيقك. إليك الطريقة: افتح "مساعد Firebase" في استوديو Android من خلال الانتقال إلى الأدوات > Firebase، ثم انقر على Crashlytics، واتّبِع الفيديو التعليمي لإضافة Firebase وCrashlytics إلى مشروعك. يمكنك الاطّلاع على مزيد من المعلومات حول سير عمل "مساعد Firebase" في دليل بدء استخدام Firebase على Android.
إذا سبق لك إضافة Firebase وCrashlytics إلى تطبيقك، سجِّل الدخول إلى حسابك كمطوِّر في بيئة التطوير المتكاملة (IDE) من خلال النقر على رمز الأفاتار
![]() .
بعد تسجيل الدخول، انقر على نافذة أداة إحصاءات جودة التطبيق
.
بعد تسجيل الدخول، انقر على نافذة أداة إحصاءات جودة التطبيق
![]() . من المفترض أن تظهر اللوحات مملوءة بالتقارير من Crashlytics.
. من المفترض أن تظهر اللوحات مملوءة بالتقارير من Crashlytics.
تحليل "مؤشرات Android الحيوية"
تتضمّن أداة "تحليل جودة التطبيق" بيانات مؤشرات Android الحيوية. يتيح لك ذلك الوصول بسهولة أكبر إلى المقاييس الأساسية التي يجمعها Google Play وتحسين تجربة المستخدم. استخدِم "مؤشرات Android الحيوية" لمعالجة المشاكل المتعلّقة بثبات التطبيق للمساعدة في تحسين جودة تطبيقك على Google Play.
يمكنك عرض مشاكل "مؤشرات Android الحيوية" وفلترتها والانتقال من تتبُّع تسلسل استدعاء الدوال البرمجية إلى الرمز البرمجي مباشرةً من نافذة أداة إحصاءات جودة التطبيق. للبدء، اتّبِع الخطوات التالية:
- سجِّل الدخول إلى حساب المطوِّر في "استوديو Android" باستخدام رمز الملف الشخصي
 في نهاية شريط الأدوات.
 - افتح إحصاءات جودة التطبيق من خلال النقر على نافذة الأدوات في "استوديو Android" أو النقر على عرض > نوافذ الأدوات > إحصاءات جودة التطبيق.
- انقر على علامة التبويب مؤشرات Android الحيوية ضِمن إحصاءات جودة التطبيق.
اختياري: لاستخدام ميزة الدمج مع نظام التحكّم في الإصدارات لإنشاء إصدار قابل للتصحيح، أضِف أحدث إصدار من حزمة تطوير البرامج (SDK) في Firebase Crashlytics (أو قائمة مواد Firebase Android) إلى تطبيقك، ثم أضِف الرمز التالي إلى ملف
build.gradle.ktsأوbuild.gradleعلى مستوى الوحدة. يتم تفعيل العلامة تلقائيًا في إصدارات Release (غير قابلة للتصحيح).
Kotlin
android {
  buildTypes {
    getByName("debug") {
      vcsInfo {
        include = true
      }
    }
  }
}
أنيق
android {
  buildTypes {
    debug {
      vcsInfo {
        include true
      }
    }
  }
}
تحليل بيانات Crashlytics في "استوديو Android"
تحتوي نافذة أداة إحصاءات جودة التطبيق على بيانات مفصّلة تمنحك إحصاءات حول الأحداث التي يواجهها المستخدمون، كما تتضمّن روابط تساعدك في الانتقال بسرعة إلى مصادر هذه الأحداث.
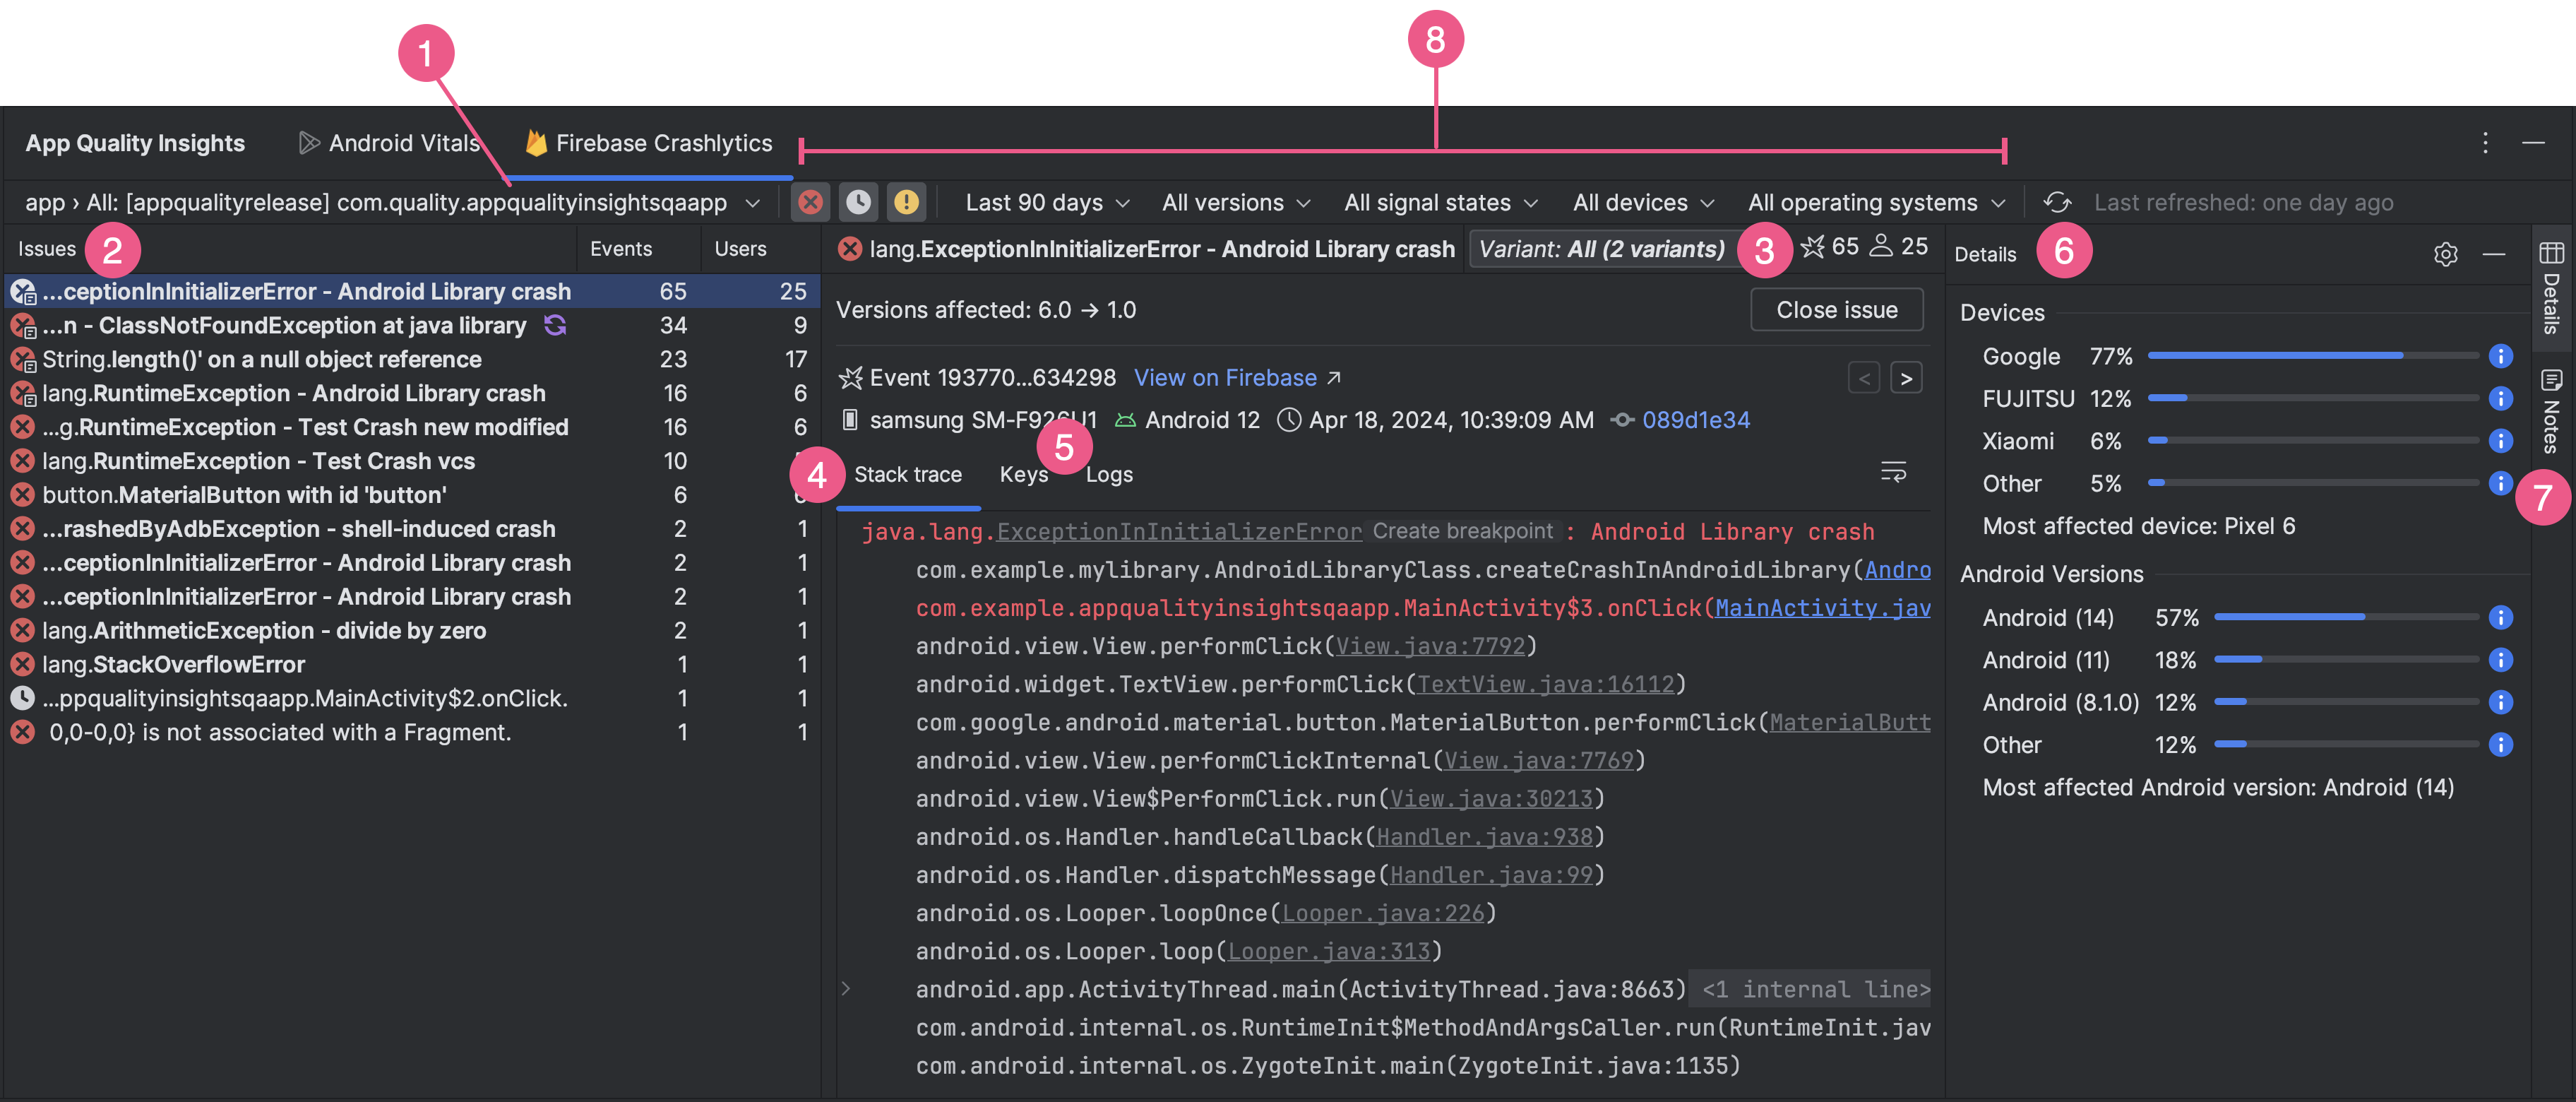
- استخدِم القائمة المنسدلة الخاصة بمعرّف التطبيق لاختيار معرّف التطبيق الذي تريد تحليله. على سبيل المثال، أثناء عملك على إصدار تصحيح الأخطاء من تطبيقك في بيئة التطوير المتكاملة، قد تحتاج إلى الاطّلاع على بيانات الأحداث الخاصة بإصدار تطبيقك المتاح للمستخدمين.
- تعرض لوحة المشاكل أهم الأحداث التي تتوفّر بياناتها في Crashlytics، ويتم ترتيبها حسب الأعطال الأكثر تأثيرًا.
- عرض الأحداث حسب الأنواع أو مجموعات الأحداث التي تتضمّن عمليات تتبُّع تسلسل استدعاء الدوال البرمجية متشابهة يساعدك تحليل الأحداث حسب صيغة الإصدار في تحديد الأسباب الجذرية لتعطُّل التطبيق.
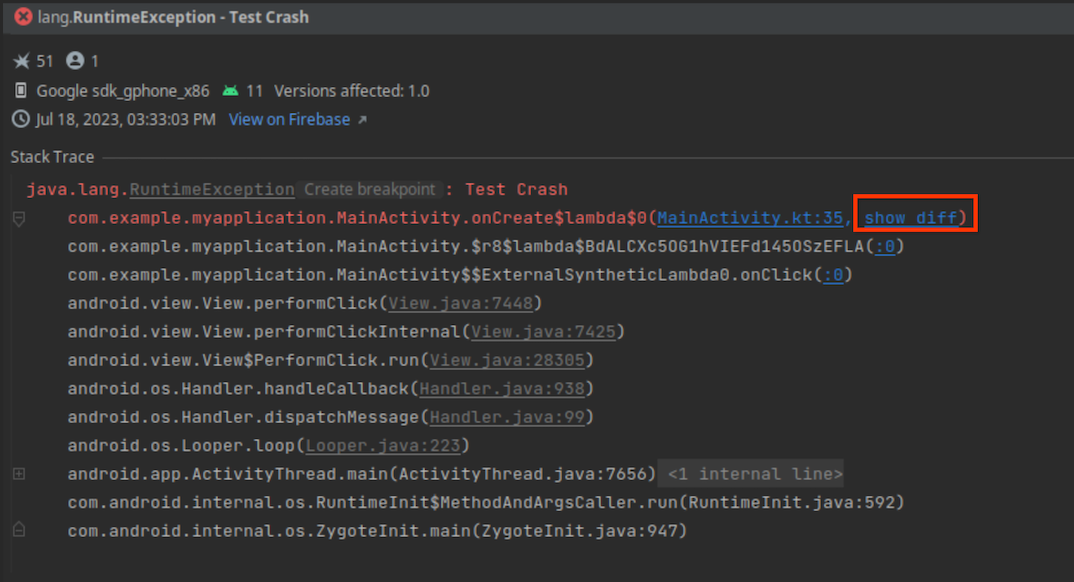
تعرض علامة التبويب تتبُّع تسلسل استدعاء الدوال البرمجية تفاصيل حول آخر مرة حدث فيها الخطأ الذي نقرت عليه في لوحة المشاكل. يمكنك الاطّلاع على تتبُّع تسلسل استدعاء الدوال البرمجية للحدث والنقر على تتبُّع تسلسل استدعاء الدوال البرمجية للانتقال إلى الأسطر ذات الصلة في قاعدة الرموز البرمجية. إذا تغيّر الرمز منذ حدوث العطل، انقر على عرض الاختلاف بجانب الخطأ في قائمة تتبُّع تسلسل استدعاء الدوال البرمجية لعرض الفرق بين الرمز الحالي وإصدار قاعدة الرموز الذي تسبّب في حدوث العطل.
تتوفّر أيضًا معلومات حول نوع الجهاز المتأثّر وإصدار Android ووقت وقوع الحدث، بالإضافة إلى رابط يؤدي إلى الحدث في لوحة بيانات Firebase Crashlytics. لتصفّح معلومات عن أحداث متعدّدة في مجموعة، استخدِم السهمَين المتّجهَين لليمين ولليسار. انقر على إغلاق المشكلة لإغلاق مشكلة مباشرةً من اللوحة.
- تعرض علامتا التبويب المفاتيح والسجلات أزواج المفاتيح والقيم المخصّصة والسجلات لكل تقرير من تقارير Crashlytics.
- تعرض لوحة التفاصيل عدد الأعطال حسب نوع الجهاز وإصدار Android، ما يتيح لك تحديد مجموعات المستخدمين الأكثر تأثُّرًا. وتوضّح أيضًا إصدارات التطبيق التي حدث فيها العطل وعدد المستخدمين المتأثرين به.
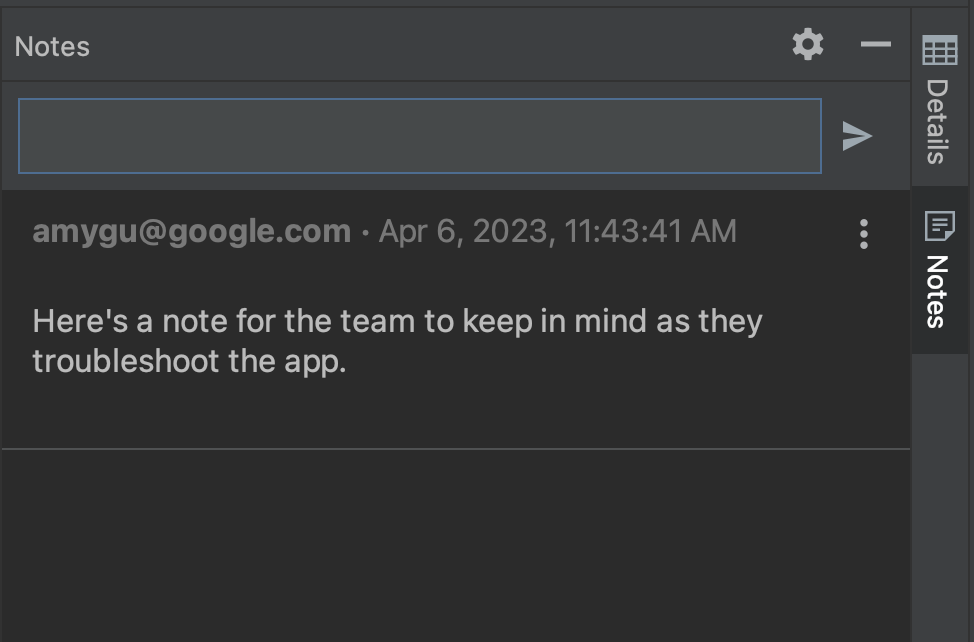
- قراءة الملاحظات وإرفاقها بالمشاكل لتظهر في وحدة تحكّم Firebase ولزملائك في الفريق لكتابة ملاحظة حول مشكلة، اختَر المشكلة وافتح لوحة الملاحظات. يجب أن يكون لديك إذن بالكتابة في مشروع Crashlytics لتتمكّن من كتابة الملاحظات. تظهر المشاكل المتعلقة بالملاحظات مع رمز "الملاحظات"
 في لوحة المشاكل.
- استخدِم مجموعة متنوعة من الفلاتر للتركيز على مجموعات فرعية معيّنة من الأحداث. يمكنك اختيار الأحداث التي تكون
 Fatal وNon-Fatal وأخطاء ANR
 أو إلغاء اختيارها، بالإضافة إلى الفلترة حسب الوقت وإصدار التطبيق وإشارة Crashlytics ونوع الجهاز وطرازه وإصدار نظام التشغيل Android.
 يُرجى العِلم أنّه بالنسبة إلى حالات إشارة Crashlytics، تُعدّ المشكلة متكرّرة إذا تم إغلاقها في السابق وحدثت مرة أخرى في إصدار جديد من التطبيق.
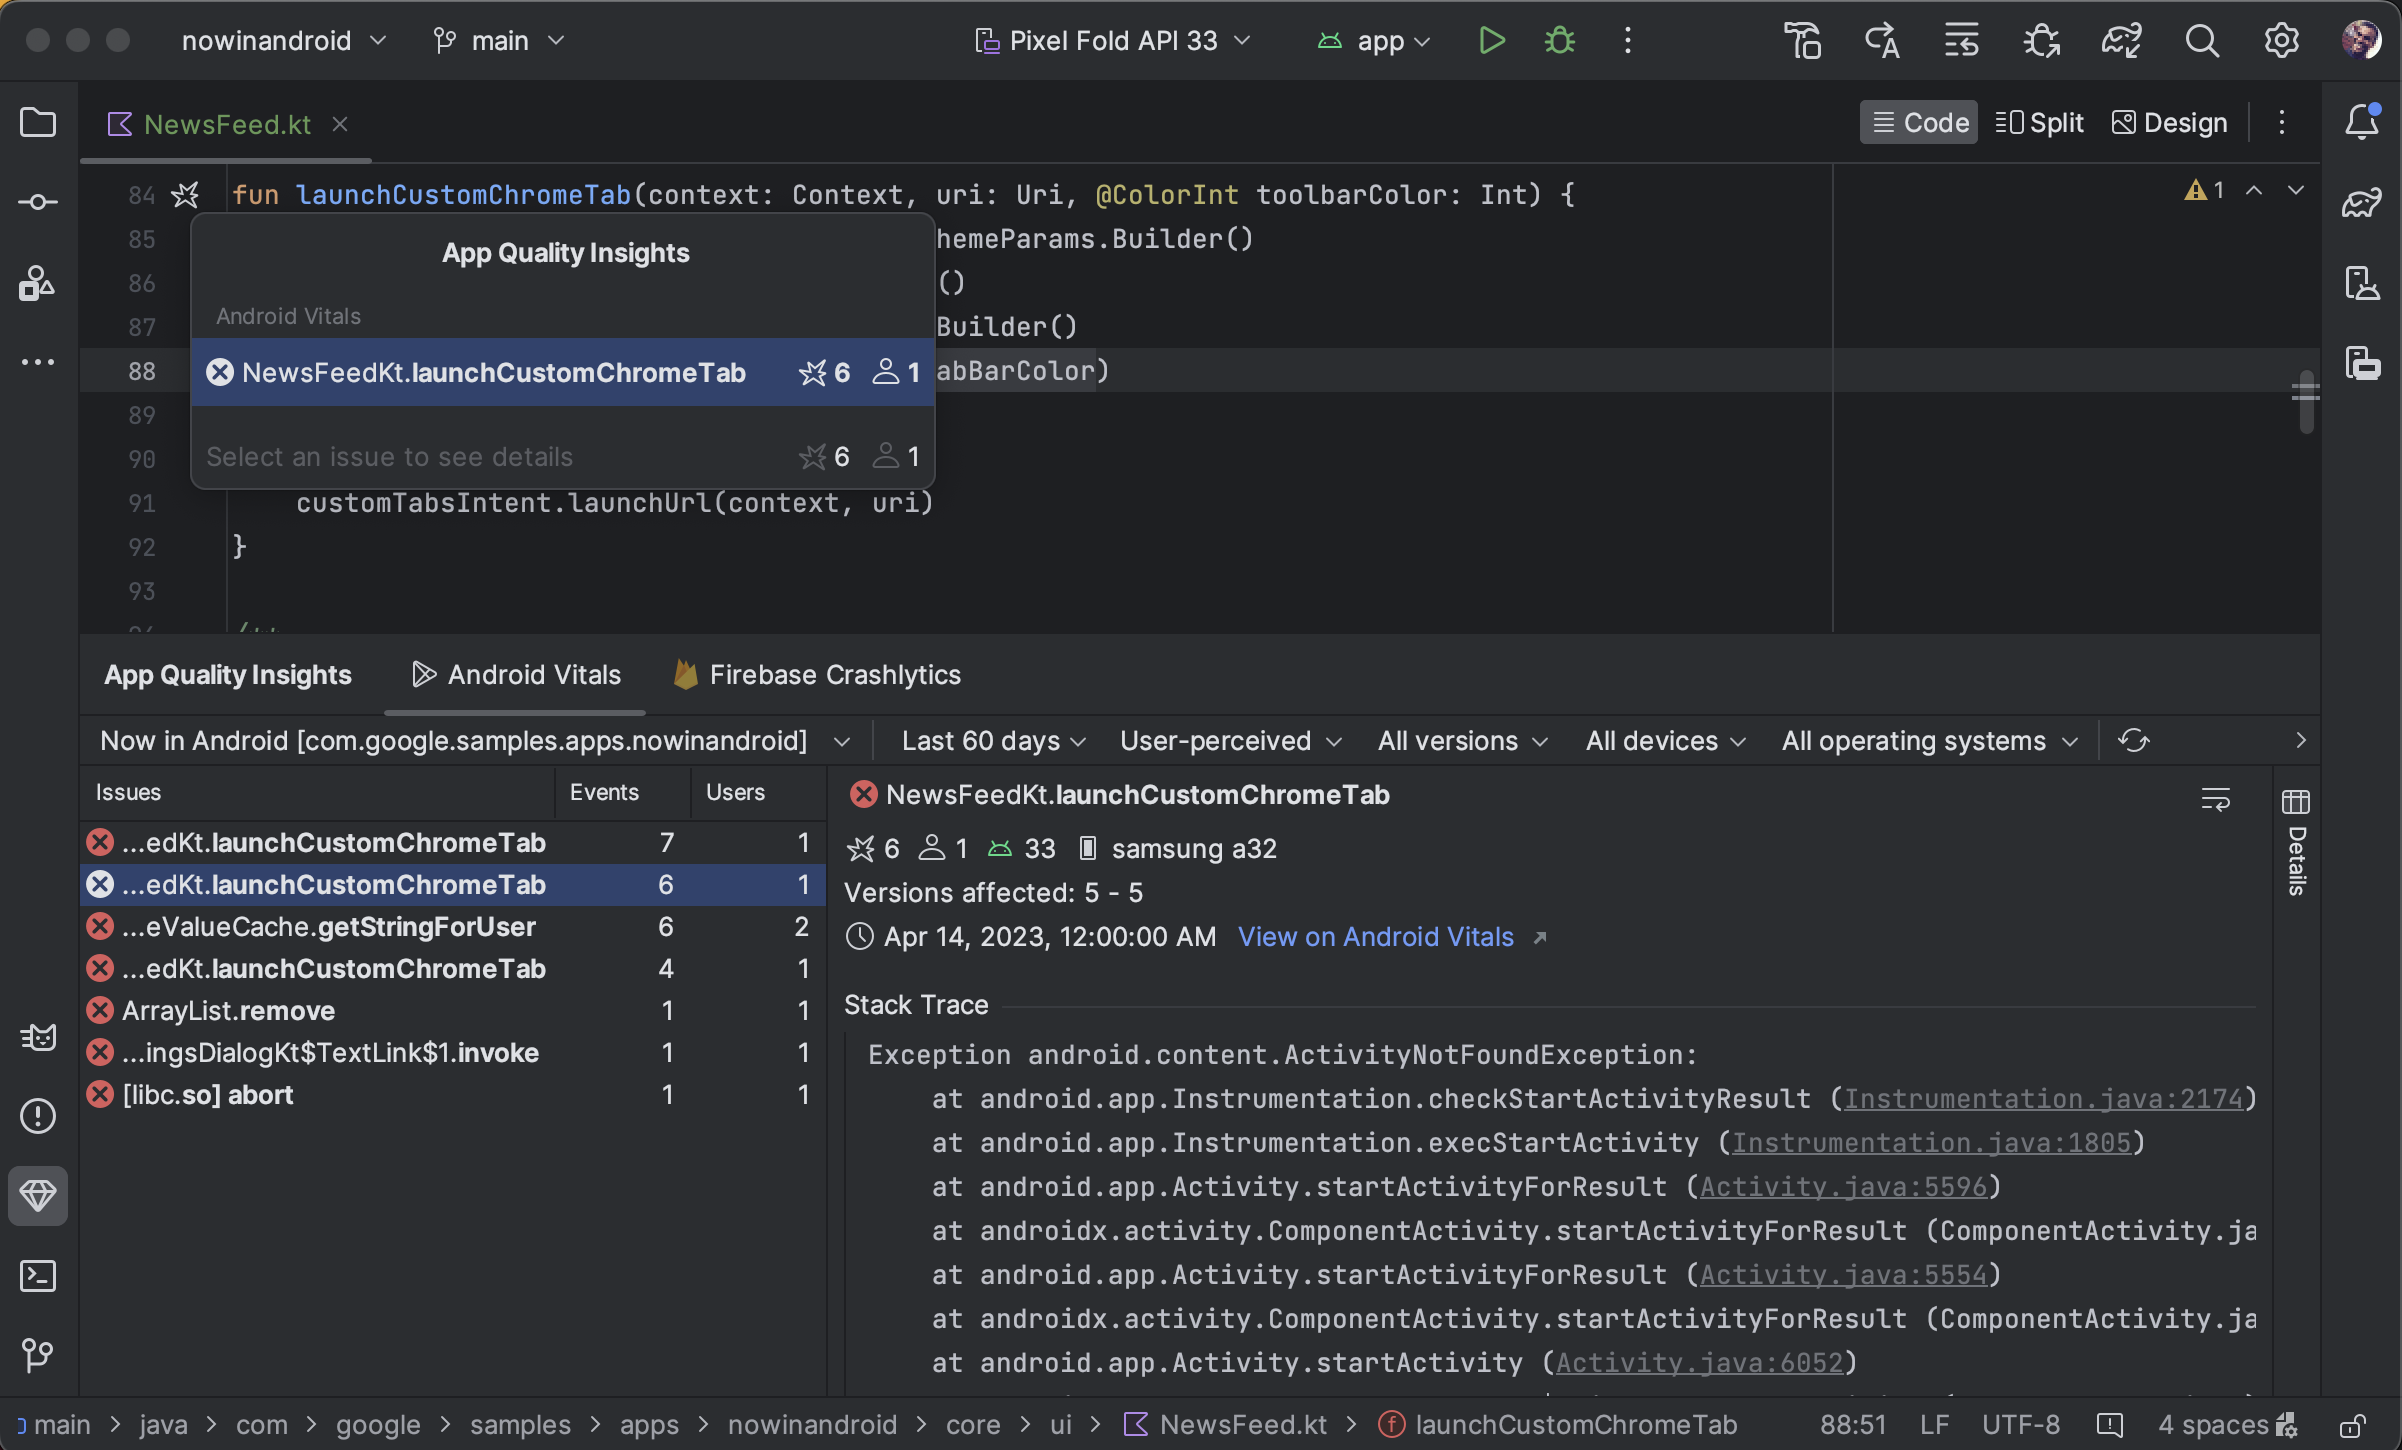
بالإضافة إلى إمكانية الانتقال من تتبُّع تسلسل استدعاء الدوال البرمجية إلى الرمز البرمجي، يمكنك أيضًا الانتقال من الرمز البرمجي إلى تتبُّع تسلسل استدعاء الدوال البرمجية: يضيف Android Studio الآن تعليقات توضيحية إلى أسطر الرمز البرمجي المرتبطة بالأعطال باستخدام رمز شريط الأعطال ![]() حتى تتمكّن من رصدها وتصحيح أخطائها بسهولة.
حتى تتمكّن من رصدها وتصحيح أخطائها بسهولة.
عندما تحرّك مؤشر الماوس فوق رمز التعطُّل، تظهر نافذة منبثقة تعرض عدد الأحداث التي تتضمّن سطر الرمز هذا، بالإضافة إلى معدّلات تكرار الأحداث.
![]()
انقر على رمز العطل للحصول على قائمة أكثر تفصيلاً بالأحداث، بما في ذلك معدّل تكرار حدث معيّن وعدد المستخدمين المتأثّرين به. انقر على حدث معيّن للانتقال إلى تفاصيل الحدث في نافذة أداة إحصاءات جودة التطبيق.
![]()
اختلاف الأرقام بين "مؤشرات Android الحيوية" وCrashlytics
يُرجى العِلم أنّ كلاً من "مؤشرات Android الحيوية" وCrashlytics قد يعرضان قيمًا مختلفة لعدد المستخدمين والأحداث المرتبطة بالعُطل نفسه. تحدث هذه الاختلافات لأنّ Play وCrashlytics يمكنهما رصد الأعطال في أوقات مختلفة ولدى مستخدمين مختلفين. في ما يلي بعض الأسباب التي قد تؤدي إلى اختلاف عدد عمليات التثبيت في Play عن عدد الأعطال في Crashlytics:
- ترصد ميزة "تشغيل" الأعطال بدءًا من وقت التشغيل، بينما ترصد Crashlytics الأعطال التي تحدث بعد إعداد حزمة تطوير البرامج (SDK) الخاصة بخدمة Crashlytics.
- إذا أوقف المستخدم ميزة إعداد تقارير الأعطال عند حصوله على هاتف جديد، لن يتم إرسال هذه الأعطال إلى Play، ولكن ترصد Crashlytics الأعطال استنادًا إلى سياسة الخصوصية الخاصة بالتطبيق.
التحقيق باستخدام وظائف محدودة بلا اتصال بالإنترنت
إذا قدّمت طلبًا جديدًا، مثلاً من خلال النقر على إعادة تحميل، وتعذّر على "استوديو Android" التواصل مع Crashlytics، ستتيح لك نافذة إحصاءات جودة التطبيق إدخال الوضع غير المتصل بالإنترنت.
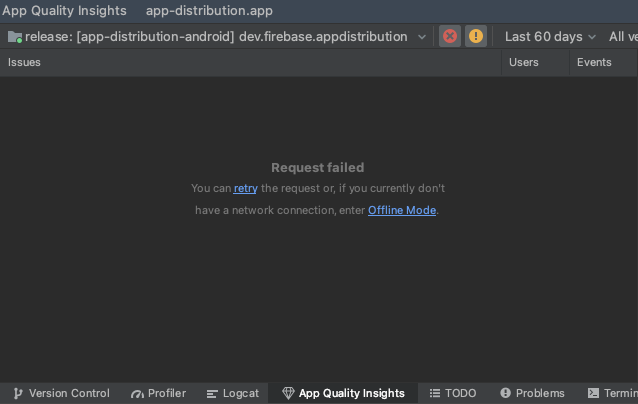
في هذا الوضع، يمكنك مواصلة التحقيق في المشاكل وأحدث الأحداث
من البيانات المخزّنة مؤقتًا. لا تتوفّر بعض الوظائف، مثل تغيير بعض خيارات الفلتر أو إغلاق المشاكل. لإعادة محاولة الاتصال بخدمة Crashlytics
والعودة إلى حالة الاتصال بالإنترنت، انقر على إعادة الربط
![]() .
.
الأذونات
يُرجى الاطّلاع على أذونات الخدمة.