
您可以直接在 Android Studio 中查看 Firebase Crashlytics 和 Android Vitals 的應用程式當機資料,並採取相應行動。有了這項整合功能,系統會從 Crashlytics 和 Google Play 提取堆疊追蹤資料和當機統計資料,並顯示在 Studio IDE 中的「App Quality Insights」工具視窗中,您就不必在瀏覽器和 IDE 之間來回切換。開發團隊也可受益於下列重要功能:
- 程式碼行若有 Crashlytics 事件資料,系統會醒目顯示。
- 提供重大當機事件的堆疊追蹤,使用者只要予以點選便能直接跳到相關的程式碼行。
- 顯示重大當機事件和不嚴重事件的摘要統計資料,例如依照裝置製造商和 Android 版本分組顯示。
- 可依據嚴重程度、時間和應用程式版本等屬性篩選事件。
- 系統會提供 Crashlytics 資訊主頁的瀏覽器連結,可供查看事件詳情。
- 取得洞察資訊,更輕鬆地瞭解及解決特定問題的根本原因。
所有在 Google Play 發布的應用程式,都能查看 Android Vitals 報表。如果您尚未開始使用 Crashlytics,並且想深入瞭解 Crashlytics 提供的功能,請參閱 Firebase Crashlytics。
開始使用
如要在 Android Studio 中查看 Crashlytics 資料,必須在應用程式專案中設定 Firebase 和 Crashlytics。方法如下:依序前往「Tools」>「Firebase」,在 Android Studio 中開啟 Firebase Assistant。接著按一下「Crashlytics」,然後按照教學課程所示在專案中新增 Firebase 和 Crashlytics。如要進一步瞭解 Firebase Assistant 工作流程,請參閱 Android 適用的 Firebase 入門指南。
如果已在應用程式新增 Firebase 和 Crashlytics,請按一下顯示圖片圖示 ![]() ,在 IDE 登入開發人員帳戶。登入後,請點選「App Quality Insights」工具視窗
,在 IDE 登入開發人員帳戶。登入後,請點選「App Quality Insights」工具視窗 ![]() 。您應該會看到面板填入 Crashlytics 的報表。
。您應該會看到面板填入 Crashlytics 的報表。
分析 Android Vitals
App Quality Insights 包含 Android Vitals 資料,這樣您就能更輕鬆存取 Google Play 收集的核心指標,提升使用者體驗。Android Vitals 可用來解決有關應用程式穩定性的問題,協助提升應用程式在 Google Play 的品質。
無論是要查看、篩選 Android Vitals 問題,還是從堆疊追蹤跳至程式碼,全都可透過「App Quality Insights」工具視窗完成。首先,請按照下列步驟操作:
- 使用工具列尾端的個人資料圖示
 ,在 Android Studio 中登入開發人員帳戶。
 - 按一下 Android Studio 中的工具視窗,或依序點選「View」>「Tool Windows」>「App Quality Insights」,即可開啟「App Quality Insights」。
- 按一下「App Quality Insights」中的「Android Vitals」分頁標籤。
選用:如要將版本控管整合至可偵錯的建構版本,請將最新版 Firebase Crashlytics SDK (或 Firebase Android Bill of Materials) 新增至應用程式。接著,在模組層級的
build.gradle.kts或build.gradle檔案中新增下列程式碼。發布 (不可偵錯) 版本預設會啟用這個標記。
Kotlin
android {
  buildTypes {
    getByName("debug") {
      vcsInfo {
        include = true
      }
    }
  }
}
Groovy
android {
  buildTypes {
    debug {
      vcsInfo {
        include true
      }
    }
  }
}
在 Android Studio 中分析 Crashlytics 資料
「App Quality Insights」工具視窗提供豐富的資料,可讓您深入分析使用者遇到的事件,以及可快速前往這些事件來源的連結。
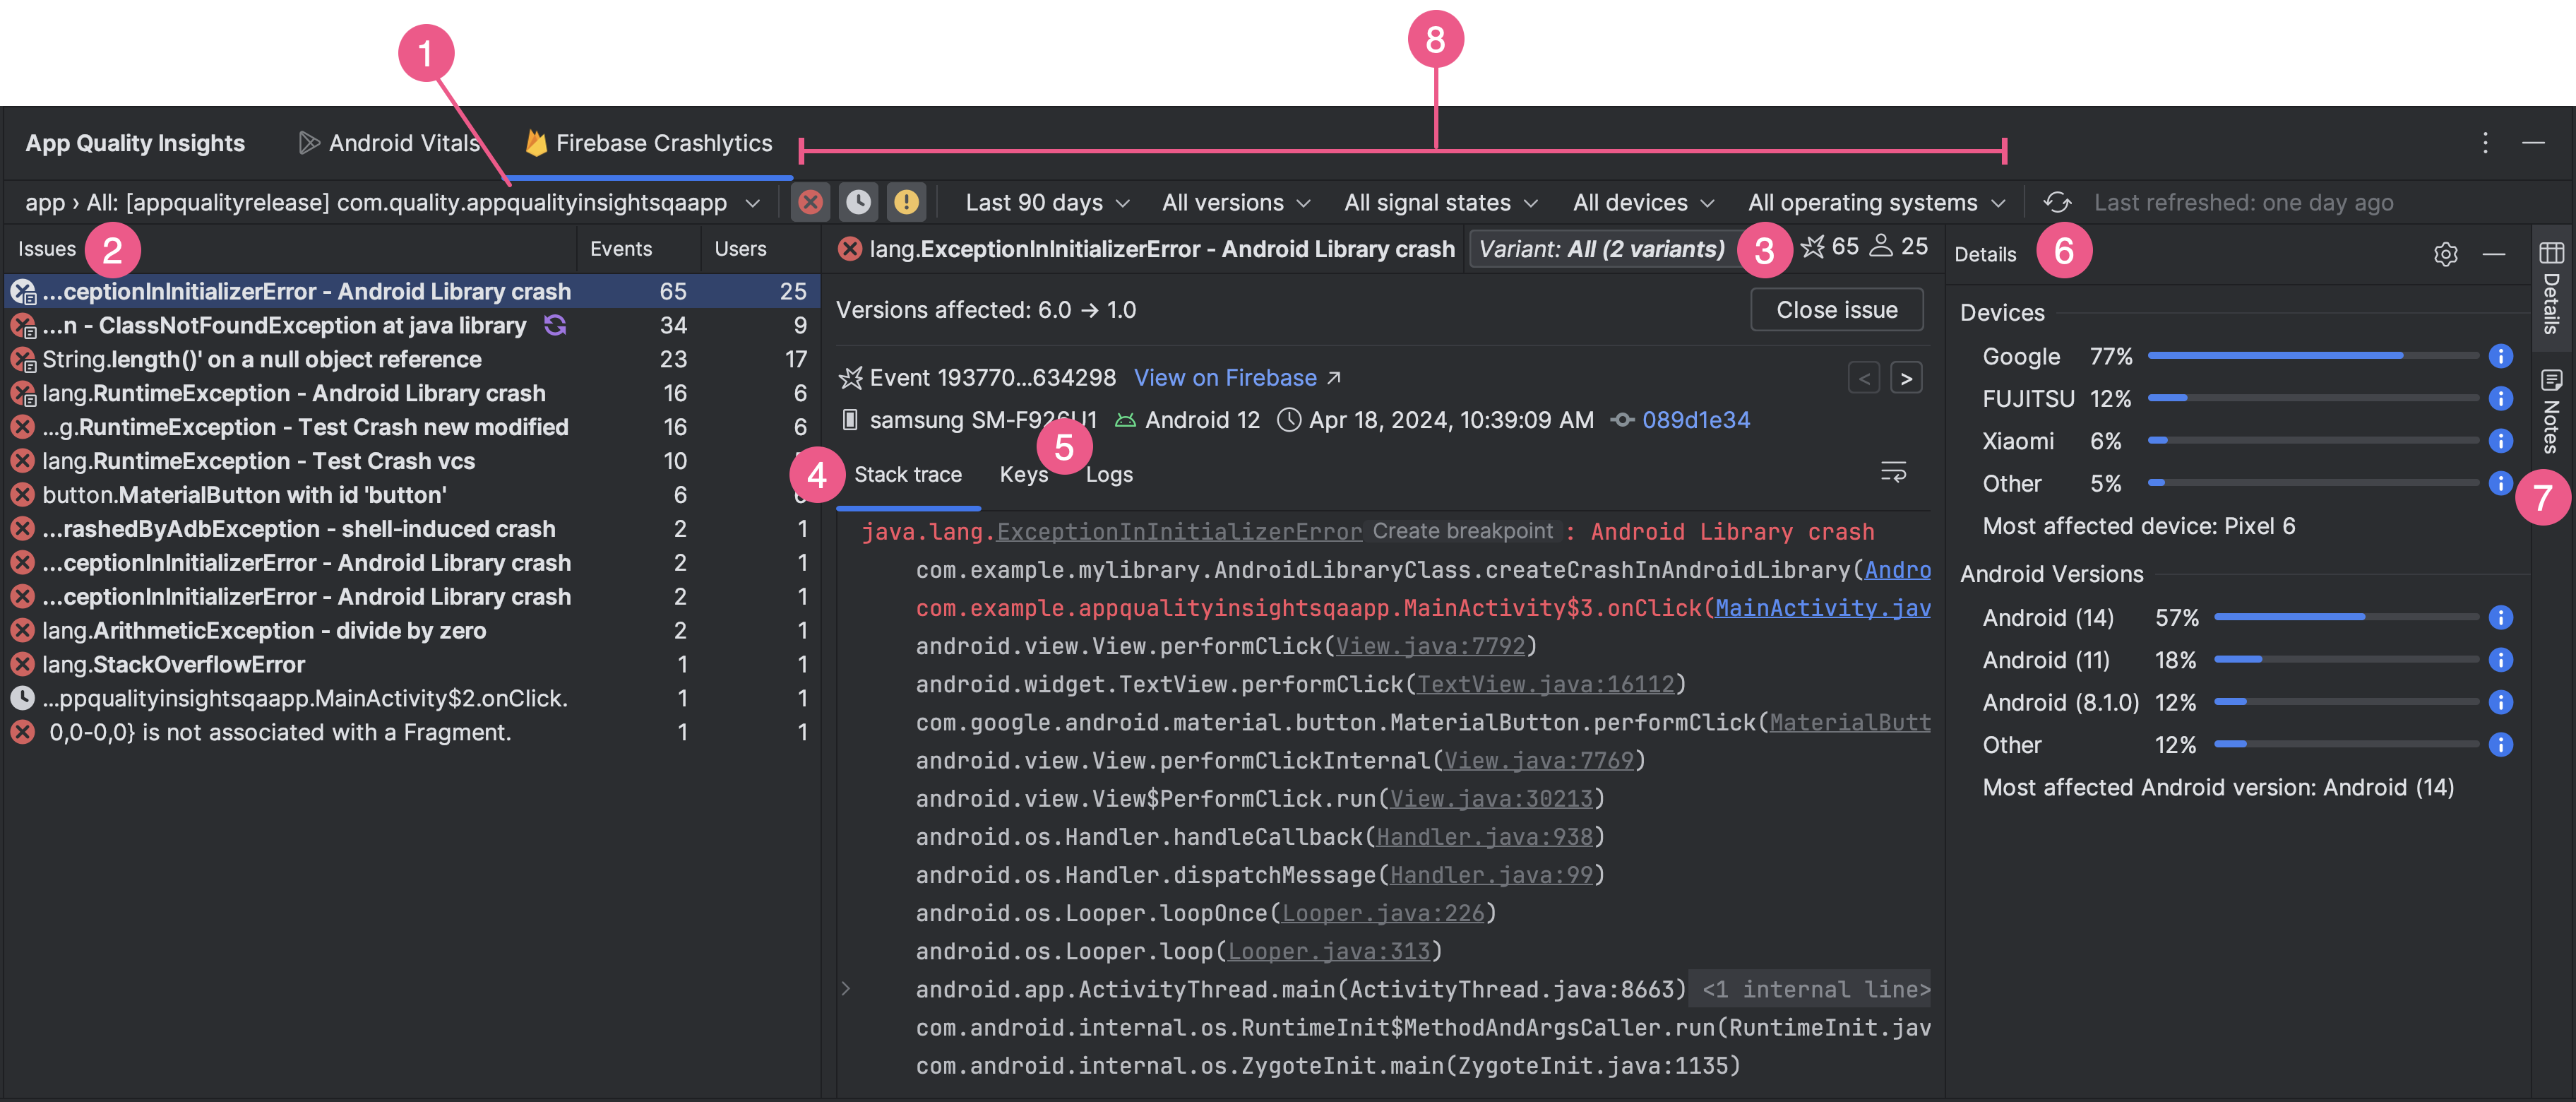
- 使用應用程式 ID 下拉式選單,選取要分析的應用程式 ID。例如,您在 IDE 中處理應用程式的偵錯版本時,可能會想查看使用者安裝的正式版應用程式事件資料。
- 「Issues」面板會顯示 Crashlytics 有哪些重要事件的資料,並依當機影響程度,由大至小排序這些事件。
- 按子類查看事件,或查看堆疊追蹤相似的事件群組。分析變體事件有助於找出當機的根本原因。
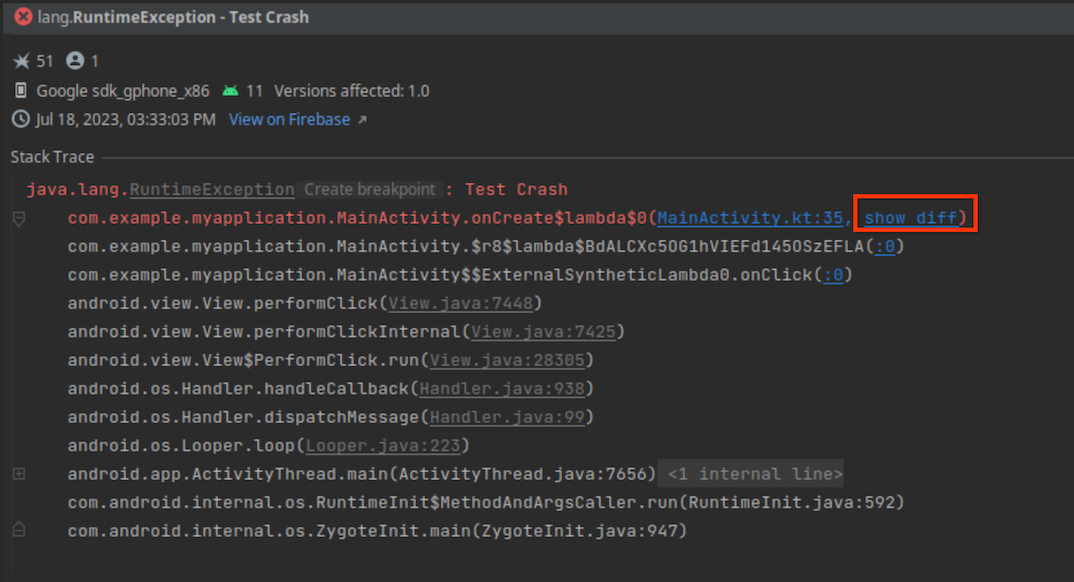
「堆疊追蹤」分頁會根據您在「問題」面板所點選的事件,顯示最近一次發生這項事件的詳情。您可以查看事件的堆疊追蹤,點選堆疊追蹤後即可跳至程式碼集,直接檢視相關程式碼行。如果程式碼在發生當機後有所變更,請按一下堆疊追蹤中錯誤旁的「顯示差異」,查看目前程式碼與導致當機的程式碼集版本之間的差異。
您還可以查看其他資訊,包括受影響的裝置類型、搭載的 Android 版本及事件發生時間等,並透過連結前往 Firebase Crashlytics 資訊主頁查看事件。如要瀏覽群組中多個活動的資訊,請使用向左和向右箭頭。點選「Close issue」,即可直接從面板中關閉問題。
- 「金鑰」和「記錄」分頁會顯示每個 Crashlytics 報表的自訂鍵/值組合和記錄。
- 「Details」面板會依裝置類型和 Android 版本細分當機次數,方便您判斷哪些使用者群組受到最大影響。另外,當中也會顯示哪些應用程式版本曾發生當機情形,以及受影響的使用者人數。
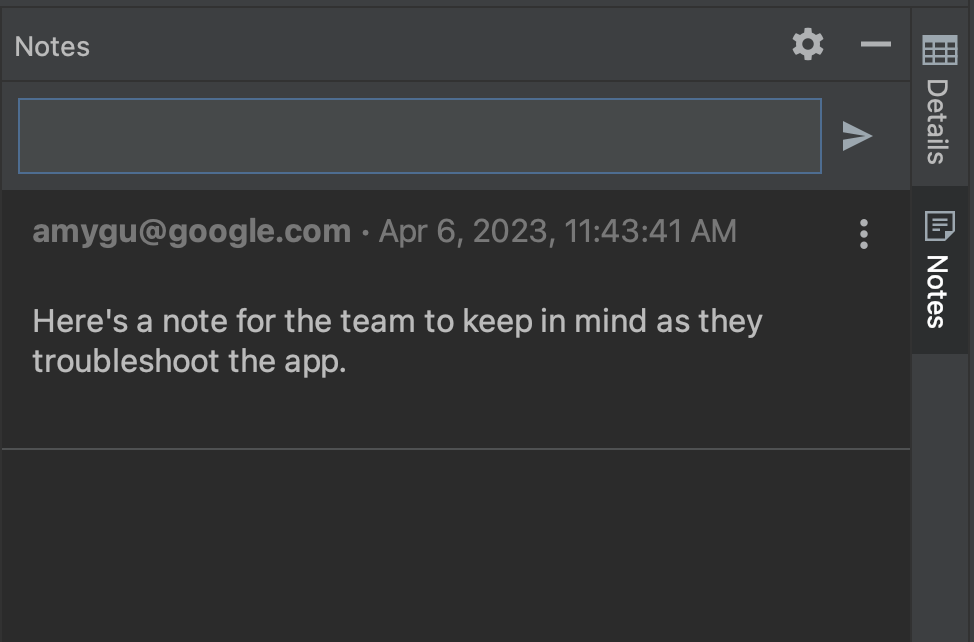
- 建議您閱讀並附加問題附註,這樣團隊成員就能在 Firebase 控制台中看到這些資訊。如要撰寫某個問題的附註,請選取問題並開啟「Notes」面板。您必須具備 Crashlytics 專案的寫入權限,才能撰寫附註。在「Issues」面板中,有附註的問題會顯示「notes」圖示
 。
。
- 妥善運用各種篩選器,找出特定事件子集。您可以選取或取消選取「嚴重」
 、「不嚴重」
 和 ANR
和 ANR
 事件,並依時間、應用程式版本、Crashlytics 信號、裝置廠牌和型號,以及 Android 平台版本進行篩選。請注意,就 Crashlytics 信號狀態而言,如果問題過去曾經關閉,但在新版應用程式中再度出現,就視為「迴歸」問題。
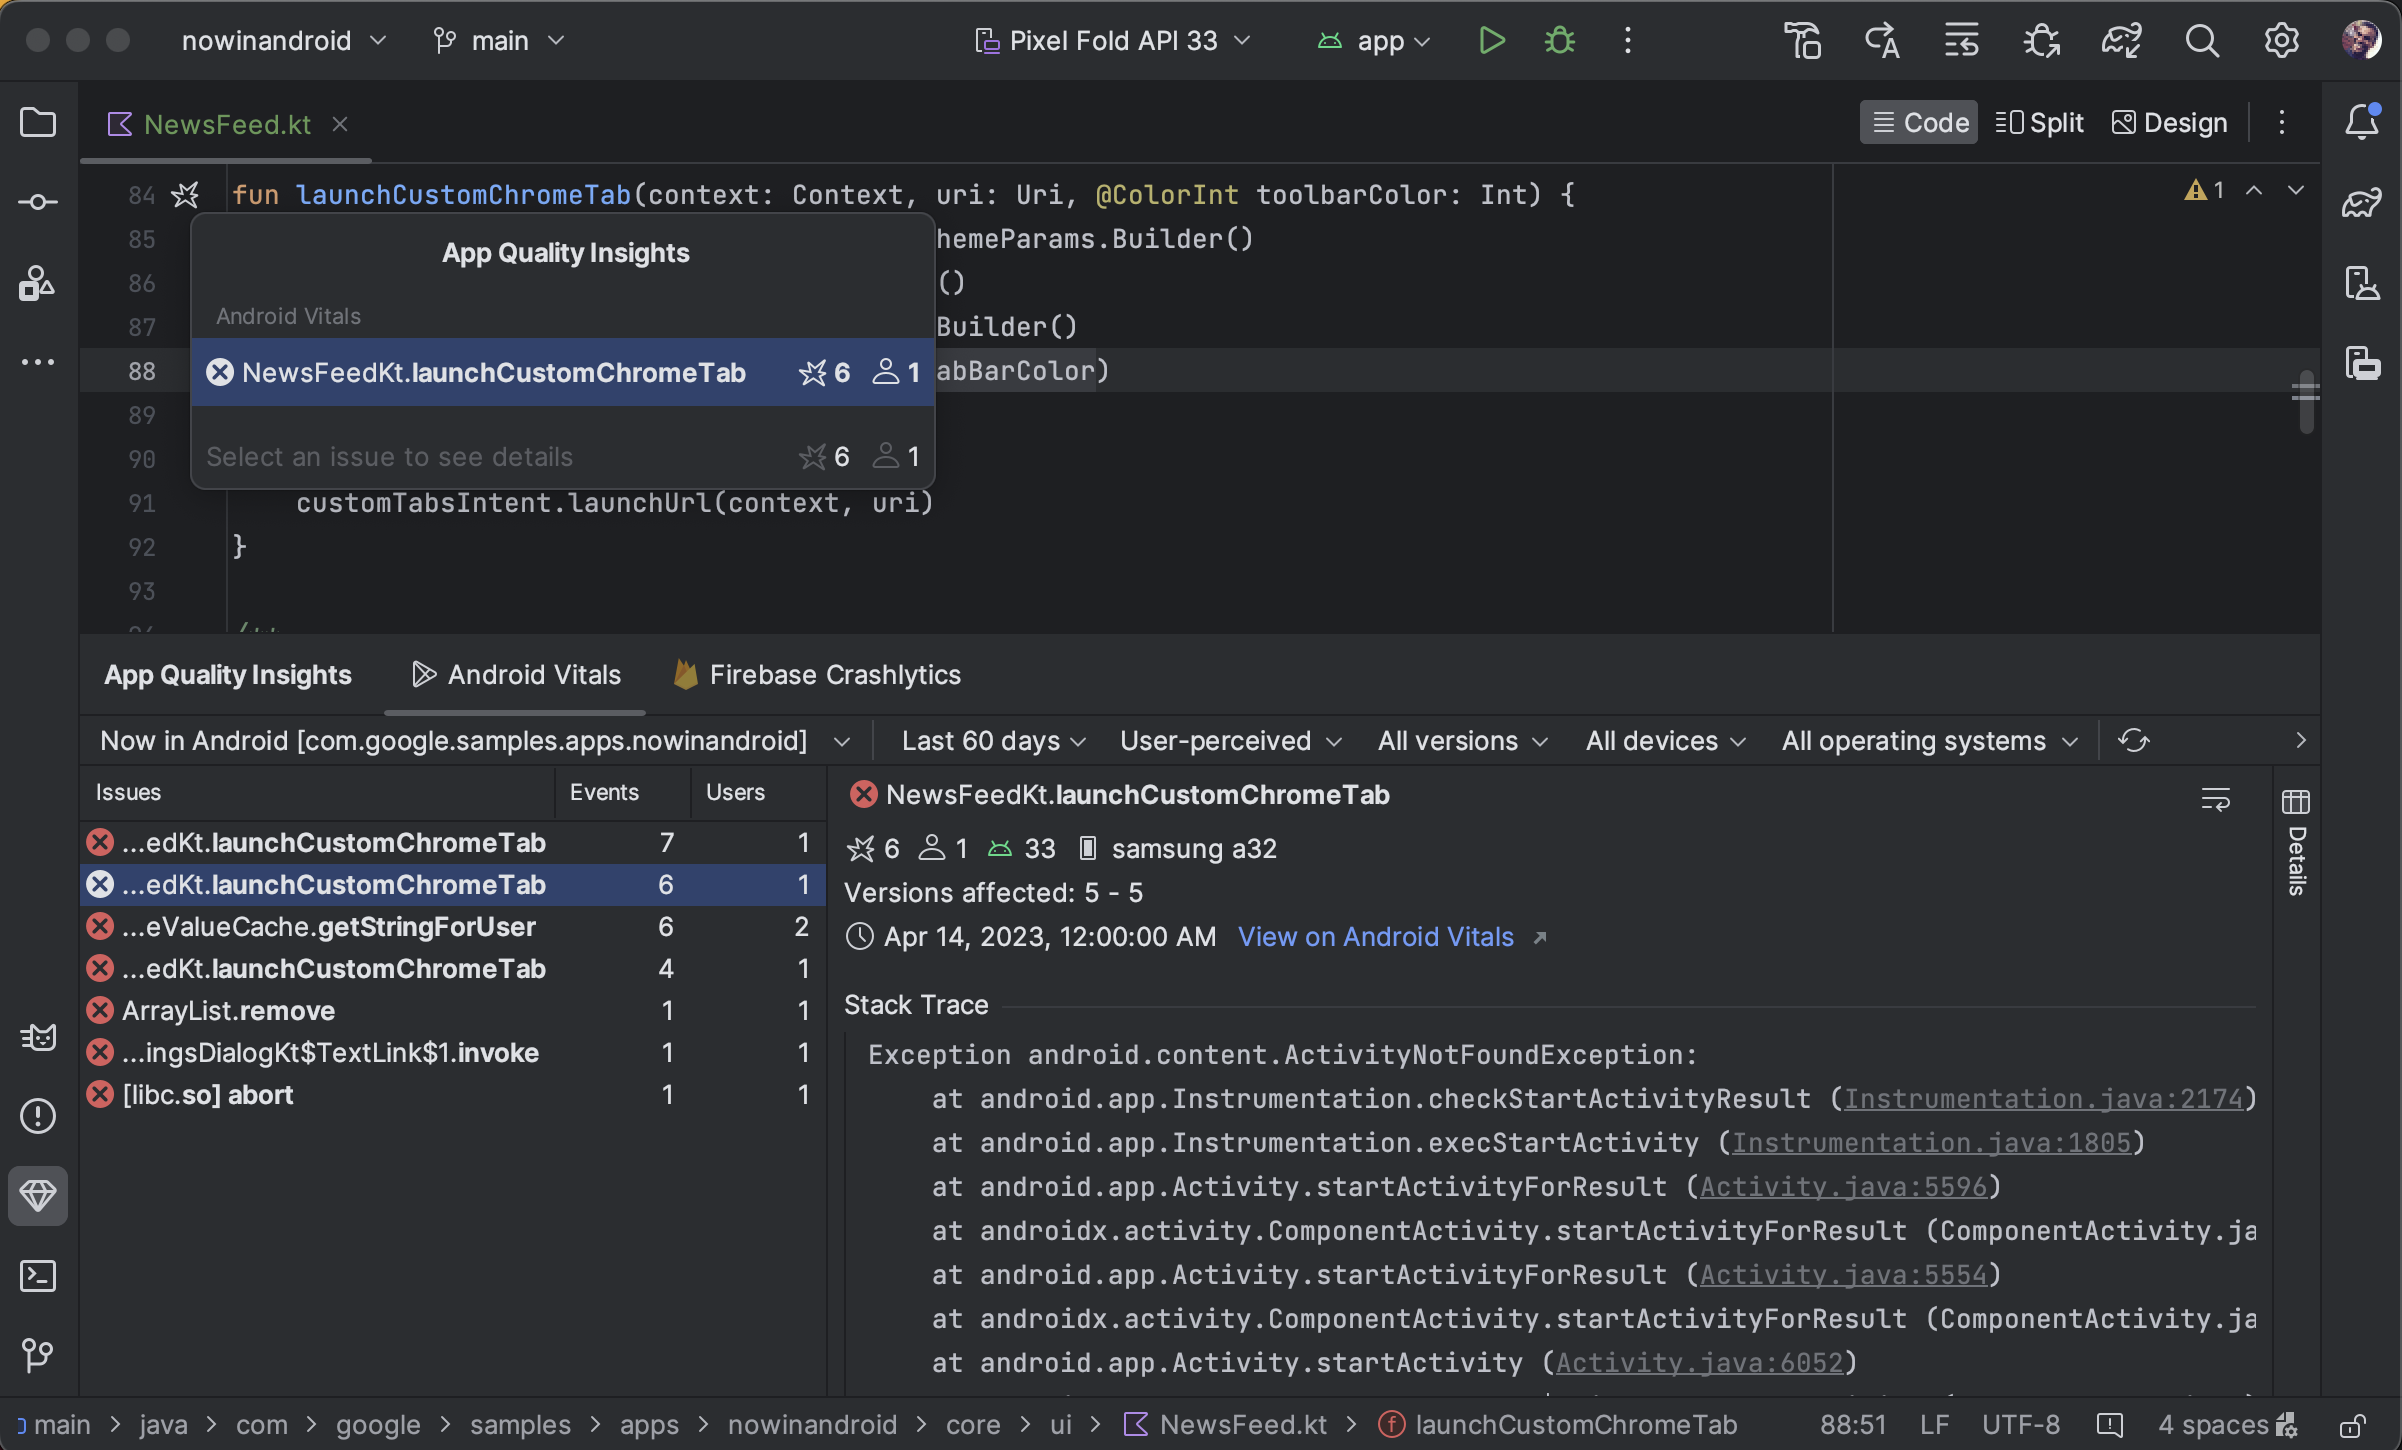
您可從堆疊追蹤前往相關程式碼,也能從程式碼跳至堆疊追蹤:Android Studio 現在會為有關當機事件的程式碼行加上當機空白邊圖示 ![]() ,方便您輕鬆找出問題並偵錯。
,方便您輕鬆找出問題並偵錯。
將滑鼠游標懸停在當機圖示上,畫面上就會出現彈出式視窗,顯示與該程式碼行相關的事件數量和事件發生頻率。
![]()
按一下當機圖示即可查看更詳細的事件清單,並瞭解特定事件的發生頻率和受影響使用者人數。按一下特定事件,即可前往「App Quality Insights」工具視窗查看事件詳細資訊。
![]()
Android Vitals 和 Crashlytics 的數量不同
請注意,對於同一當機情形相關聯的使用者和事件數量,Android Vitals 和 Crashlytics 回報的值可能有所不同。之所以會有這些差異,是因為 Play 和 Crashlytics 可能在不同時間點、針對不同使用者擷取當機事件。以下是 Play 和 Crashlytics 數量可能有落差的幾個原因:
- Play 是擷取啟動時的當機事件,但 Crashlytics 會擷取 Crashlytics SDK 初始化後發生的當機情形。
- 如果使用者在新手機中停用當機回報功能,相關的當機事件就不會回報給 Play,但 Crashlytics 會根據應用程式自身的隱私權政策擷取當機事件。
離線時透過受限功能進行調查
如果您建立新要求 (例如按一下「Refresh」),但 Android Studio 無法與 Crashlytics 通訊,即可透過「App Quality Insights」視窗進入離線模式。
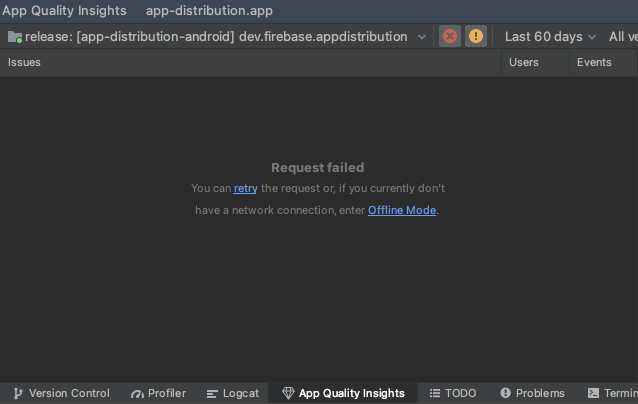
在這個模式下,您可以繼續調查快取資料中的問題和最新事件。不過,該模式不支援部分功能,例如您無法變更某些篩選器選項或關閉問題。如要重新嘗試與 Crashlytics 連線並恢復連線狀態,請按一下「Reconnect」
![]() 。
。
權限
請參閱「服務權限」。