앱 품질 통계로 Firebase Crashlytics 및 Android vitals의 문제 분석
컬렉션을 사용해 정리하기
내 환경설정을 기준으로 콘텐츠를 저장하고 분류하세요.
Firebase Crashlytics 및 Android Vitals의 앱 비정상 종료 데이터를 Android 스튜디오에서 바로 확인하고 조치를 취할 수 있습니다. 이러한 통합을 통해 Crashlytics 및 Google Play의 스택 트레이스 데이터 및 비정상 종료 통계가 스튜디오 IDE의 App Quality Insights 도구 창으로 전달되므로 브라우저와 IDE 간을 이동하지 않아도 됩니다. 개발팀은 다음과 같은 주요 기능을 활용할 수 있습니다.
관련 Crashlytics 이벤트 데이터가 있는 경우 코드에서 줄이 강조 표시됩니다.
주요 비정상 종료에 관한 스택 트레이스를 확인하고 스택 트레이스를 클릭하여 코드에서 관련 줄로 이동합니다.
주요 비정상 종료 및 심각하지 않은 이벤트에 관한 요약 통계를 확인합니다(예: 기기 제조업체 및 Android 버전별로 그룹화).
심각도, 시간, 앱 버전을 비롯하여 속성별로 이벤트를 필터링합니다.
이벤트에 관한 자세한 내용이 포함된 Crashlytics 대시보드 페이지를 여는 브라우저 링크를 가져옵니다.
특정 문제의 근본 원인을 더 쉽게 이해하고 해결하는 데 도움이 되는 통계를 확인하세요.
Android Vitals 보고서는 Google Play에 게시된 모든 앱에서 사용할 수 있습니다. Crashlytics를 아직 사용하고 있지 않으며 제공 항목에 관해 자세히 알아보려면 Firebase Crashlytics를 참고하세요.
시작하기
Android 스튜디오에서 Crashlytics 데이터를 보려면 앱 프로젝트에서 Firebase 및 Crashlytics를 설정해야 합니다. 방법은 다음과 같습니다. Android 스튜디오에서 Tools > Firebase로 이동하여 Firebase Assistant를 열고 Crashlytics를 클릭한 후 튜토리얼에 따라 Firebase 및 Crashlytics를 프로젝트에 추가합니다. Firebase Assistant 워크플로에 관한 자세한 내용은 Android용 Firebase 시작 가이드를 참고하세요.
앱에 이미 Firebase와 Crashlytics를 추가했다면 아바타 아이콘 을 클릭하여 IDE에서 개발자 계정에 로그인합니다.
로그인한 후 App Quality Insights 도구 창 을 클릭합니다. Crashlytics의 보고서로 채워진 패널이 표시됩니다.
Android vitals 분석
앱 품질 통계에는 Android vitals 데이터가 포함되어 있습니다. 이를 통해, Google Play에서 수집한 핵심 측정항목에 더 쉽게 액세스하고 사용자 환경을 개선할 수 있습니다. Android vitals를 사용하여 앱 안정성과 관련된 문제를 해결하면 Google Play에서 앱의 품질을 개선하는 데 도움이 됩니다.
App Quality Insights 도구 창에서 Android vitals 문제를 보고 이를 필터링하고 스택 트레이스에서 코드로 이동할 수 있습니다. 시작하려면 다음 단계를 따르세요.
툴바 끝에 있는 프로필 아이콘 을 사용하여 Android 스튜디오의 개발자 계정에 로그인합니다.
Android 스튜디오의 도구 창을 클릭하거나 View > Tool Windows > App Quality Insights를 클릭하여 App Quality Insights를 엽니다.
App Quality Insights에서 Android vitals 탭을 클릭합니다.
선택사항: 디버그 가능한 빌드에 버전 관리 통합을 사용하려면 최신 Firebase Crashlytics SDK(또는 Firebase Android Bill of Materials)를 앱에 추가합니다. 그런 다음 모듈 수준 build.gradle.kts 또는 build.gradle 파일에 다음 코드를 추가합니다. 출시(디버그 불가) 빌드에는 기본적으로 이 플래그가 사용 설정되어 있습니다.
App Quality Insights 도구 창에는 사용자에게 발생하는 이벤트에 관한 유용한 정보를 제공하는 리치 데이터와 이러한 이벤트의 소스로 빠르게 이동하는 데 도움이 되는 링크가 포함되어 있습니다.
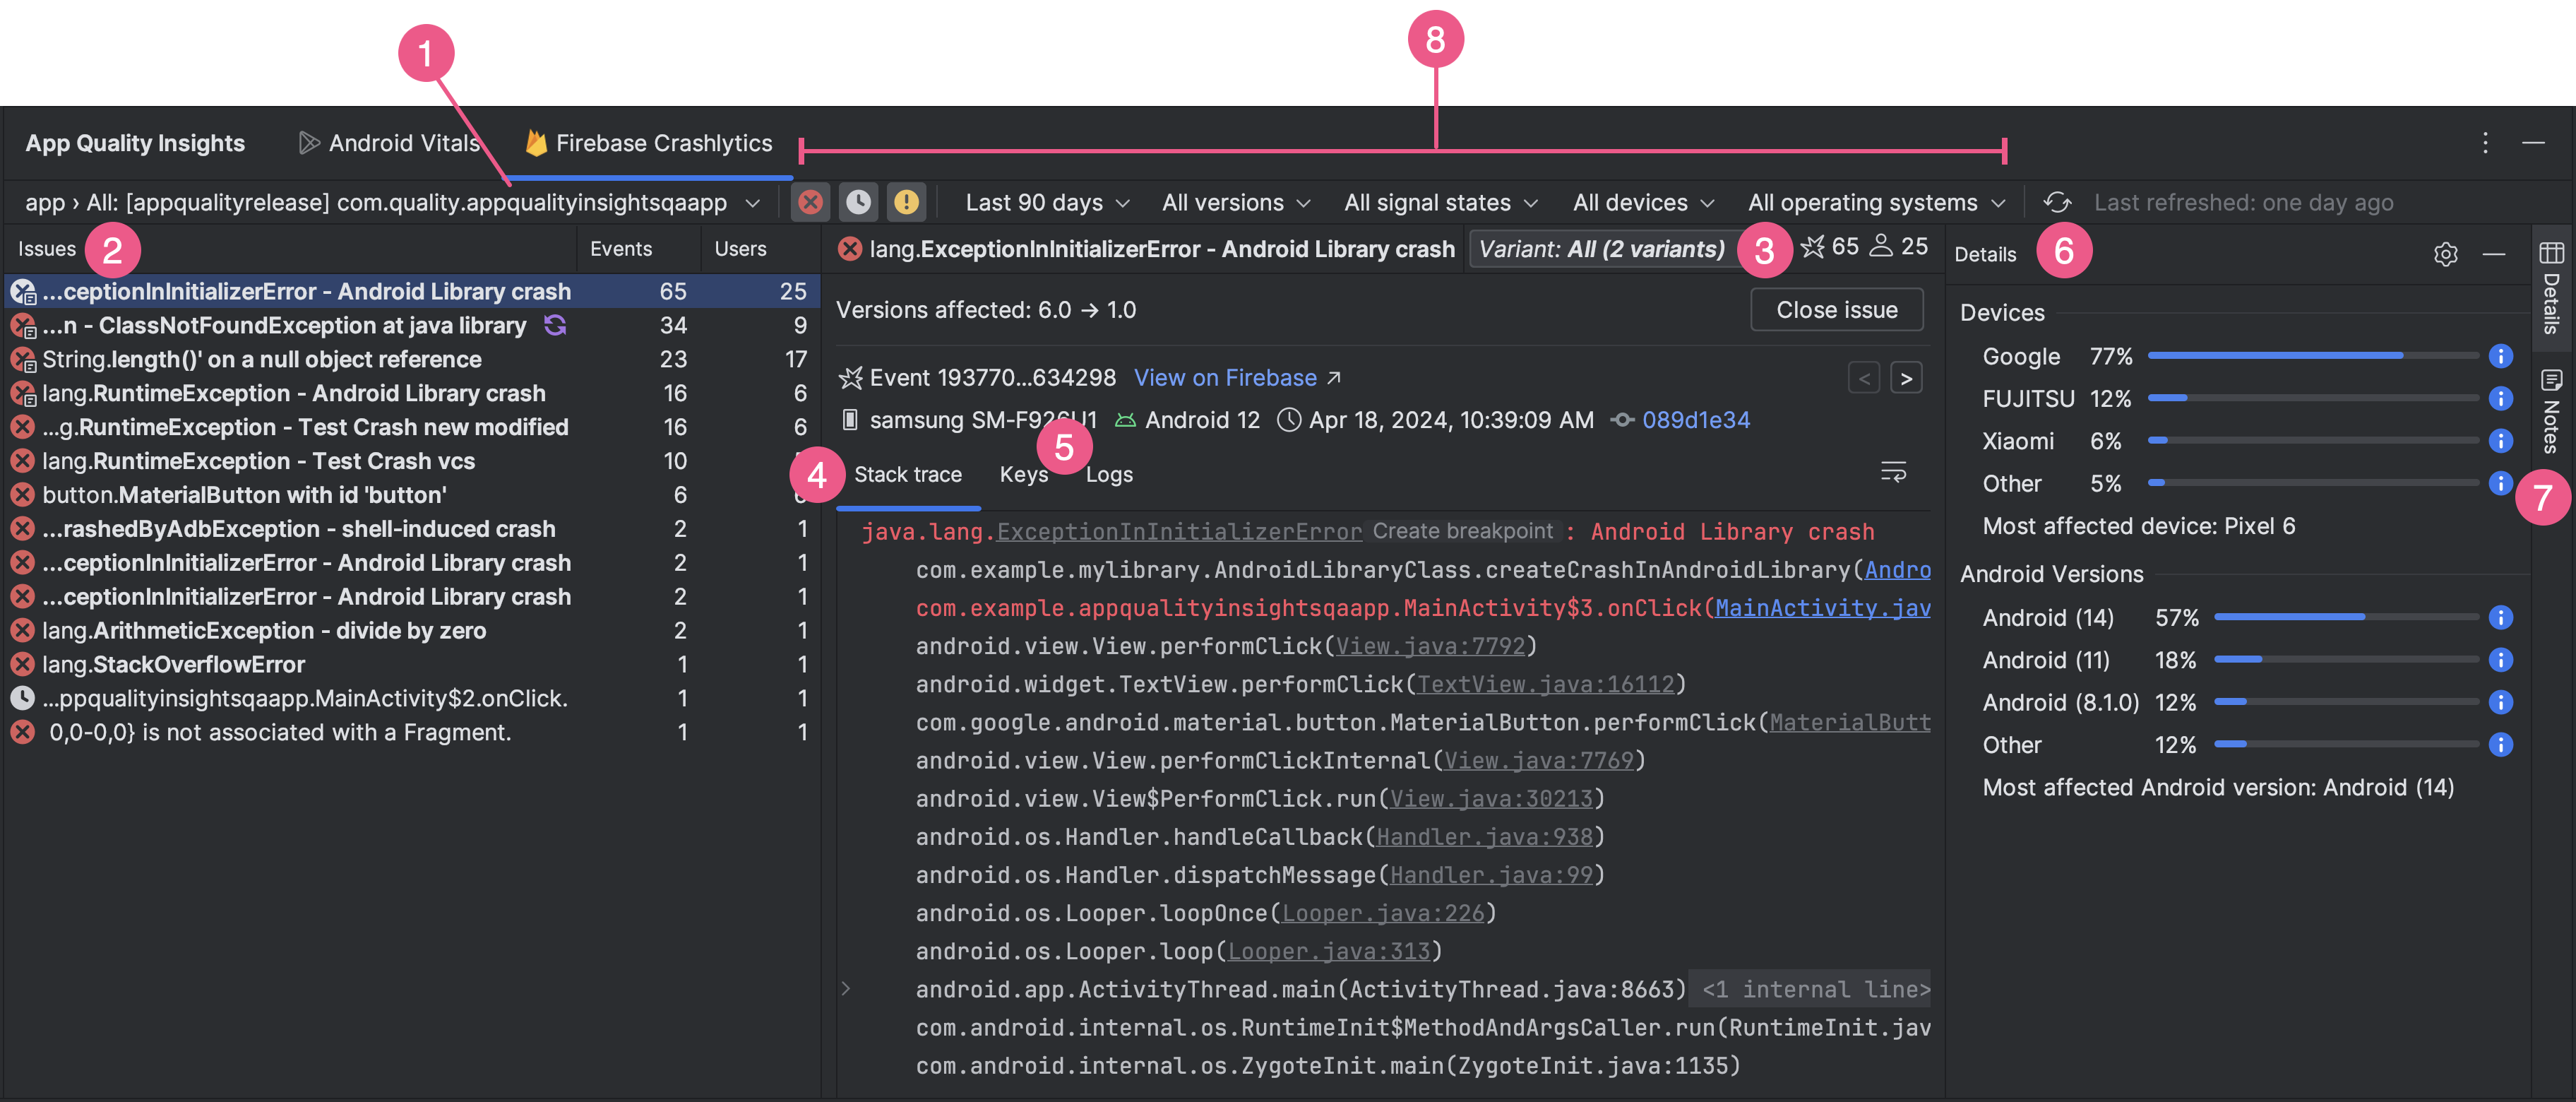
애플리케이션 ID 드롭다운 메뉴를 사용하여 분석하려는 앱 ID를 선택합니다. 예를 들어 IDE에서 앱의 디버그 버전을 작업하는 동안 사용자가 설치하는 앱의 프로덕션 버전에 관한 이벤트 데이터를 확인해야 할 수 있습니다.
Issues 패널은 Crashlytics에서 데이터를 보유한 상위 이벤트를 표시하며 가장 영향력이 큰 비정상 종료를 기준으로 정렬됩니다.
변형 또는 스택 트레이스가 유사한 이벤트 그룹별로 이벤트를 확인합니다. 변형별로 이벤트를 분석하면 비정상 종료의 근본 원인을 파악하는 데 도움이 됩니다.
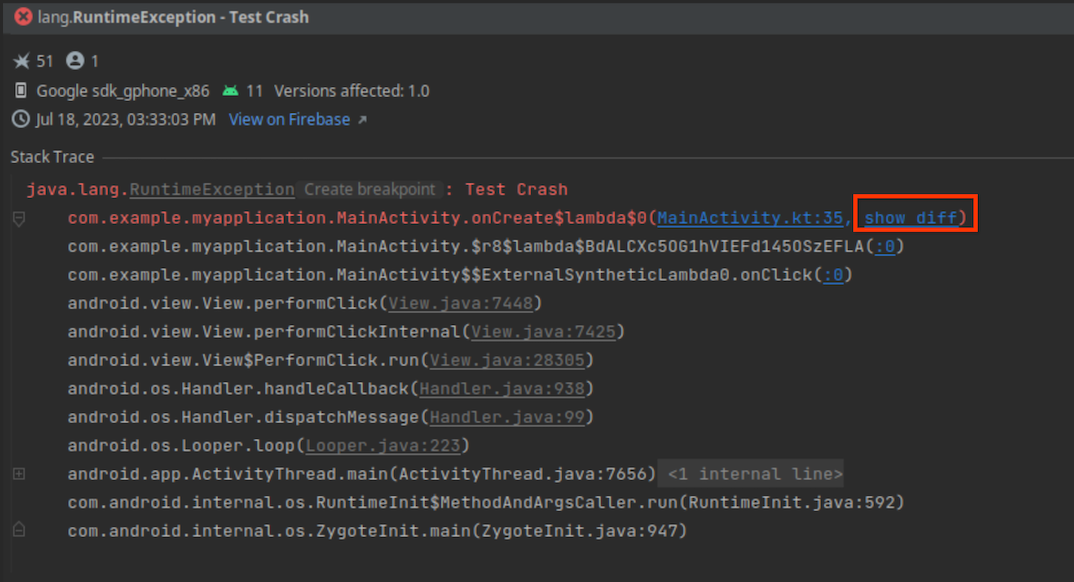
스택 트레이스 탭에는 Issues 패널에서 클릭한 최근에 발생한 이벤트에 관한 세부정보가 표시됩니다. 이벤트의 스택 트레이스를 확인하고 스택 트레이스를 클릭하여 코드베이스의 관련 줄로 이동할 수 있습니다. 비정상 종료가 발생한 이후 코드가 변경된 경우 스택 트레이스의 오류 옆에 있는 차이 보기를 클릭하여 현재 코드와 비정상 종료를 생성한 코드베이스 버전 간의 차이를 확인합니다.
또한 영향을 받는 기기 유형, Android 버전,
이벤트가 발생한 시간에 관한 정보와 Firebase Crashlytics 대시보드의 이벤트 링크도
있습니다. 그룹의 여러 이벤트 정보를 둘러보려면 왼쪽 및 오른쪽 화살표를 사용하세요. Close issue를 클릭하여 패널에서 바로 문제를 닫습니다.
키 및 로그 탭에는 각 Crashlytics 보고서의 맞춤 키-값 쌍과 로그가 표시됩니다.
Details 패널은 비정상 종료 수를 기기 유형과 Android 버전별로 분석하므로 가장 영향을 많이 받는 사용자 그룹을 파악할 수 있습니다. 또한 비정상 종료가 발생한 앱 버전과 영향을 받는 사용자 수도 표시합니다.
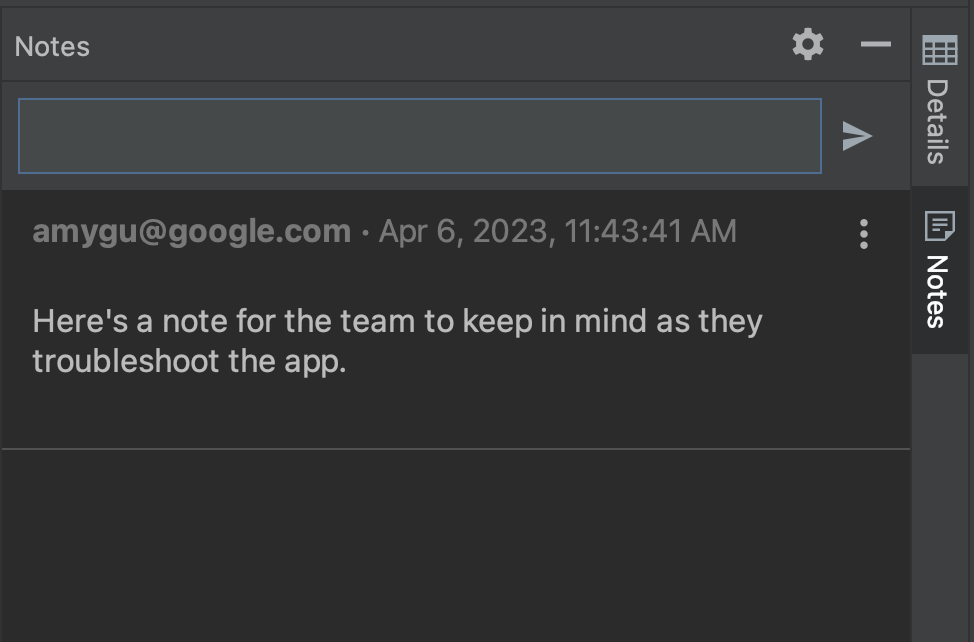
Firebase Console 및 팀원들이 확인할 수 있도록 메모를 읽고 문제에 첨부합니다. 문제에 관한 메모를 작성하려면 문제를 선택하고 Notes 패널을 엽니다. 메모를 작성하려면 Crashlytics 프로젝트에 쓰기 권한이 있어야 합니다. 메모 관련 문제는 Issues 패널에 '메모' 아이콘 과 함께 표시됩니다.
다양한 필터를 사용하여 이벤트의 특정 하위 집합으로 세부 조정할 수 있습니다. 시간, 앱 버전, Crashlytics 신호, 기기 제조업체 및 모델, Android 플랫폼 버전별 필터와 함께 Fatal , Non-Fatal , ANR 이벤트를 선택하거나 선택 해제할 수 있습니다. Crashlytics 신호 상태의 경우 전에 종료된 문제가 앱의 새 버전에서 다시 발생하면 회귀된 것으로 간주됩니다.
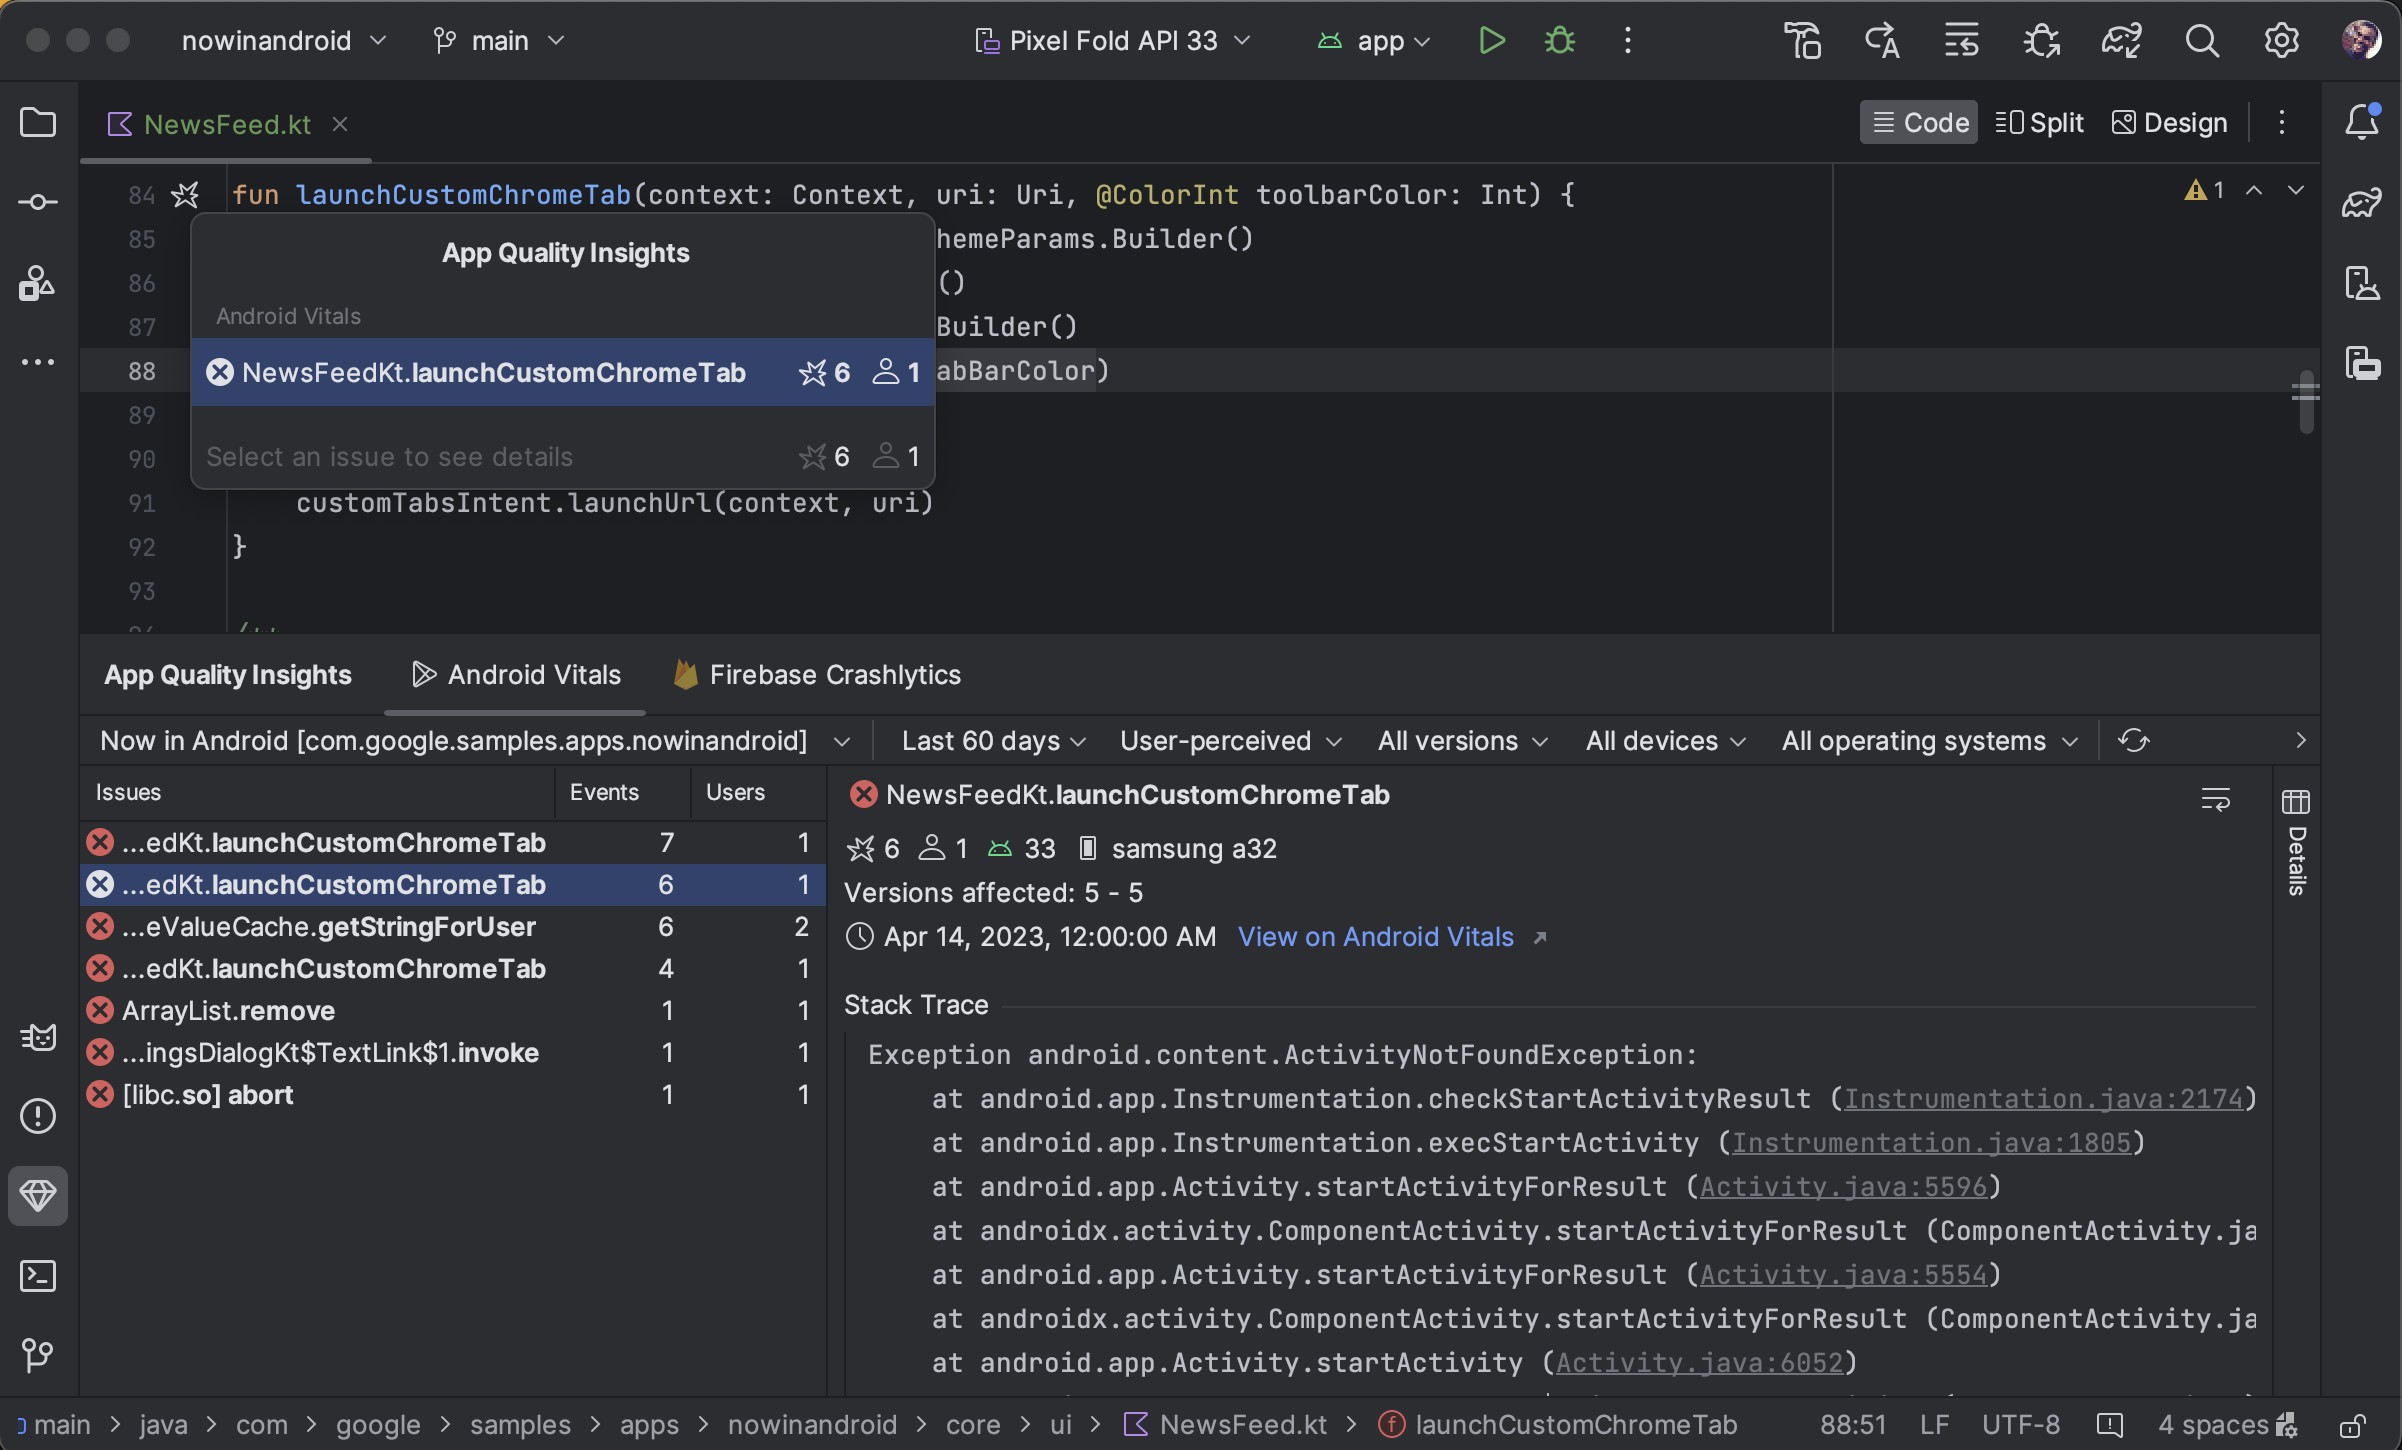
스택 트레이스에서 코드로 이동할 수 있을 뿐만 아니라 코드에서 스택 트레이스로 이동할 수도 있습니다. 이제 Android 스튜디오에서는 비정상 종료와 관련된 코드 줄에 비정상 종료 여백 아이콘 으로 주석을 추가하므로 이를 쉽게 발견하여 디버그할 수 있습니다.
비정상 종료 아이콘 위로 마우스를 가져가면 해당 코드 줄과 관련된 이벤트 수와 이벤트 빈도를 보여주는 팝업이 표시됩니다.
특정 이벤트의 빈도와 해당 이벤트의 영향을 받는 사용자 수 등 이벤트에 관한 자세한 목록을 보려면 비정상 종료 아이콘을 클릭합니다. 특정 이벤트를 클릭하여 App Quality Insights 도구 창에서 이벤트 세부정보로 이동합니다.
Android vitals와 Crashlytics의 다른 수치
Android vitals와 Crashlytics는 동일한 비정상 종료와 관련된 사용자 및 이벤트 수 값을 다르게 보고할 수 있습니다. 이러한 불일치가 발생하는 이유는 Play와 Crashlytics가 서로 다른 시간에 서로 다른 사용자의 비정상 종료를 포착할 수 있기 때문입니다. 다음은 Play 수와 Crashlytics 수가 다를 수 있는 몇 가지 이유입니다.
Play는 부팅 시 시작되는 비정상 종료를 포착하지만 Crashlytics는 Crashlytics SDK 초기화 후 발생하는 비정상 종료를 포착합니다.
사용자가 새 휴대전화를 구매할 때 비정상 종료 보고를 선택 해제하면 이러한 비정상 종료는 Play에 보고되지 않습니다. 하지만 Crashlytics는 앱의 자체 개인정보처리방침에 따라 비정상 종료를 포착합니다.
오프라인에서 제한된 기능을 사용하여 조사
예를 들어 Refresh를 클릭하여 새로 요청했는데 Android 스튜디오가 Crashlytics와 통신할 수 없는 경우 앱 품질 통계 창에서 오프라인 모드로 진입합니다.
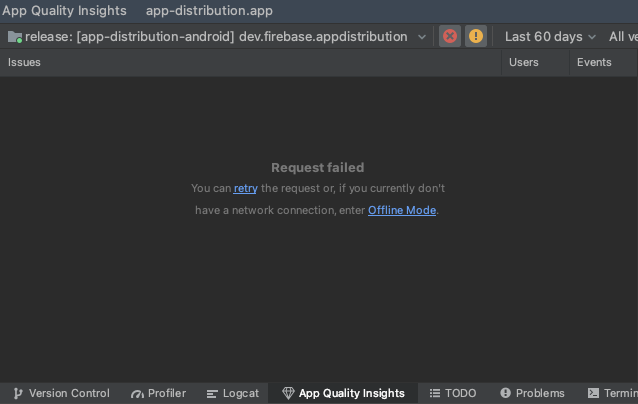
이 모드에서는 캐시된 데이터의 문제 및 최근 이벤트를 계속 조사할 수 있습니다. 일부 필터 옵션 변경이나 문제 종료와 같은 특정 기능은 사용할 수 없습니다. Crashlytics 연결을 다시 시도하고 온라인 상태로 돌아가려면 Reconnect(다시 연결)를 클릭합니다.
이 페이지에 나와 있는 콘텐츠와 코드 샘플에는 콘텐츠 라이선스에서 설명하는 라이선스가 적용됩니다. 자바 및 OpenJDK는 Oracle 및 Oracle 계열사의 상표 또는 등록 상표입니다.
최종 업데이트: 2025-07-27(UTC)
[[["이해하기 쉬움","easyToUnderstand","thumb-up"],["문제가 해결됨","solvedMyProblem","thumb-up"],["기타","otherUp","thumb-up"]],[["필요한 정보가 없음","missingTheInformationINeed","thumb-down"],["너무 복잡함/단계 수가 너무 많음","tooComplicatedTooManySteps","thumb-down"],["오래됨","outOfDate","thumb-down"],["번역 문제","translationIssue","thumb-down"],["샘플/코드 문제","samplesCodeIssue","thumb-down"],["기타","otherDown","thumb-down"]],["최종 업데이트: 2025-07-27(UTC)"],[],[],null,["# Analyze issues from Firebase Crashlytics and Android Vitals with App Quality Insights\n\n| **Note:** App Quality Insights is only available in the current stable channel version of Android Studio, the three most recent previous major versions, and patches associated with those versions. If you are using an older version of Android Studio, you will need to update to use App Quality Insights. [More\n| information](/studio/releases#service-compat).\n\nYou can see and act on app crash data from\n[Firebase Crashlytics](https://firebase.google.com/products/crashlytics) and\n[Android Vitals](/topic/performance/vitals)\ndirectly in Android Studio. This integration pulls stack trace data and crash\nstatistics from Crashlytics and Google Play into the **App Quality Insights**\ntool window in the Studio IDE, so you don't have to jump back and forth between\nyour browser and the IDE. Development teams can benefit from key capabilities\nincluding the following:\n\n- See lines in your code highlighted when they have related Crashlytics event data.\n- See the stack trace for top crashes and click on the stack trace to jump to the relevant lines in your code.\n- See summary statistics about top crash and non-fatal events, for example grouped by device manufacturer and Android version.\n- Filter events by attributes including severity, time, and app version.\n- Get a browser link that opens the Crashlytics dashboard page with more details about the event.\n- Get insights that help you more easily understand and resolve root causes of certain issues.\n\nAndroid Vitals reports are available to all apps published to Google Play. If\nyou're not using Crashlytics yet and would like to learn more about its\nofferings, see\n[Firebase Crashlytics](https://firebase.google.com/products/crashlytics).\n\nGet started\n-----------\n\nTo see Crashlytics data in Android Studio, you need to set up Firebase and\nCrashlytics in your app project. Here's how: open the Firebase Assistant in\nAndroid Studio by going to **Tools \\\u003e Firebase** , click **Crashlytics** , and then\nfollow the tutorial to add Firebase and Crashlytics to your project. You can\nread more about the Firebase Assistant workflow in\n[Firebase's getting started guide for Android](https://firebase.google.com/docs/android/setup#assistant).\n\nIf you've already added Firebase and Crashlytics to your app, sign in to your\nDeveloper account in the IDE by clicking on the avatar icon\n.\nAfter you sign in, click the **App Quality Insights** tool window\n. You should\nsee the panels populate with reports from Crashlytics.\n\nAnalyze Android vitals\n----------------------\n\n**App Quality Insights** includes [Android vitals](/topic/performance/vitals)\ndata. This lets you more easily access core metrics collected by Google Play and\nimprove your user experience. Use Android vitals to address issues related to\napp stability to help improve the quality of your app on Google Play.\n\nYou can view Android vitals issues, filter them, and jump from stack trace to\ncode all from the **App Quality Insights** tool window. To get started, follow\nthese steps:\n\n1. Sign in to your developer account in Android Studio using the profile icon at the end of the toolbar.\n2. Open **App Quality Insights** by clicking the tool window in Android Studio or clicking **View \\\u003e Tool Windows \\\u003e App Quality Insights**.\n3. Click the **Android vitals** tab within **App Quality Insights**.\n4. Optional: To use version control integration for a debuggable build, add the\n latest\n [Firebase Crashlytics SDK](https://firebase.google.com/docs/crashlytics/get-started?platform=android#add-sdk)\n (or Firebase Android Bill of Materials) to your app. Then add the following\n code to the module-level `build.gradle.kts` or `build.gradle` file. Release\n (non-debuggable) builds have the flag enabled by default.\n\n | **Note:** App Quality Insights only supports version control using git.\n\n\u003cbr /\u003e\n\n### Kotlin\n\n```kotlin\nandroid {\n buildTypes {\n getByName(\"debug\") {\n vcsInfo {\n include = true\n }\n }\n }\n}\n```\n\n### Groovy\n\n```groovy\nandroid {\n buildTypes {\n debug {\n vcsInfo {\n include true\n }\n }\n }\n}\n```\n\n\u003cbr /\u003e\n\nAnalyze Crashlytics data in Android Studio\n------------------------------------------\n\nThe **App Quality Insights** tool window has rich data that gives you insight\ninto the events your users are encountering, and links to help you quickly\nnavigate to the sources of those events.\n\n1. Use the application ID dropdown menu to select the app ID you want to analyze. For example, while you might work on the debug version of your app in the IDE, you might want to see event data for your production version of your app that your users install.\n2. The **Issues** panel shows the top events that Crashlytics has data for, and is sorted by your most impactful crashes.\n3. View events by *variants*, or groups of events that have similar stack traces. Analyzing events by variant helps you identify the root causes of a crash.\n4. The **Stack trace** tab shows details about the latest\n occurrence of the event you click in the **Issues** panel. You can see the\n event's stack trace and click the stack trace to jump to the relevant lines in\n your codebase. If your code has changed since the crash occurred, click\n **show diff** next to the error in the stack trace to view a diff between\n your current code and the version of your codebase that generated the crash.\n\n There is also information about the device type affected, its Android\n version, and the time the event occurred, as well a link to the event in the\n Firebase Crashlytics dashboard. To browse info for multiple events in a group,\n use the left and right arrows. Click **Close issue** to close an issue\n directly from the panel.\n5. The **Keys** and **Logs** tabs show custom key-value pairs and logs for each Crashlytics report.\n6. The **Details** panel breaks down the crash counts by device type and Android version, so you can determine which user groups are most affected. It also shows which app versions experienced the crash and the number of users affected.\n7. Read and attach notes to issues so that they are visible in the Firebase Console and your teammates. To write a note about an issue, select the issue and open the **Notes** panel. You must have write permission to the Crashlytics project in order to write notes. Issues with notes appear with a \"notes\" icon in the **Issues** panel.\n8. Use the variety of filters to hone in on certain subsets of events. You can select or deselect events that are Fatal , Non-Fatal , and [ANRs](/topic/performance/anrs/keep-your-app-responsive) , as well as filter by time, app version, [Crashlytics Signal](https://firebase.google.com/support/releases#october_8_2021), device make and model, and Android platform version. Note that for the Crashlytics Signal states, an issue is considered *regressed* when it's been closed in the past and has occurred again in a new version of the app.\n\nIn addition to being able to navigate from stack trace to code, you can also\njump from code to stack trace: Android Studio now annotates lines of code that\nare related to crashes with a crash gutter icon\nso you\ncan easily spot and debug them.\n\nWhen you hover over the crash icon, a pop-up appears that shows how many events\ninvolve that line of code, and the event frequencies.\n\nClick on the crash icon for a more detailed list of events, including the\nfrequency of and number of users affected by a given event. Click on a specific\nevent to jump to the event details in the **App Quality Insights** tool window.\n\n### Different numbers between Android vitals and Crashlytics\n\nNote that Android vitals and Crashlytics might report different values for the\nnumbers of users and events associated with the same crash. These discrepancies\nhappen because Play and Crashlytics can catch crashes at different times and for\ndifferent users. Here are a couple reasons for why the Play and Crashlytics\ncounts might differ:\n\n- Play catches crashes starting at boot time, whereas Crashlytics catches crashes that happen after the Crashlytics SDK initializes.\n- If a user opts out of crash reporting when they get a new phone, those crashes aren't reported to Play; however, Crashlytics catches crashes based on an app's own privacy policy.\n\nInvestigate with limited functionality when offline\n---------------------------------------------------\n\nIf you make a new request, for example by clicking **Refresh** , and Android\nStudio is unable to communicate with Crashlytics, the **App Quality Insights**\nwindow lets you to enter **Offline Mode**.\n\nWhile in this mode, you can continue to investigate issues and the latest events\nfrom cached data. Certain functionality, such as changing some filter options or\nclosing issues, isn't available. To retry your connection to Crashlytics\nand return to an online state, click **Reconnect**\n."]]