
You can use the DevTools built into the Chrome browser running on your development machine to remotely inspect and debug the WebViews running in your app. For a detailed guide about remote debugging for WebViews, see Remote debugging WebViews.
To learn more about DevTools, see Overview of Chrome DevTools.
Enable connection from Chrome DevTools
Your app's WebView won't enable connections from Chrome DevTools by default. You must enable WebView debugging in your application's code.
- Make sure you are set up to run your app on a hardware or virtual device.
- Enable WebView debugging in your application code by calling
setWebContentsDebuggingEnabled. This is usually done in theActivityorApplicationclass where the WebView is initialized.
We recommend wrapping setWebContentsDebuggingEnabled in a conditional check so
that debugging is enabled only in development builds, not in production. This
setting applies to all WebViews in your app.
WebView debugging isn't affected by the state of the debuggable flag in the
application's manifest. If you want to enable WebView debugging only when the
debuggable flag is set to true, test for this flag at runtime as shown in
the following example:
Kotlin
if (applicationInfo.flags and ApplicationInfo.FLAG_DEBUGGABLE != 0) {
     WebView.setWebContentsDebuggingEnabled(true)
}
Java
if (0 != (getApplicationInfo().flags & ApplicationInfo.FLAG_DEBUGGABLE)) {
     WebView.setWebContentsDebuggingEnabled(true);
}
Start debugging your WebView
After you have enabled WebView debugging in your application code and your app is running on a physical device or the Android Emulator, connect Chrome DevTools to your WebView:
- Open Chrome on your development machine.
- Go to
chrome://inspect. On the
chrome://inspectpage, make sure Discover USB devices is checked. Find your device in the Remote Target section.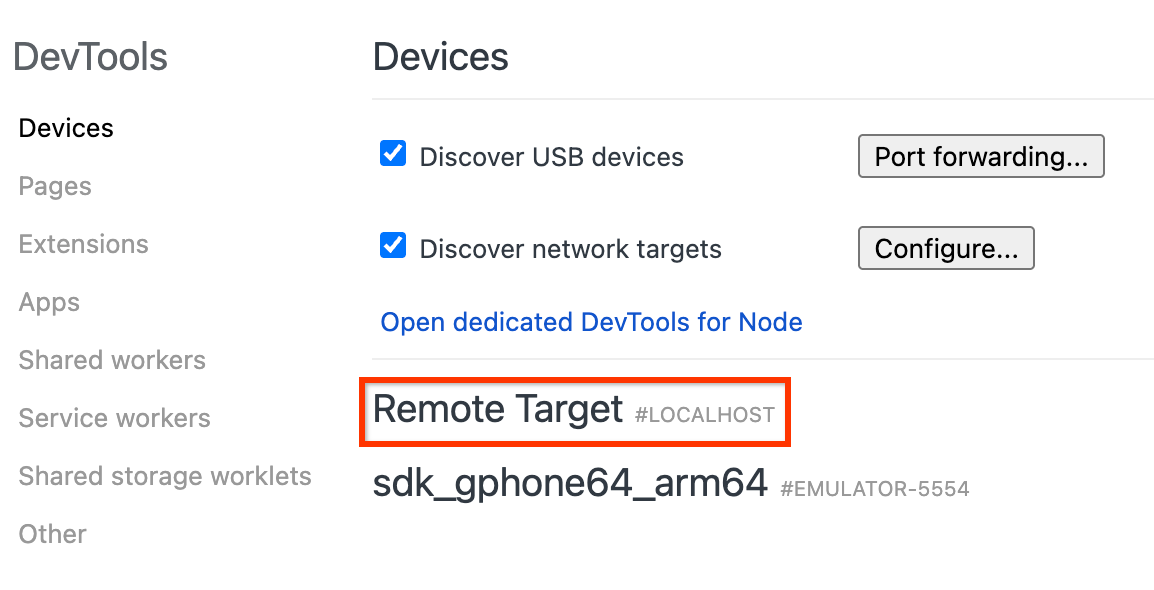
Figure 1. Chrome DevTools inspect page showing remote targets available for debugging. Under your device's name, Chrome lists all debug-enabled WebViews running on that device, usually identified by WebView in followed by the app's package name. Find the WebView you want to debug, and click the inspect link.
You will see a new DevTools instance open that you can use to inspect your WebView.
If you're serving content from a local web server on your development machine, see Access a local development server from WebView to learn how to connect to it from your device or emulator. For troubleshooting, see Remote debug Android devices and Remote debugging WebViews.