
On Android 16 (API level 36) and higher, ProfilingManager lets you capture
profiles automatically in response to system triggers, such as Application Not
Responding (ANR) errors, Out of Memory (OutOfMemoryError) crashes, or app
startup events. Because you can't predict when many of these events will occur
in the field, it's impractical to start a recording manually in advance. With
trigger-based profiling, the system manages the capture and delivers the
resulting profile to your app so you can:
- Debug stability issues: Diagnose unpredictable ANRs and memory leaks.
- Optimize critical user journeys (CUJs): Analyze flows such as app
startup (
TRIGGER_TYPE_COLD_STARTandTRIGGER_TYPE_APP_FULLY_DRAWN). - Understand user behavior: Inspect events such as user-initiated app exits.
For the full list of available triggers, see ProfilingTrigger.
Types of triggers
Triggers differ in how the system captures the profile when the event occurs.
Triggers that use the background trace
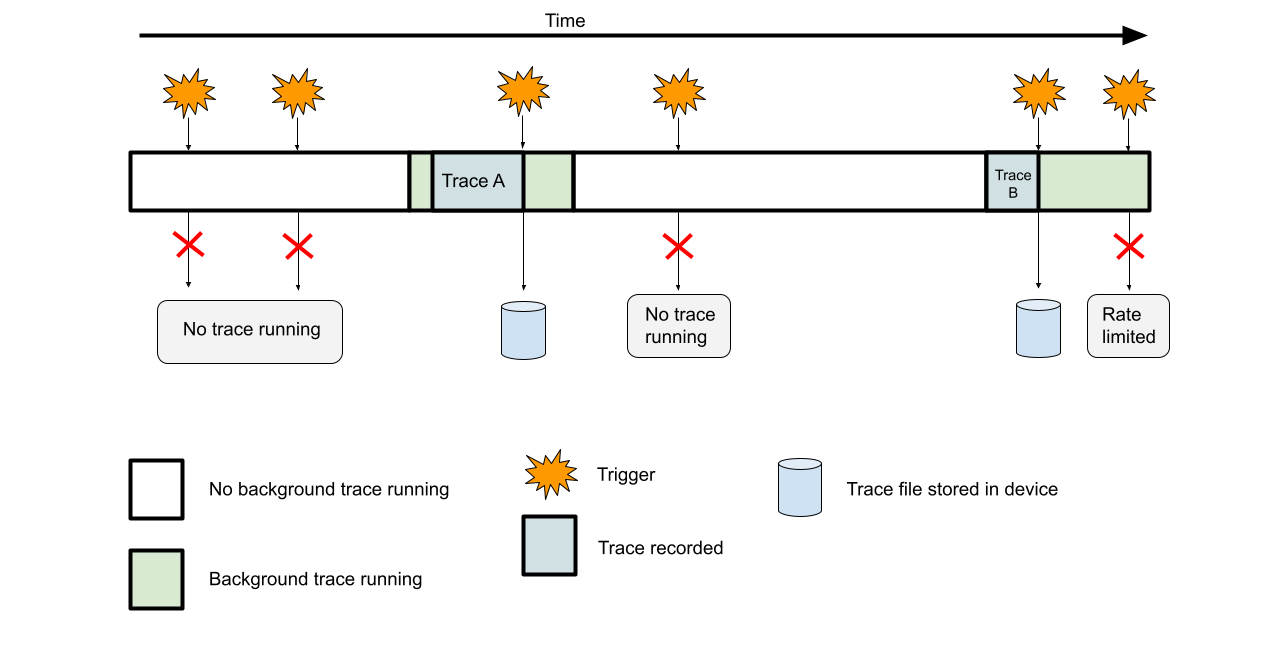
Many triggers—such as an ANR—are the consequence of an earlier issue. Starting a trace only after the system detects the ANR misses the blocking work that caused it. To capture the activity leading up to the event, the following triggers save a snapshot of the system's active background trace. If no background trace is running when the event occurs, no profile is collected:
TRIGGER_TYPE_ANR(API level 36)TRIGGER_TYPE_APP_FULLY_DRAWN(API level 36)TRIGGER_TYPE_APP_REQUEST_RUNNING_TRACE(API level 36.1)TRIGGER_TYPE_KILL_FORCE_STOP(API level 36.1)TRIGGER_TYPE_KILL_RECENTS(API level 36.1)TRIGGER_TYPE_KILL_TASK_MANAGER(API level 36.1)TRIGGER_TYPE_KILL_EXCESSIVE_CPU_USAGE(API level 37)
Triggers that start a new capture
The following triggers don't depend on the background trace. Instead, the system starts a new profile capture when the event occurs:
TRIGGER_TYPE_COLD_START(API level 37)TRIGGER_TYPE_OOM(API level 37)
Triggers where capture behavior varies by anomaly
For the following anomaly triggers, the captured profile type (saving a snapshot of the active background trace or starting a new capture) and rate limiting behavior depend on the specific anomaly detected by the system:
TRIGGER_TYPE_ANOMALY(API level 37)TRIGGER_TYPE_APP_COMPAT(API level 37)
Set up a trigger
The following code demonstrates how to register for the
TRIGGER_TYPE_APP_FULLY_DRAWN trigger and set a cooldown period on it.
Kotlin
@RequiresApi(Build.VERSION_CODES.BAKLAVA) fun recordWithTrigger() { val profilingManager = applicationContext.getSystemService(ProfilingManager::class.java) ?: return val triggers = ArrayList<ProfilingTrigger>() val triggerBuilder = ProfilingTrigger.Builder(ProfilingTrigger.TRIGGER_TYPE_APP_FULLY_DRAWN) .setRateLimitingPeriodHours(1) triggers.add(triggerBuilder.build()) val callbackExecutor: Executor = Executors.newSingleThreadExecutor() val resultCallback = Consumer<ProfilingResult> { profilingResult -> if (profilingResult.errorCode == ProfilingResult.ERROR_NONE) { Log.d( "ProfileTest", "Received profiling result file=" + profilingResult.resultFilePath ) setupProfileUploadWorker(profilingResult.resultFilePath) } else { Log.e( "ProfileTest", "Profiling failed errorcode=" + profilingResult.errorCode + " errormsg=" + profilingResult.errorMessage ) } } profilingManager.registerForAllProfilingResults(callbackExecutor, resultCallback) profilingManager.addProfilingTriggers(triggers) Choreographer.getInstance().postFrameCallback { frameTimeNanos -> // This will cause the TRIGGER_TYPE_APP_FULLY_DRAWN to be emitted. reportFullyDrawn() } }
Java
public void recordWithTrigger() { ProfilingManager profilingManager = getApplicationContext().getSystemService( ProfilingManager.class); List<ProfilingTrigger> triggers = new ArrayList<>(); ProfilingTrigger.Builder triggerBuilder = new ProfilingTrigger.Builder( ProfilingTrigger.TRIGGER_TYPE_APP_FULLY_DRAWN); triggerBuilder.setRateLimitingPeriodHours(1); triggers.add(triggerBuilder.build()); Executor callbackExecutor = Executors.newSingleThreadExecutor(); Consumer<ProfilingResult> resultCallback = new Consumer<ProfilingResult>() { @Override public void accept(ProfilingResult profilingResult) { if (profilingResult.getErrorCode() == ProfilingResult.ERROR_NONE) { Log.d( "ProfileTest", "Received profiling result file=" + profilingResult.getResultFilePath()); setupProfileUploadWorker(profilingResult.getResultFilePath()); } else { Log.e( "ProfileTest", "Profiling failed errorcode=" + profilingResult.getErrorCode() + " errormsg=" + profilingResult.getErrorMessage()); } } }; profilingManager.registerForAllProfilingResults(callbackExecutor, resultCallback); profilingManager.addProfilingTriggers(triggers); Choreographer.getInstance().postFrameCallback((f) -> { // This will cause the TRIGGER_TYPE_APP_FULLY_DRAWN to be emitted. reportFullyDrawn(); }); }
The code performs these steps:
- Get the manager: Retrieves the
ProfilingManagerservice. - Define a trigger: Builds a
ProfilingTriggerforTRIGGER_TYPE_APP_FULLY_DRAWN. This event occurs when the app callsreportFullyDrawn()during an activity-initiated cold start to report that it has finished startup and is interactive. - Set a trigger cooldown: Applies a 1-hour cooldown period to this
specific trigger using
setRateLimitingPeriodHoursin addition to the system rate limiter. This cooldown prevents the app from recording more than one startup profile per hour. - Register listener: Calls
registerForAllProfilingResultsto define the callback that handles the result. This callback receives the path of the saved profile throughgetResultFilePath(). - Add triggers: Registers the trigger list with
ProfilingManagerusingaddProfilingTriggers. - Fire event: Posts a
Choreographerframe callback that callsreportFullyDrawn()once the next frame is drawn, which emits theTRIGGER_TYPE_APP_FULLY_DRAWNevent to the system, triggering a profile collection assuming a system background trace was running and rate limiter quota is available. For this trigger to occur, make sure your app callsreportFullyDrawn().
Trigger lifecycle
Registered triggers persist across app restarts and system reboots. You don't
need to re-register triggers every time your app starts or after a system
reboot—once you register triggers using addProfilingTriggers, the
system maintains them automatically for your app until you remove them or the
app is uninstalled.
When to unregister triggers
Because registered triggers persist across app restarts and system reboots,
skipping addProfilingTriggers on subsequent launches doesn't stop triggers
registered in a previous session. To stop capturing profiles for specific events
or for all events, explicitly call removeProfilingTriggersByType or
clearProfilingTriggers.
Unregister triggers in the following situations:
- Targeting cohorts or rolling back remote flags: You might segment profiling across cohorts using remote configuration or A/B testing flags. Whenever a device leaves the sampled cohort or a flag turns off, unregister the triggers.
- Finishing a debugging campaign: Once you collect enough profiles to diagnose an issue or ship a fix, remove the trigger. Unregistering unneeded triggers preserves device storage and your app's rate limiter quota for other profiling requests.
Callback lifecycle
Unlike direct profiling requests, trigger-based profiles only deliver results to
a global listener registered with registerForAllProfilingResults. In
your callback, call ProfilingResult.getTriggerType to identify which
trigger initiated the capture, and call
ProfilingResult.getResultFilePath to locate the saved profile file. For
details on trigger profile filenames, pulling files with adb, and uploading
results in the background, see Retrieve and upload profiles.
Although triggers persist across app restarts and system reboots, your result
callback doesn't. Register your callback on a background Executor after app
startup completes (so you don't slow down cold start) to receive profiles in
both of the following scenarios:
- While your app is running: For triggers that don't stop or crash your
app, the system invokes your callback on the provided
Executorwhen the trigger occurs and the profile is saved. After app termination: For triggers that often involve or precede app termination (such as
TRIGGER_TYPE_ANR,TRIGGER_TYPE_OOM, orTRIGGER_TYPE_KILL_RECENTS), or if your app stops before capture finishes, the system saves the profile in the background and queues the result across app restarts and system reboots. The system retains undelivered queued results for up to 7 days and delivers them the next time your app runs and callsregisterForAllProfilingResults.
How background tracing works
To balance profiling overhead with capturing useful artifacts, the system doesn't run background traces continuously. Instead, it samples periodically by starting background traces at random intervals.
System-triggered background traces use a ring buffer with a system-defined maximum size. When the buffer fills up, new trace data overwrites the oldest data. As shown in Figure 1, when a registered trigger fires while a background trace is active and rate-limiter quota is available, the system saves the ring buffer snapshot containing the most recent activity leading up to the trigger.
Set a trigger-specific cooldown
High-frequency triggers can quickly consume your app's rate limiter quota.
To prevent a single trigger type from exhausting your quota, use
setRateLimitingPeriodHours to add a per-trigger minimum cooldown period
on top of the system rate limiter.
Debug triggers locally
Because background traces run at random intervals in production, testing
triggers locally requires forcing a continuous background trace and bypassing
the system-level rate limiter for your package (any per-trigger cooldown set
with setRateLimitingPeriodHours still applies, and
rate_limiter.disabled applies only to app-driven requestProfiling
calls).
For the adb commands to force background traces, simulate triggers from the
command line, and inspect service state, see Force-enable background traces for
trigger testing in Debug commands for local profiling.