
This page describes how to retrieve traces and visualize them in the Perfetto UI.
Retrieve traces
After a profile is recorded, traces are saved on your device. Before you can analyze these traces, you have to retrieve them.
Trace locations are provided by ProfilingResult.getResultFilePath(). To
learn how to get the trace location, see How to capture a profile. Once you
have the location of your trace, you can upload the trace to a server.
Local Testing: Retrieve traces using ADB
Using adb to get traces is helpful for checking performance and debugging
locally.
Redacted traces are saved in your device's files. A typical path for a saved profile is:
/data/user/0/<app>/files/profiling/profile_<tag>_<datetime>.perfetto-trace
Where:
<app>is the app name.<datetime>is the date and time the trace was taken.<tag>is the user-provided tag configured usingsetTag
If unredacted traces are enabled and saved, use the following adb command to
pull them from the device:
adb pull
/data/misc/perfetto-traces/profiling/<trace-name>.perfetto-trace-unredacted
Visualize traces
After retrieving your trace to your computer, you can then view it in the Perfetto UI.
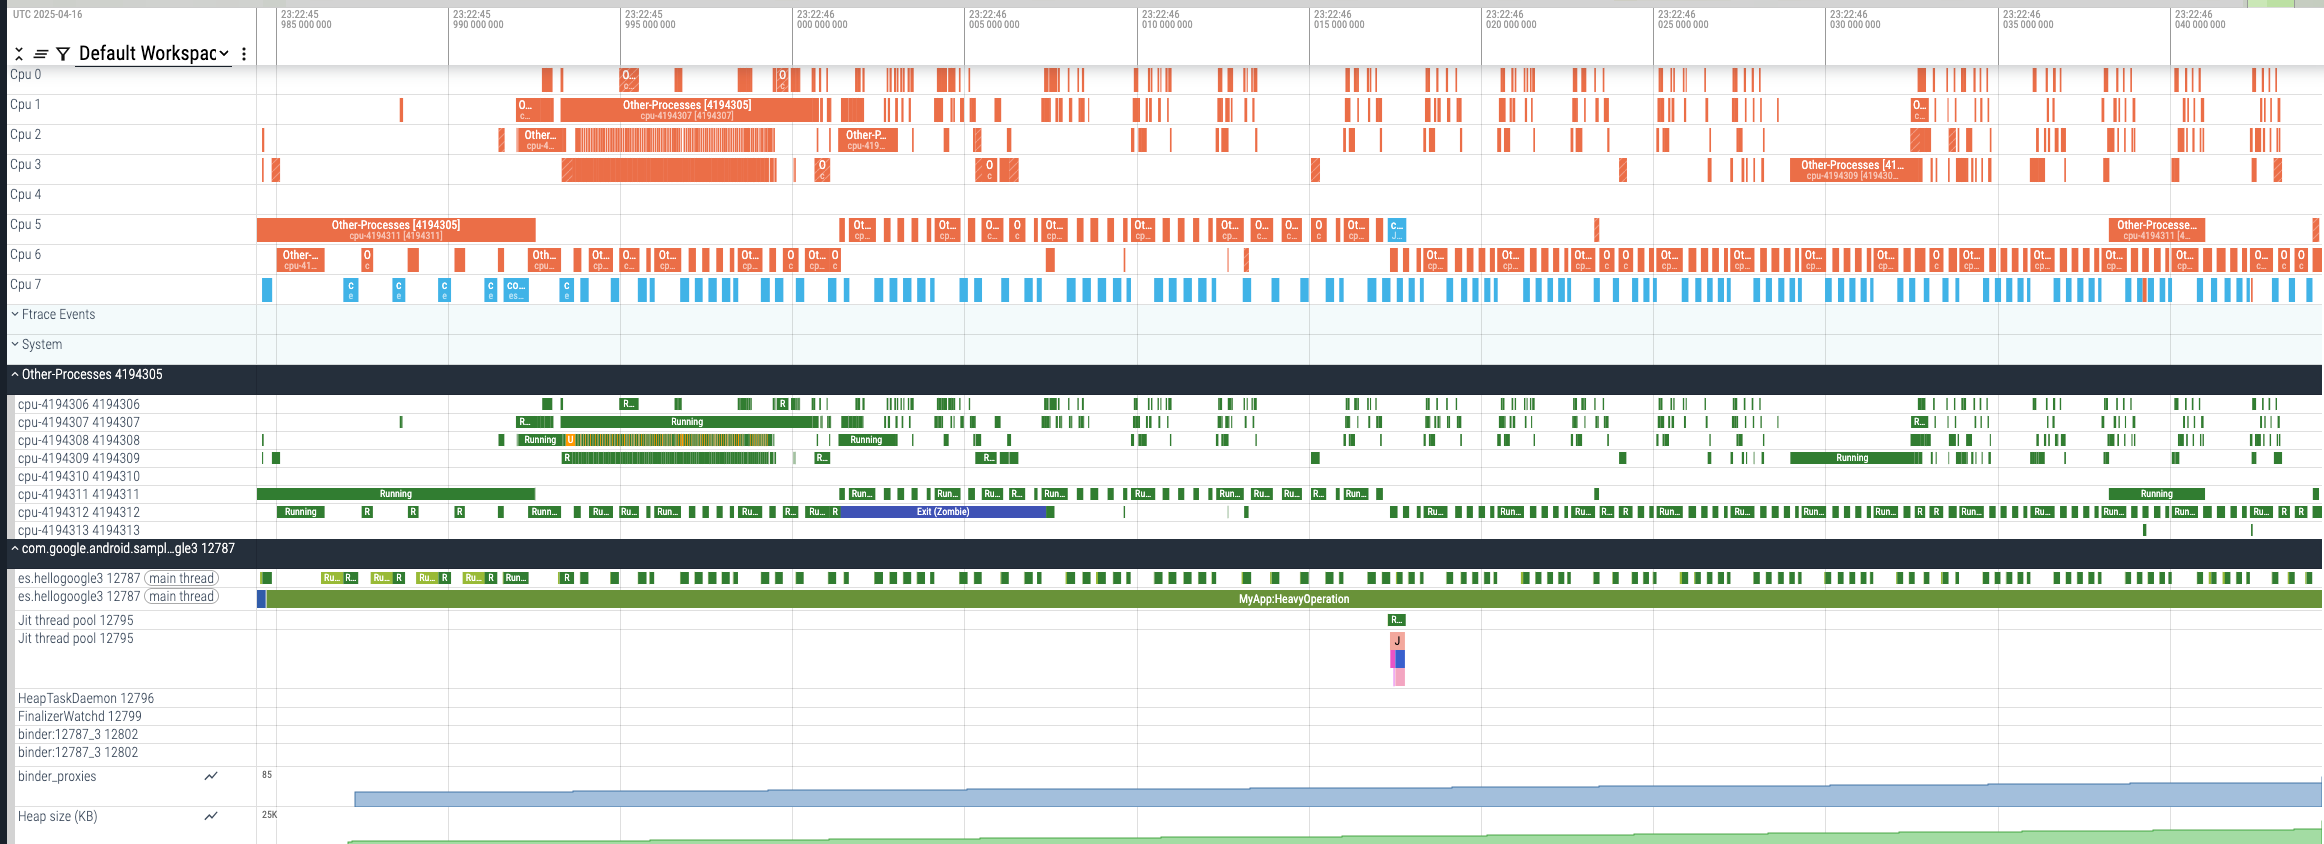
In a redacted trace, the OtherProcesses section combines all CPU activity from
other processes. Combining processes keeps what those other processes were doing
private.
However, seeing this combined CPU activity still lets you check if the system was overloaded during your recording. Checking the system activity helps you figure out if your app was slow because of an internal issue or because the system was generally slow.
The following image highlights and briefly describes the main parts you will see in the trace:
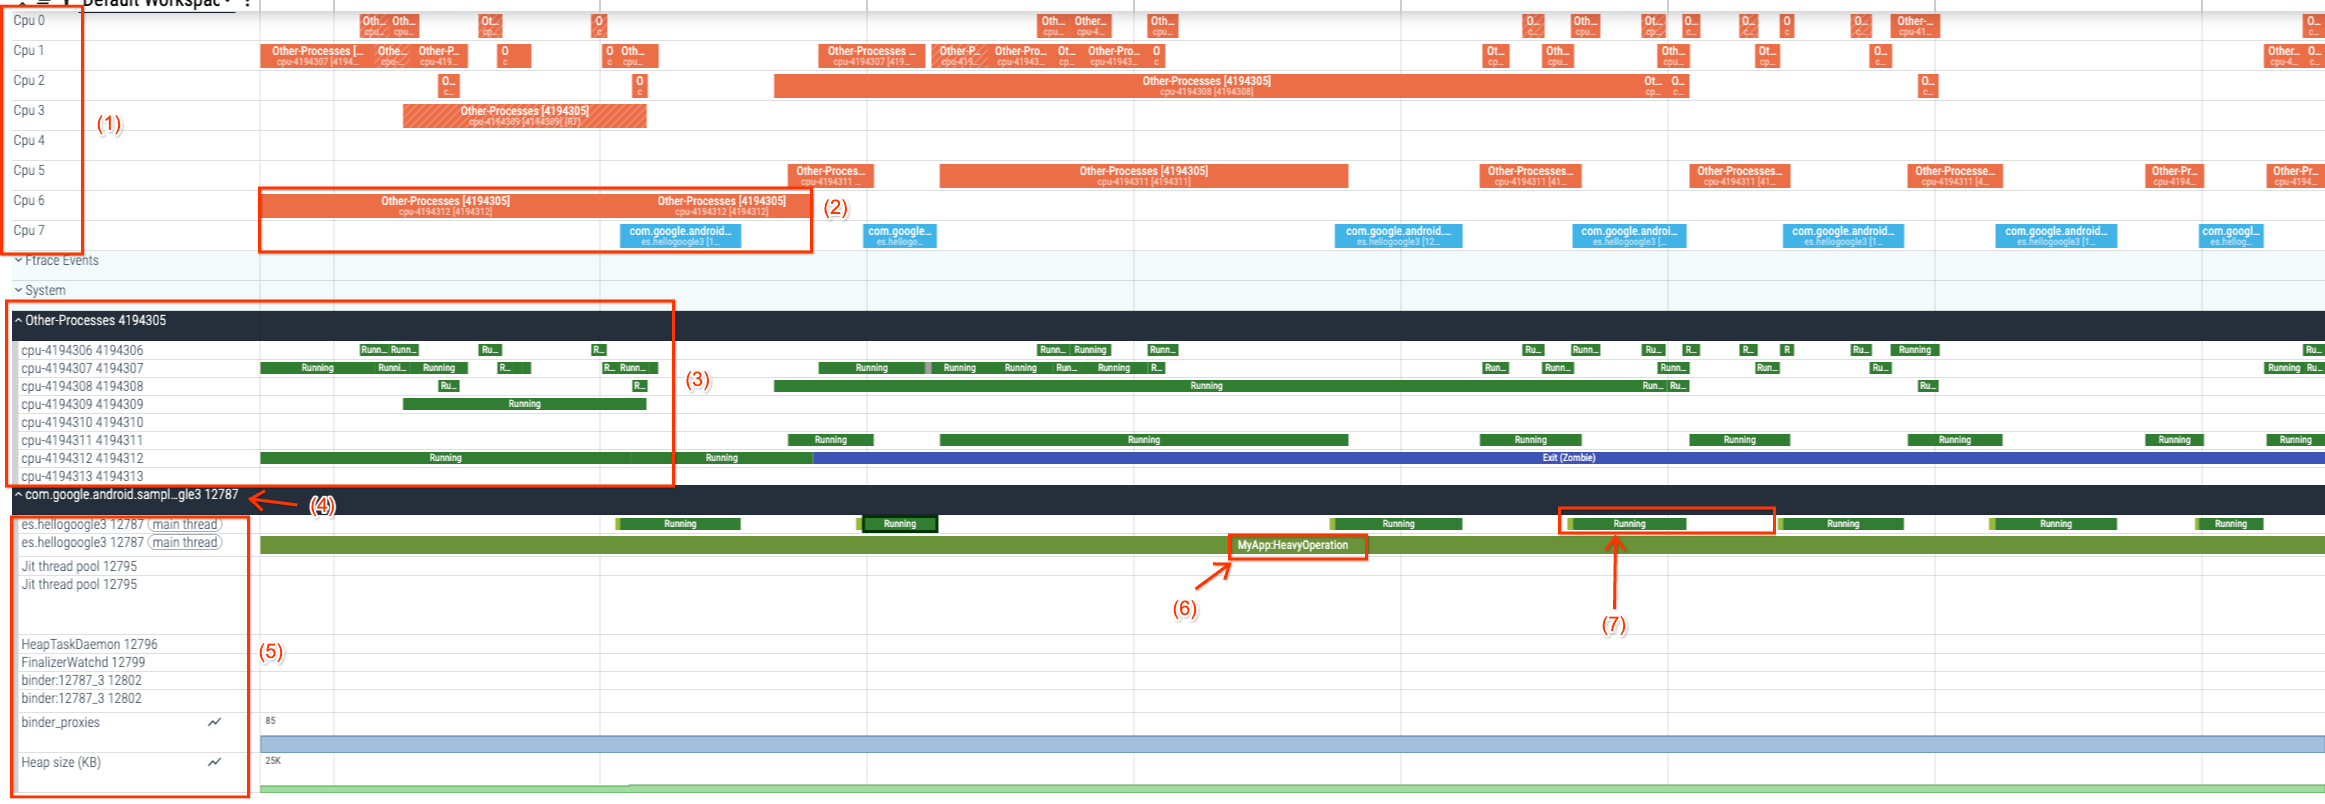
- CPU list: Displays all available processors on your device.
- CPU tasks: Shows which threads each CPU was executing.
- Other processes view: Displays CPU resources consumed by other processes.
- Process View: Shows your app's process.
- Threads View: Displays threads running within your process and their thread states (Runnable (R), Running (R), Sleeping (S), Uninterruptible Sleep (D)), which map directly to Linux Process States.
- Trace slices: This section shows trace annotations added by app
developers or the framework. These annotations encompass computations
between
Trace.beginSectionandTrace.endSection.
For more information on Perfetto UI and trace visualization, see the Perfetto docs.