
Use the Macrobenchmark library for testing larger use cases of your app,
including app startup and complex UI manipulations, such as scrolling a
RecyclerView or running animations. If you want to test smaller areas of
your code, refer to Microbenchmark library. This page shows how to set up
the Macrobenchmark library.
The library outputs benchmarking results to both the Android Studio console and a JSON file with more detail. It also provides trace files that you can load and analyze in Android Studio.
Use the Macrobenchmark library in a continuous integration (CI) environment, as described in Benchmark in Continuous Integration.
You can use Macrobenchmark to generate Baseline Profiles. First, set up the Macrobenchmark library, then you can create a Baseline Profile.
Project setup
We recommend you use Macrobenchmark with the latest version of Android Studio for features of the IDE that integrate with Macrobenchmark.
Setup the Macrobenchmark module
Macrobenchmarks require a
com.android.test
module—separate from your app code—that is responsible for running the tests
that measure your app.
In Android Studio, a template is available to simplify Macrobenchmark module setup. The benchmarking module template automatically creates a module in your project for measuring the app built by an app module, including a sample startup benchmark.
To use the module template to create a new module, do the following:
Right-click your project or module in the Project panel in Android Studio, and select New > Module.
Select Benchmark from the Templates pane. You can customize the target app—meaning, the app to be benchmarked—as well as package and module name for the new Macrobenchmark module.
Click Finish.
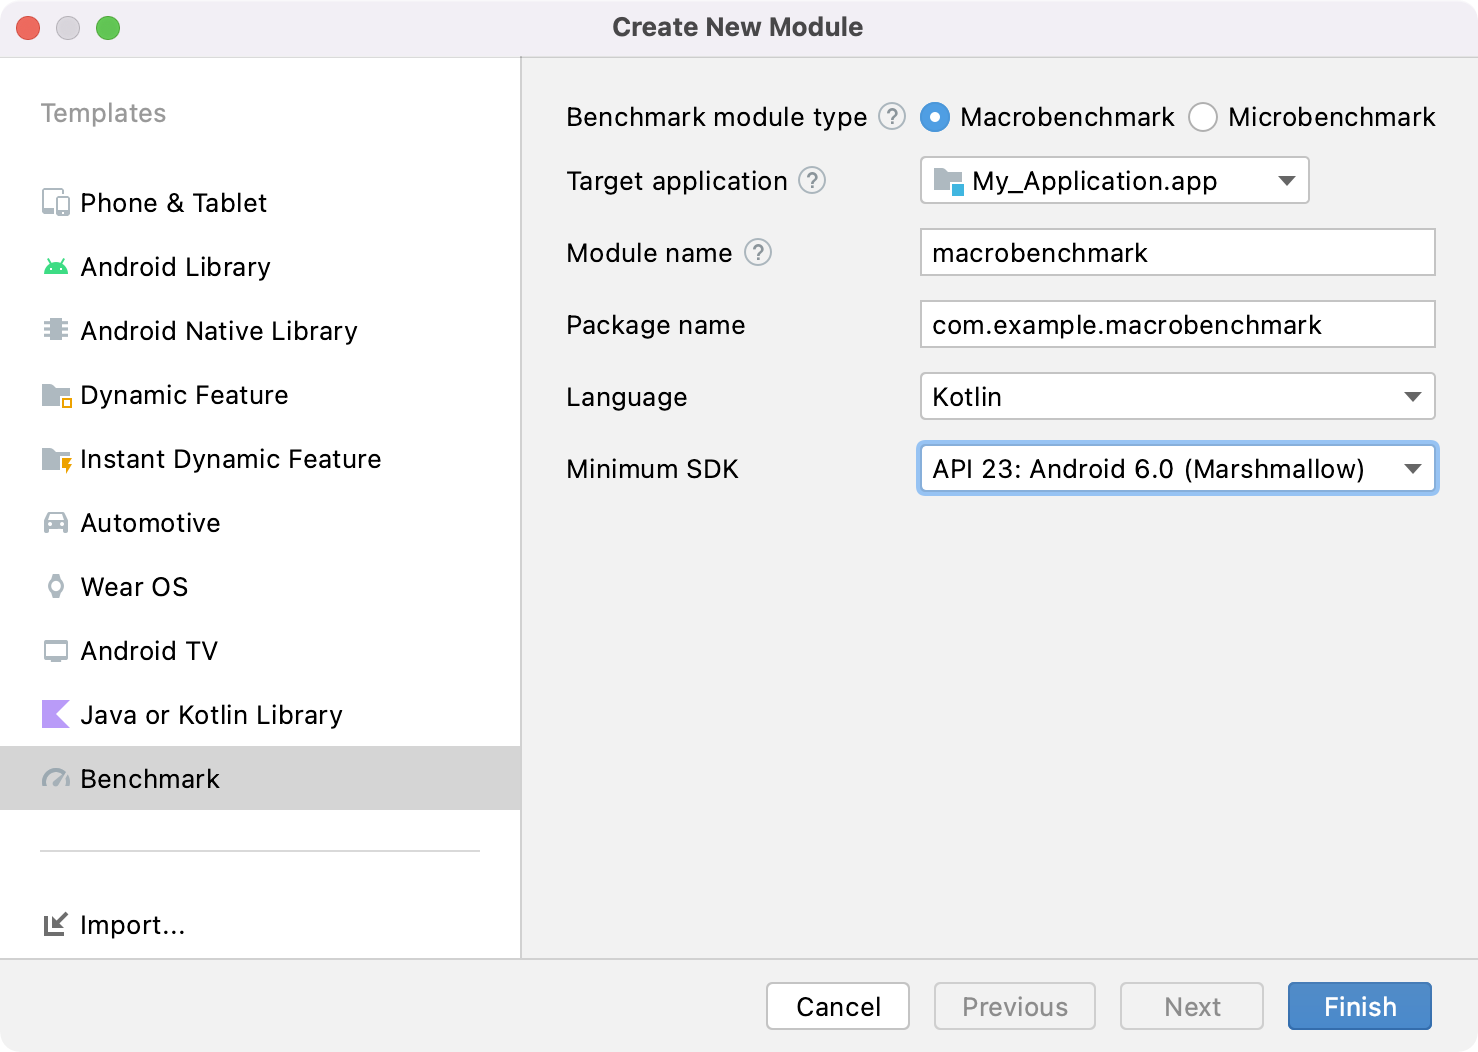
Figure 1. Benchmark module template.
Set up the app
To benchmark an app—known as the target of the Macrobenchmark—the app must be
profileable, which enables reading detailed trace information without
affecting performance. The module wizard adds the <profileable> tag
automatically to the app's AndroidManifest.xml file.
Make sure that the target app includes
ProfilerInstaller 1.3 or
higher, which the Macrobenchmark library needs to enable profile capture and
reset and shader cache clearing.
Configure the benchmarked app as close to the release version or production as
possible. Set it up as non-debuggable and preferably with minification on, which
improves performance. You typically do this by creating a copy of the release
variant, which performs the same, but is signed locally with debug keys.
Alternatively, you can use initWith to instruct Gradle to do it for you:
Kotlin
buildTypes {
    getByName("release") {
        isMinifyEnabled = true
        isShrinkResources = true
        proguardFiles(getDefaultProguardFile("proguard-android-optimize.txt"))
    }

    create("benchmark") {
        initWith(getByName("release"))
        signingConfig = signingConfigs.getByName("debug")
    }
}
Groovy
buildTypes { release { isMinifyEnabled = true isShrinkResources = true proguardFiles( getDefaultProguardFile("proguard-android-optimize.txt"), "keep-rules.pro" ) // In real app, this would use its own release keystore signingConfig = signingConfigs.getByName("debug") baselineProfile.automaticGenerationDuringBuild = true } }
To help ensure that running the benchmark both builds and tests the correct variant of your app, as shown in figure 2, do the following:
- Perform a Gradle sync.
- Open the Build Variants panel.
- Select the benchmark variant of both the app and the Macrobenchmark module.
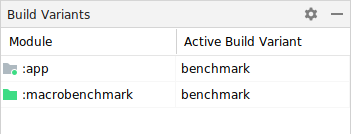
Figure 2. Select the benchmark variant.
(Optional) Set up multi-module app
If your app has more than one Gradle module, make sure your build scripts know
which build variant to compile. AddmatchingFallbacks property into the
benchmark build type of your :macrobenchmark and :app modules. The rest of
your Gradle modules can have the same configuration as before.
Kotlin
create("benchmark") {
    initWith(getByName("release"))
    signingConfig = signingConfigs.getByName("debug")

    matchingFallbacks += listOf("release")
 }
Groovy
benchmark {
    initWith buildTypes.release
    signingConfig signingConfigs.debug

    matchingFallbacks = ['release']
 }
Without this, the newly added benchmark build type causes the build to fail
and provides the following error message:
> Could not resolve project :shared.
     Required by:
         project :app
      > No matching variant of project :shared was found.
      ...
When selecting the build variants in your project, choose benchmark for :app
and :macrobenchmark modules, and release for any other modules you have in
your app, as shown in figure 3:
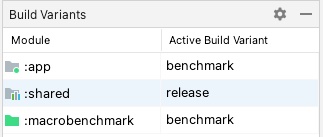
Figure 3. Benchmark variants for multi-module project with release and benchmark build types selected.
For more information, see Use variant-aware dependency management.
(Optional) Set up product flavors
If you have multiple product flavors set in your app, configure the
:macrobenchmark module, so that it knows what product flavor of your app to
build and benchmark.
The examples in this page are using the two product flavors in the :app
module: demo and production, as shown in the following snippet:
Kotlin
flavorDimensions += "environment"
productFlavors {
    create("demo") {
        dimension = "environment"
        // ...
    }
    create("production") {
        dimension = "environment"
        // ...
    }
}
Groovy
flavorDimensions 'environment'
productFlavors {
    demo {
        dimension 'environment'
        // ...
    }

    production {
        dimension 'environment'
        // ...
    }
}
Without this configuration, you might get a build error similar to with multiple Gradle modules:
Could not determine the dependencies of task ':macrobenchmark:connectedBenchmarkAndroidTest'.
> Could not determine the dependencies of null.
   > Could not resolve all task dependencies for configuration ':macrobenchmark:benchmarkTestedApks'.
      > Could not resolve project :app.
        Required by:
            project :macrobenchmark
         > The consumer was configured to find a runtime of a component, as well as attribute 'com.android.build.api.attributes.BuildTypeAttr' with value 'benchmark', attribute 'com.android.build.api.attributes.AgpVersionAttr' with value '7.3.0'. However we cannot choose between the following variants of project :app:
             -   demoBenchmarkRuntimeElements
             -   productionBenchmarkRuntimeElements
           All of them match the consumer attributes:
           ...
The two following sections are ways to configure benchmarking with multiple product flavors.
Use missingDimensionStrategy
Specifying missingDimensionStrategy in the defaultConfig of the
:macrobenchmark module tells the build system to fallback to the flavor
dimension. Specify which dimensions to use if you don't find them in the module.
In the following example, the production flavor is used as the default
dimension:
Kotlin
defaultConfig {
    missingDimensionStrategy("environment", "production")
}
Groovy
defaultConfig {
    missingDimensionStrategy "environment", "production"
}
This way, the :macrobenchmark module is able to only build and benchmark the
specified product flavor, which is helpful if you know that only one product
flavor has the proper configuration to be benchmarked.
Define product flavors in the :macrobenchmark module
If you want to build and benchmark other product flavors, define them in the
:macrobenchmark module. Specify it similarly as in the :app module, but only
assign productFlavors to a dimension. No other settings are required:
Kotlin
flavorDimensions += "environment"
productFlavors {
    create("demo") {
        dimension = "environment"
    }
    create("production") {
        dimension = "environment"
    }
}
Groovy
flavorDimensions 'environment'
productFlavors {
    demo {
        dimension 'environment'
    }

    production {
        dimension 'environment'
    }
}
After defining and syncing the project, choose the relevant build variant from the Build Variants pane, as shown in figure 4:
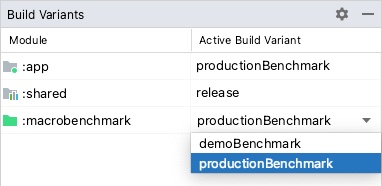
Figure 4. Benchmark variants for the project with product flavors showing "productionBenchmark" and "release" selected.
For more information, see Resolve build errors related to variant matching.
Create a macrobenchmark class
Benchmark testing is provided through the MacrobenchmarkRule JUnit4 rule
API in the Macrobenchmark library. It contains a measureRepeated method
that lets you specify various conditions on how to run and benchmark the target
app.
You need to at least specify the packageName of the target app, what metrics
you want to measure and how many iterations the benchmark must run.
Kotlin
@LargeTest @RunWith(AndroidJUnit4::class) class SampleStartupBenchmark { @get:Rule val benchmarkRule = MacrobenchmarkRule() @Test fun startup() = benchmarkRule.measureRepeated( packageName = TARGET_PACKAGE, metrics = listOf(StartupTimingMetric()), iterations = DEFAULT_ITERATIONS, ) { // starts default launch activity uiAutomator { startApp(TARGET_PACKAGE) } } }
Java
@LargeTest
@RunWith(AndroidJUnit4.class)
public class SampleStartupBenchmark {
    @Rule
    public MacrobenchmarkRule benchmarkRule = new MacrobenchmarkRule();

    @Test
    public void startup() {
        benchmarkRule.measureRepeated(
            /* packageName */ TARGET_PACKAGE,
            /* metrics */ Arrays.asList(new StartupTimingMetric()),
            /* iterations */ 5,
            /* measureBlock */ scope -> {
                // starts default launch activity
                scope.startActivityAndWait();
                return Unit.INSTANCE;
            }
        );
    }
}
For all the options on customizing your benchmark, see Customize the benchmarks section.
Run the benchmark
Run the test from within Android Studio to measure the performance of your app
on your device. You can run the benchmarks the same way you run any other
@Test using the gutter action next to your test class or method, as shown in
the figure 5.
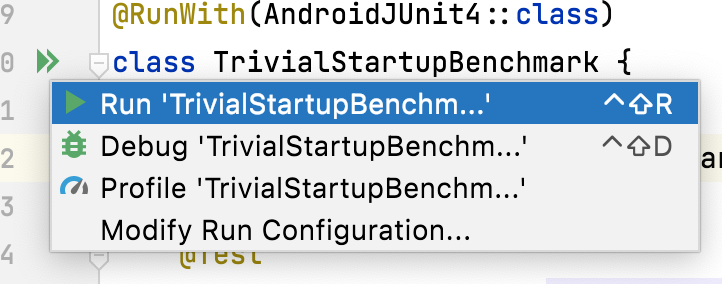
Figure 5. Run Macrobenchmark with gutter action next to the test class.
You can also run all benchmarks in a Gradle module from the command line by
executing the connectedCheck command:
./gradlew :macrobenchmark:connectedCheckYou can run a single test by executing the following:
./gradlew :macrobenchmark:connectedCheck -P android.testInstrumentationRunnerArguments.class=com.example.macrobenchmark.startup.SampleStartupBenchmark#startupSee Benchmark in Continuous Integration for information on how to run and monitor benchmarks in continuous integration.
Benchmark results
After a successful benchmark run, metrics are displayed directly in Android Studio and are output for CI usage in a JSON file. Each measured iteration captures a separate system trace. You can open these trace results by clicking on the links in the Test Results pane, as shown in the figure 6:
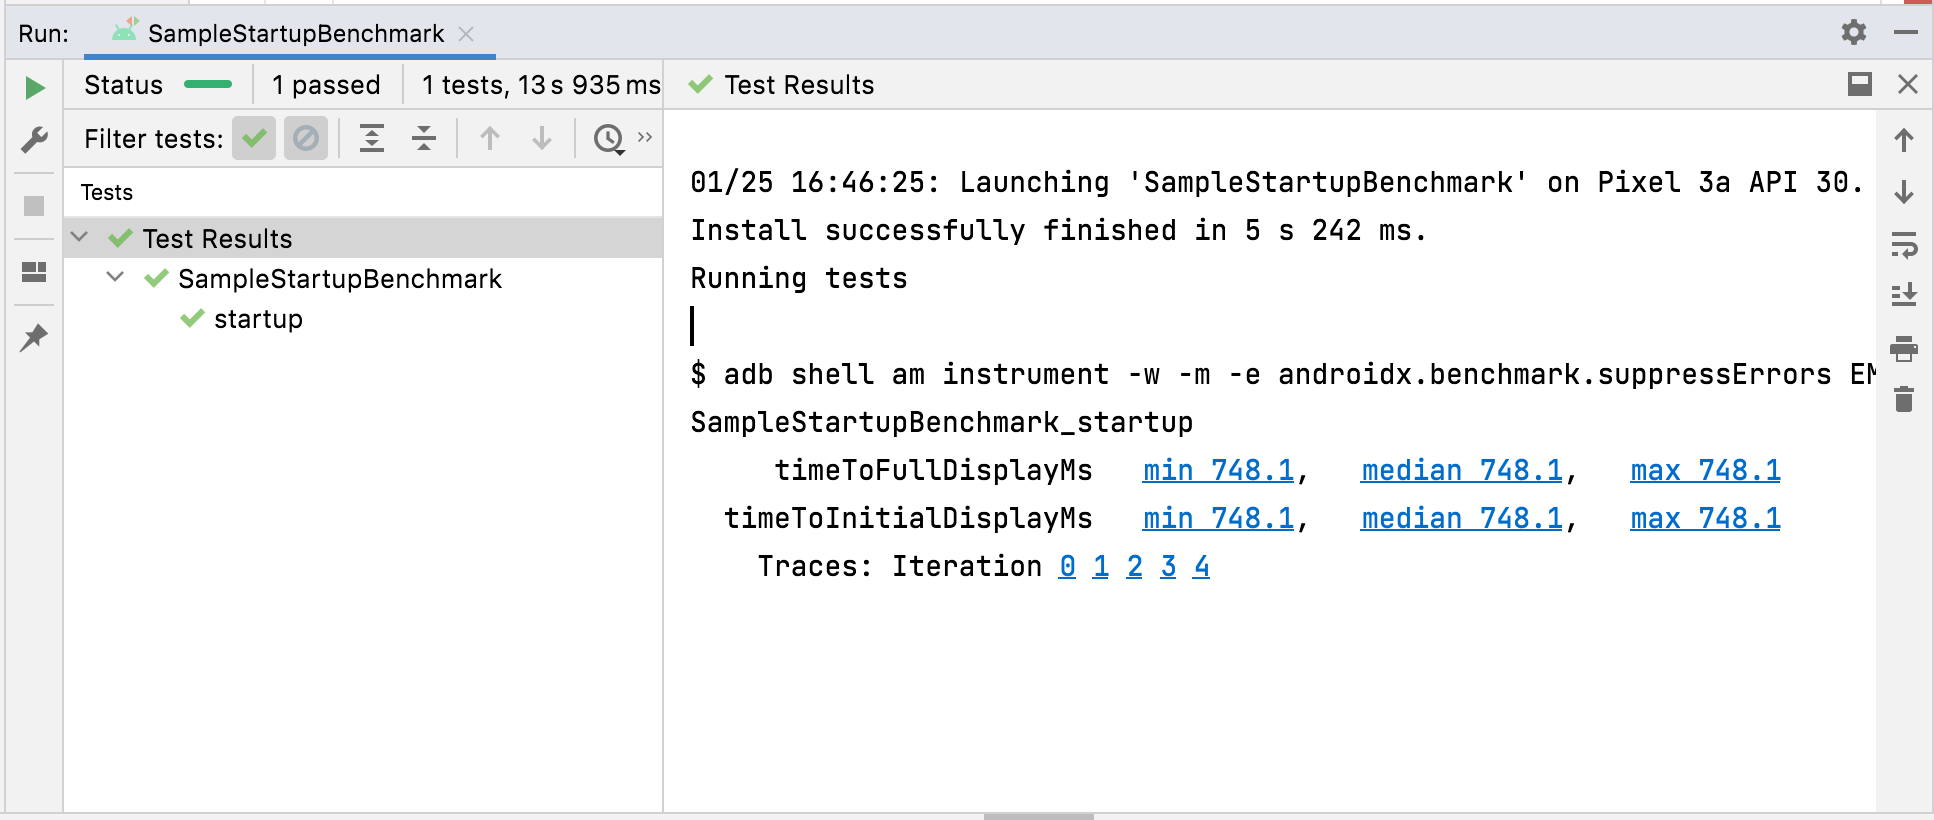
Figure 6. Macrobenchmark startup results.
When the trace is loaded, Android Studio prompts you to select the process to analyze. The selection is pre-populated with the target app process, as shown in figure 7:
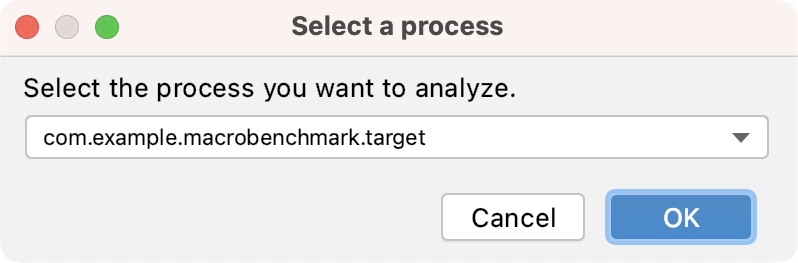
Figure 7. Studio trace process selection.
After the trace file is loaded, Studio shows the results in the CPU profiler tool:
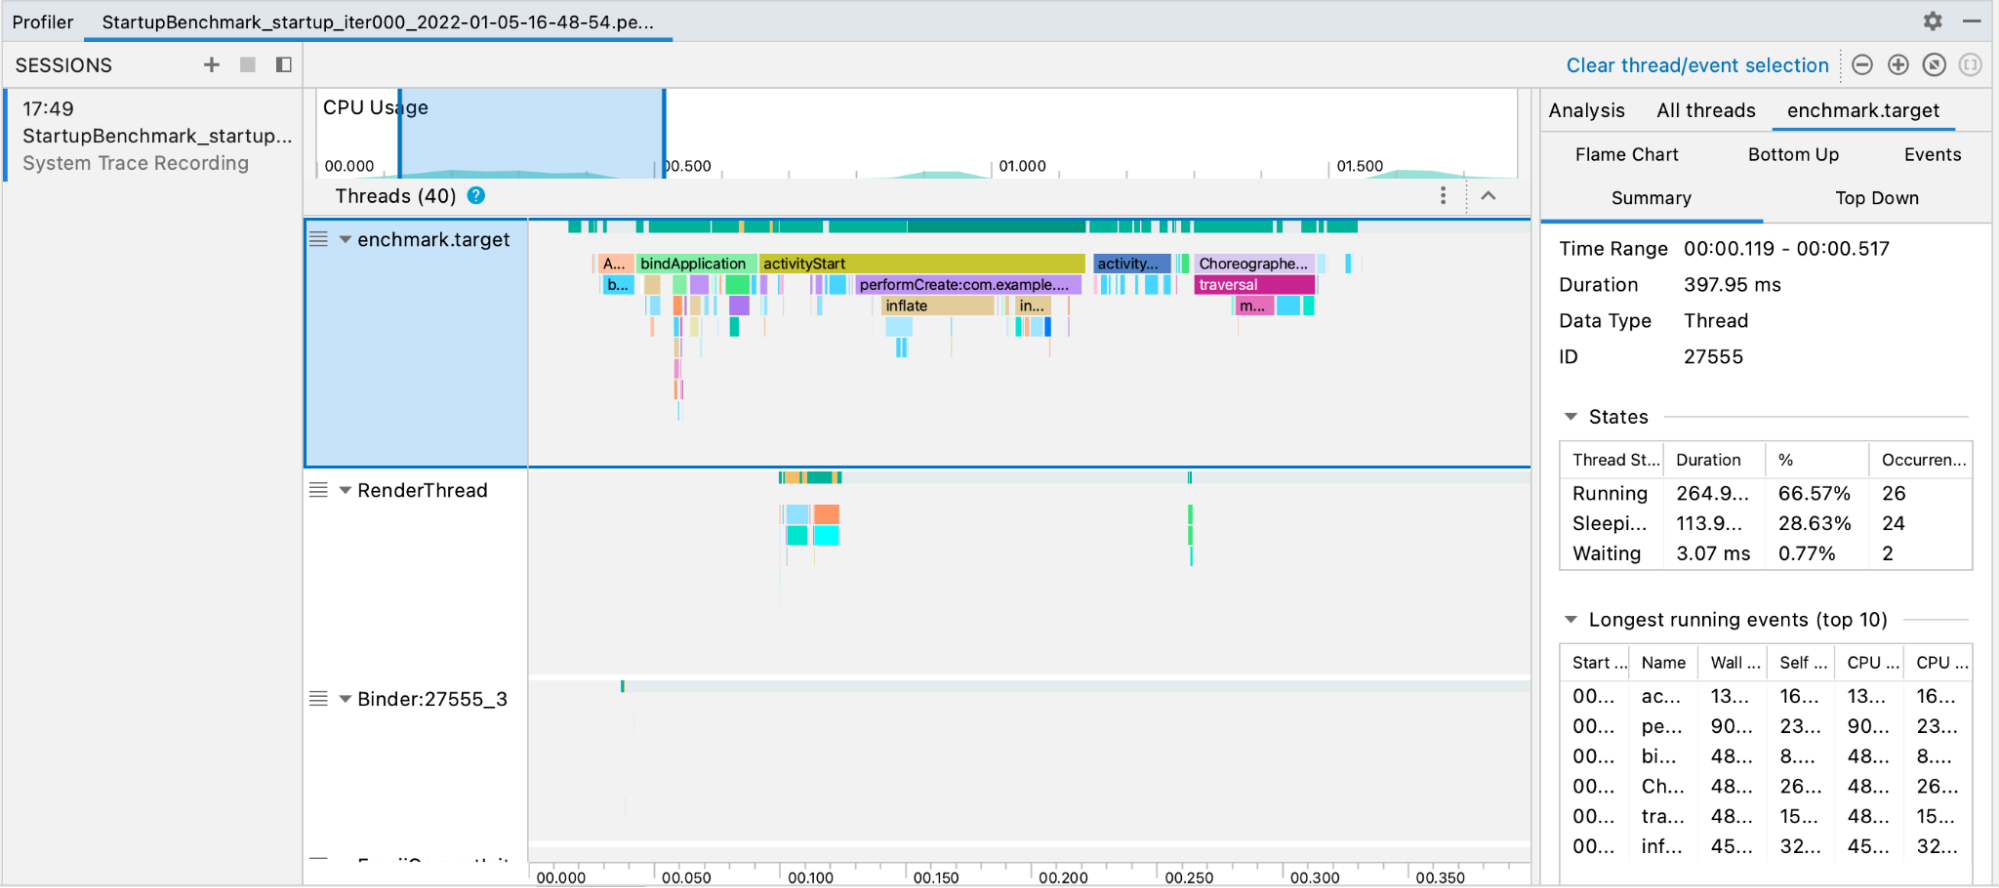
Figure 8. Studio trace.
JSON reports and any profiling traces are also automatically copied from the device to the host. These are written on the host machine in the following location:
project_root/module/build/outputs/connected_android_test_additional_output/debugAndroidTest/connected/device_id/
Access trace files manually
If you want to use the Perfetto tool to analyze a trace file, there are extra steps involved. Perfetto lets you inspect all processes happening across the device during the trace, while Android Studio's CPU profiler limits inspection to a single process.
If you invoke the tests from Android Studio or from the Gradle command line, the trace files are automatically copied from the device to the host. These are written on the host machine in the following location:
project_root/module/build/outputs/connected_android_test_additional_output/debugAndroidTest/connected/device_id/TrivialStartupBenchmark_startup[mode=COLD]_iter002.perfetto-trace
When you have the trace file in your host system, you can open it in Android Studio with File > Open in the menu. This shows the profiler tool view shown in the previous section.
Configuration errors
If the app is misconfigured—debuggable or non-profileable—Macrobenchmark returns
an error rather than reporting an incorrect or incomplete measurement. You can
suppress these errors with the androidx.benchmark.suppressErrors
argument.
Macrobenchmark also returns errors when attempting to measure an emulator or on a low-battery device, which might compromise core availability and clock speed.
Customize the benchmarks
The measureRepeated function accepts various parameters that influence
which metrics the library collects, how your app is started and compiled, or how
many iterations the benchmark runs.
Capture the metrics
Metrics are the main type of information extracted from your benchmarks. The following metrics are available:
For more information about metrics, see Capture Macrobenchmark metrics.
Improve trace data with custom events
It can be useful to instrument your app with custom trace events, which are seen with the rest of the trace report and can help point out problems specific to your app. To learn more about creating custom trace events, see Define custom events.
CompilationMode
Macrobenchmarks can specify a CompilationMode, which defines how much of
the app must be pre-compiled from DEX bytecode (the bytecode format within an
APK) to machine code (similar to pre-compiled C++).
By default, Macrobenchmarks are run with CompilationMode.DEFAULT, which
installs a Baseline Profile—if available—on Android 7 (API level 24) and later.
If you are using Android 6 (API level 23) or earlier, the compilation mode fully
compiles the APK as default system behavior.
You can install a Baseline Profile if the target app contains both a Baseline
Profile and the ProfileInstaller library.
On Android 7 and later, you can customize the CompilationMode to affect the
amount of on-device pre-compilation to mimic different levels of ahead-of-time
(AOT) compilation or JIT caching. See CompilationMode.Full,
CompilationMode.Partial, CompilationMode.None, and
CompilationMode.Ignore.
This feature is built on ART compilation commands. Each benchmark clears profile data before it starts, to help ensure non-interference between benchmarks.
StartupMode
To perform an activity start, you can pass a predefined startup mode:
COLD, WARM, or HOT. This parameter changes how the
activity launches and the process state at the start of the test.
To learn more about the types of startup, see App startup time.
Samples
A sample project is available in the Macrobenchmark Sample of the repository on GitHub.
Provide feedback
To report issues or submit feature requests for Jetpack Macrobenchmark, see the public issue tracker.
Recommended for you
- Note: link text is displayed when JavaScript is off
- Capture Macrobenchmark metrics
- Create Baseline Profiles {:#creating-profile-rules}
- Automate measurement with the Macrobenchmark library {:#measuring-optimization}