
You can record several types of performance profiles in Android. Collecting a profile helps you debug issues related to how fast your app runs, how much memory it uses, how much power it consumes, and more.
This document describes the most useful types of profiles and when to use each to debug common performance issues.
System traces
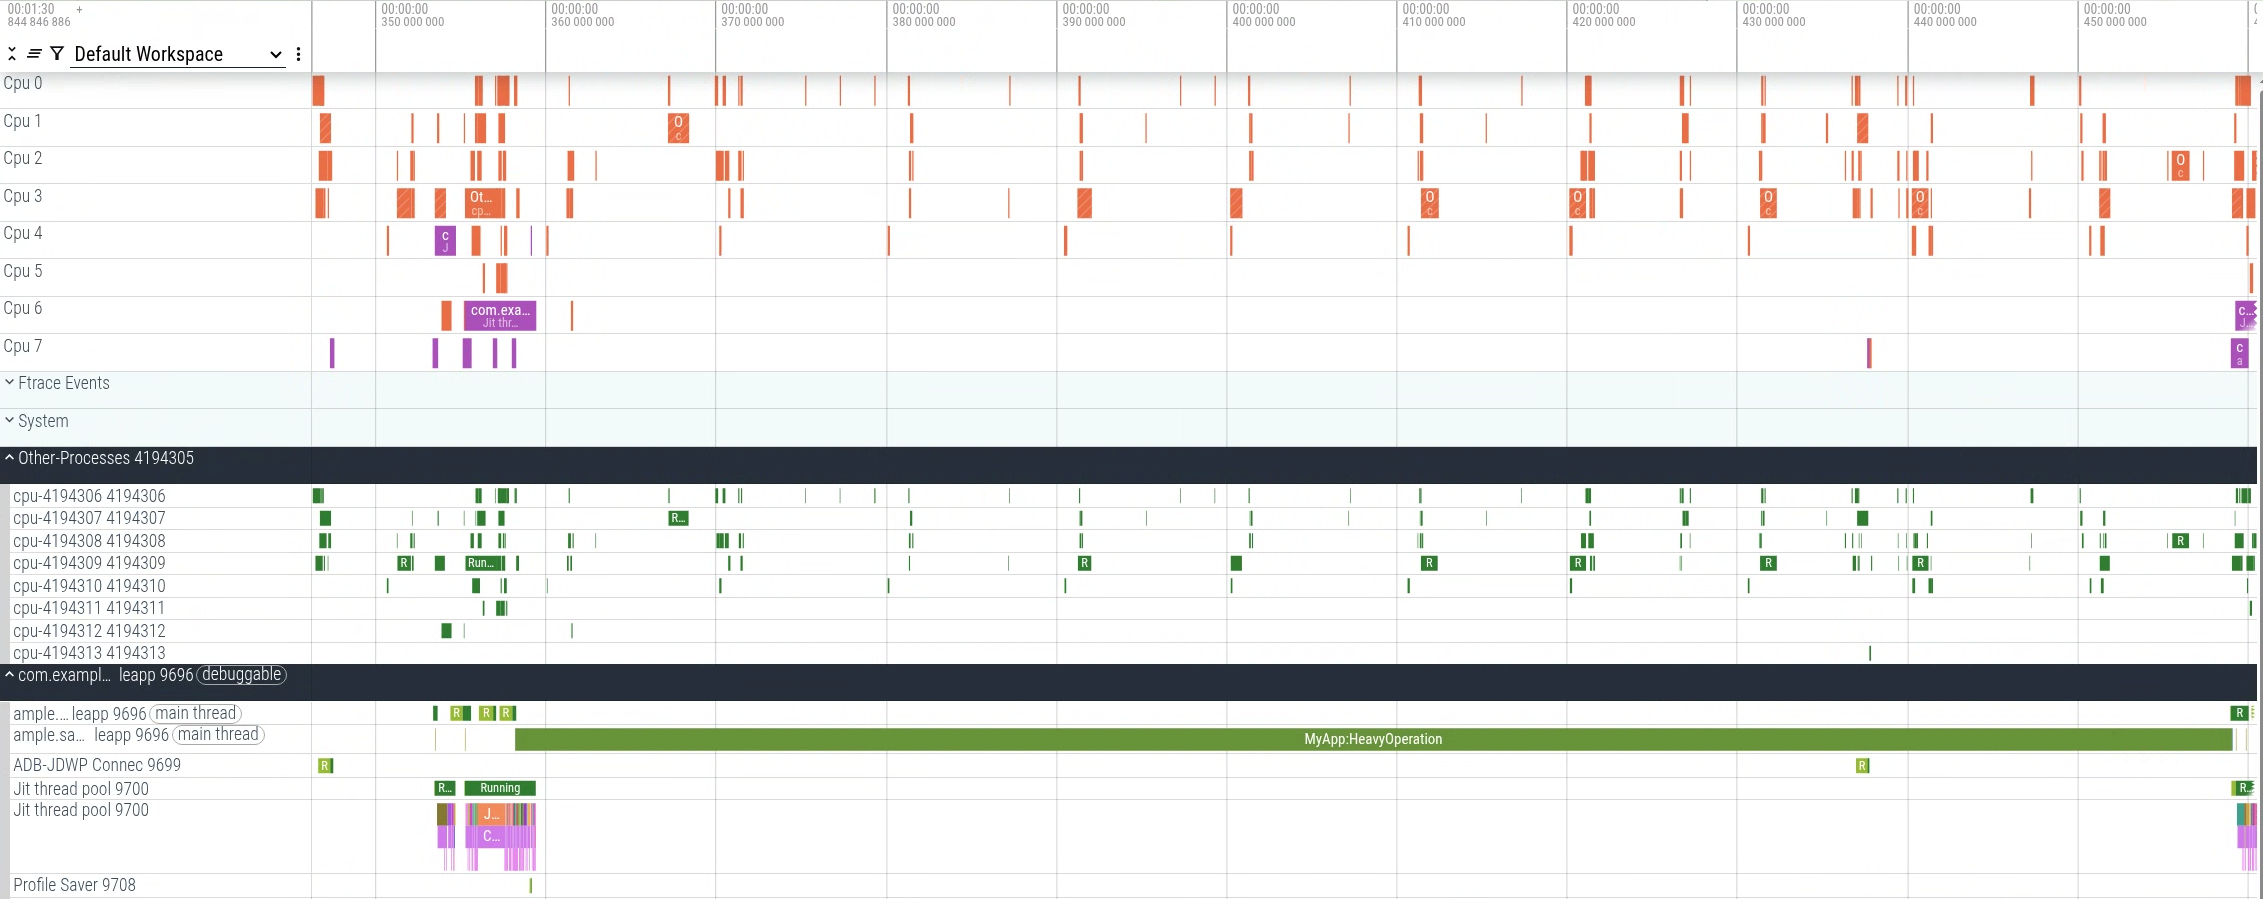
A system trace is a powerful profile that contains information about processes, threads, timing information, CPU and task execution, and system or user-defined events.
From an app perspective, the nature of the information in traces can span a wide range of areas including latency, jank, memory, battery, and more.
System traces contain the following code-driven events that can be either system or user defined. Code-driven events are events that users can trigger through function calls.
- Trace slices: represent the time between different points in your code. They
can be added with
Trace.beginSectionandTrace.endSectionAPIs. - Trace counters: numeric values that represent metrics, for example heap
size. They can be added with
Trace.setCounterAPI.
System traces also contain metrics which can be created from PerfettoSQL queries and can be used to perform analyses or compare traces.
We recommend using system traces to perform the following tasks:
Diagnose latency problems. System traces are excellent for finding latency issues caused by delays, waits, or scheduling problems. Other profilers, like sample-based profiles, don't provide the timing information that system traces provide.
Find duplicated computations. Tracing can reveal if certain calculations are being repeated, which might indicate unnecessary operations.
Diagnose lock contention issues. With information about thread states and slices showing when resources are blocked, you can identify if locks (like
synchronizedblocks) are causing delays in user journeys.Understand multi-threading in your app. Traces offer a view of multiple threads, showing each thread's state and any trace slices added by the system or your app. This multi-thread view helps you understand which threads are active, sleeping, or what they are running and how they interact.
Perform complex performance analyses. The powerful user interface and the ability to display various types of information make system traces useful for debugging a wide range of performance issues, including latency, memory, and battery usage.
System traces also support querying using PerfettoSQL. This powerful feature lets you:
- Extract specific data.
- Transform trace data into custom metrics.
- Create debug tracks from queries to make it easier to visualize the things you care about most in the Perfetto UI.
- Perform complex analyses directly within the Perfetto UI.
Stack sample profiles
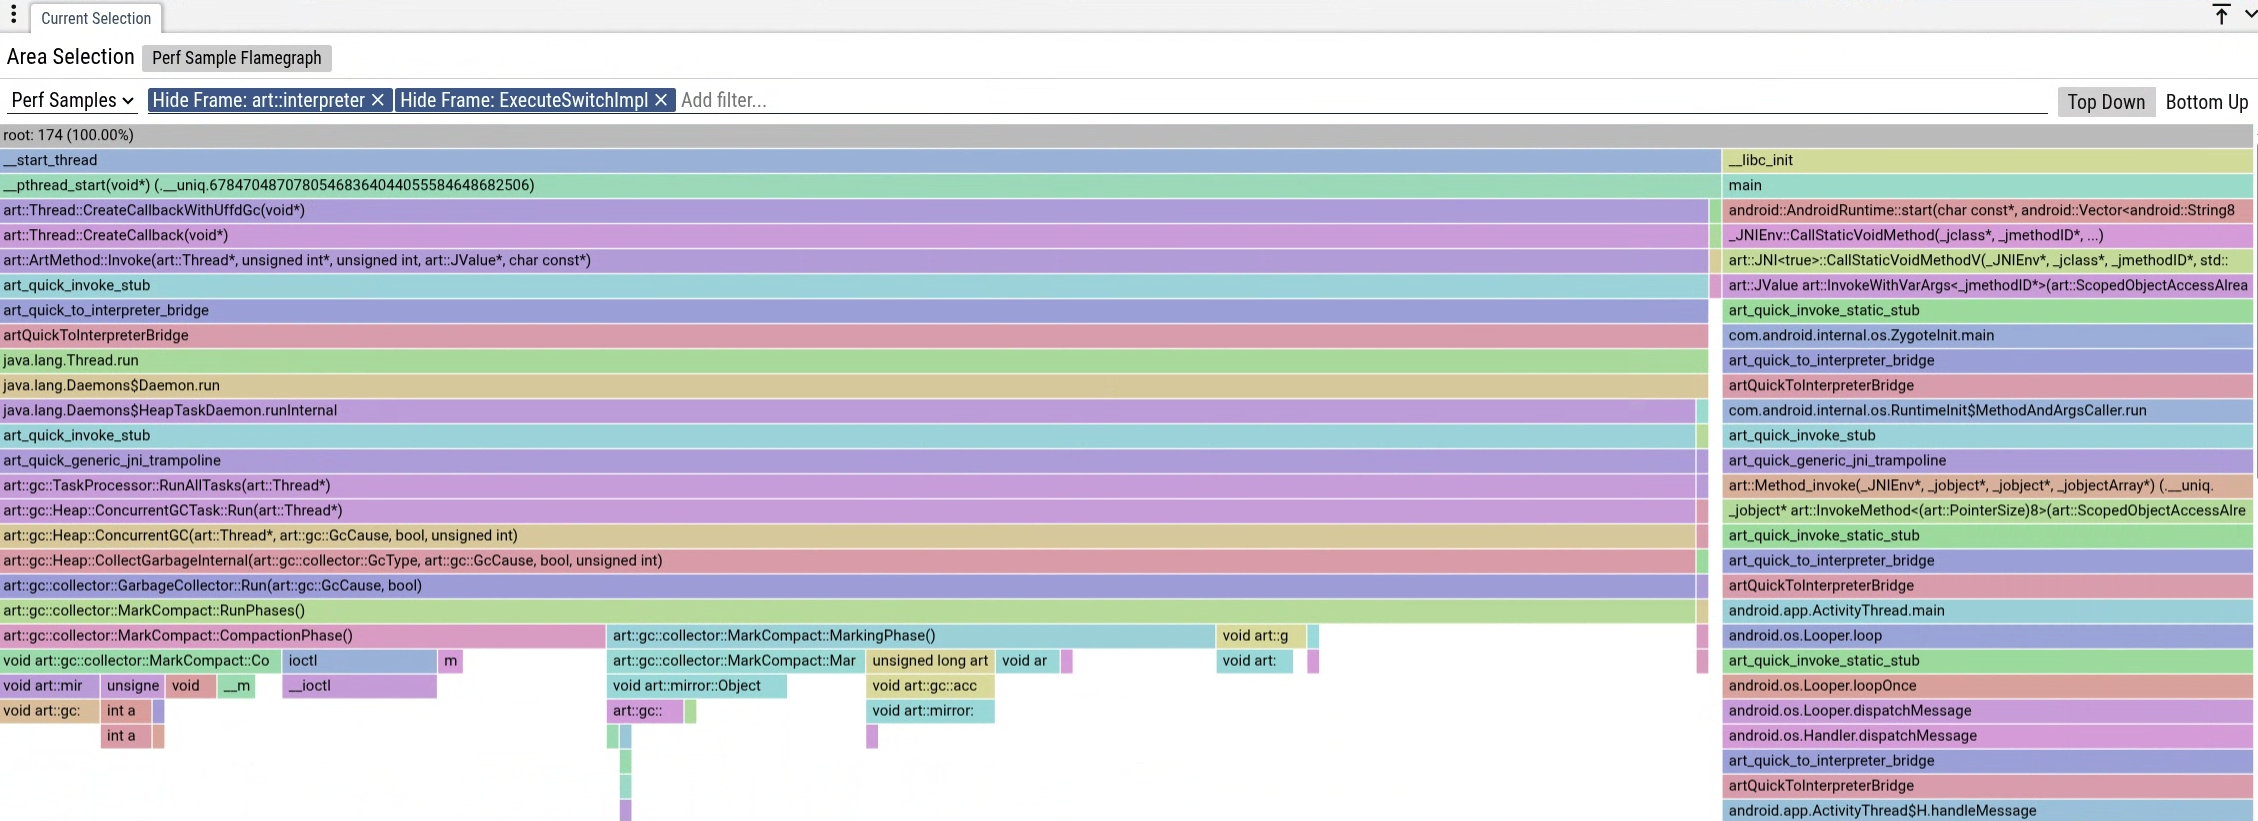
Stack sample profiles work by recording samples of code execution and storing the call stack information at a set rate while a thread is running tasks on the CPU. This provides insights into what your code is doing during execution.
We recommend using stack samples to do the following:
- Optimize hotspots. Stack samples help identify parts of your code with a lot of CPU activity, meaning the thread is often in a "running" state.
- Understand code execution. Stack samples can help you understand the overall behavior of your codebase.
- Identify code that should not run. You might find call stacks that weren't supposed to run at all, which points to immediate opportunities for optimization.
Heap dumps
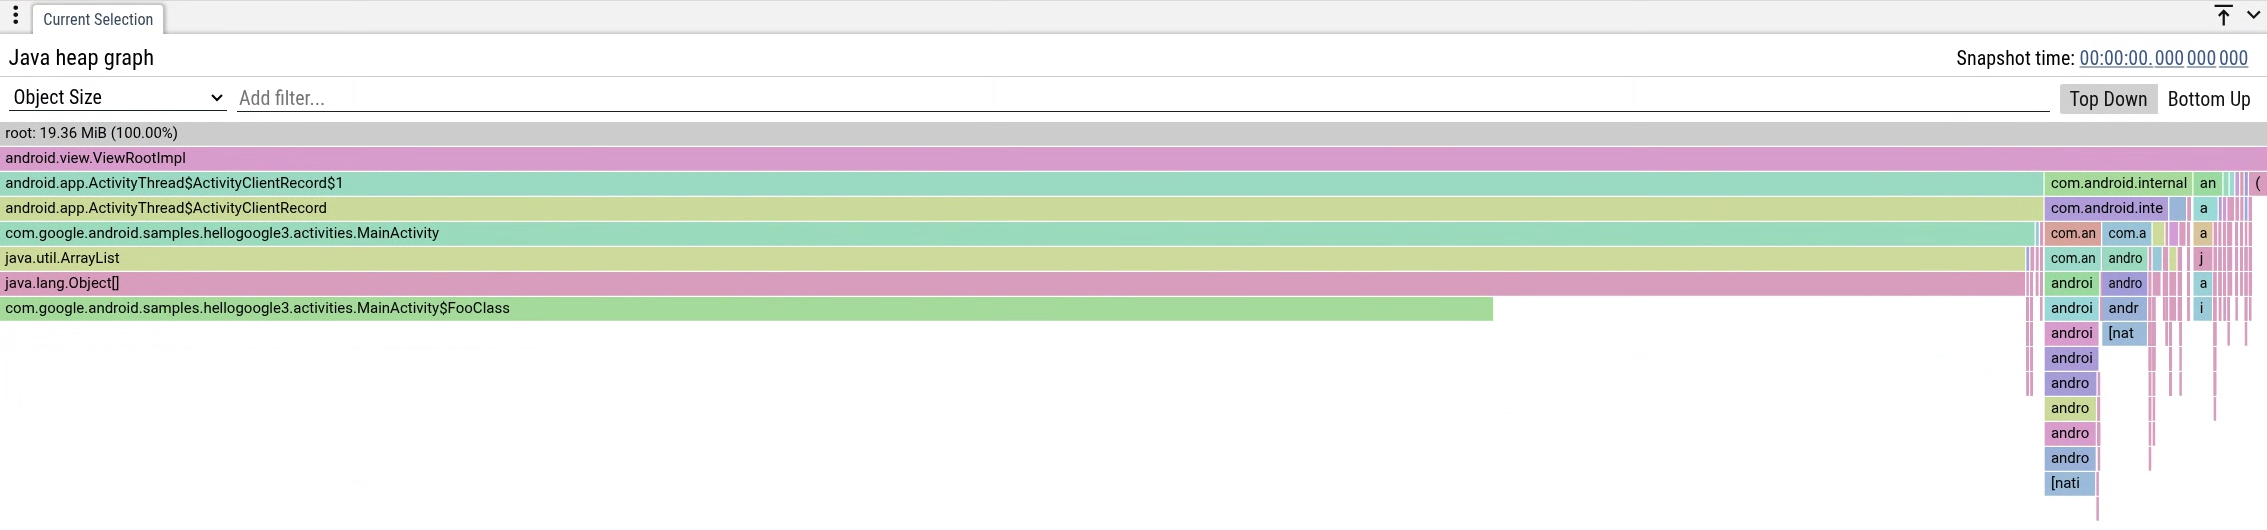
Java heap dumps show a snapshot of your app's Java heap memory. This snapshot includes all objects and how they refer to each other at the time the dump was taken.
We recommend collecting heap dumps to do the following:
- Uncover duplicated objects. Heap dumps show the number of live objects, which is useful for tracking duplicated objects. They also provide object references, helping you pinpoint the code location where objects were created.
- Find memory leaks. Heap dumps can reveal memory that should no longer be in use when the dump was taken, indicating potential memory leaks.
- Identify objects that could be optimized. By showing objects that use a lot of memory and their counts, heap dumps help identify inefficient memory usage patterns.
Heap profiles
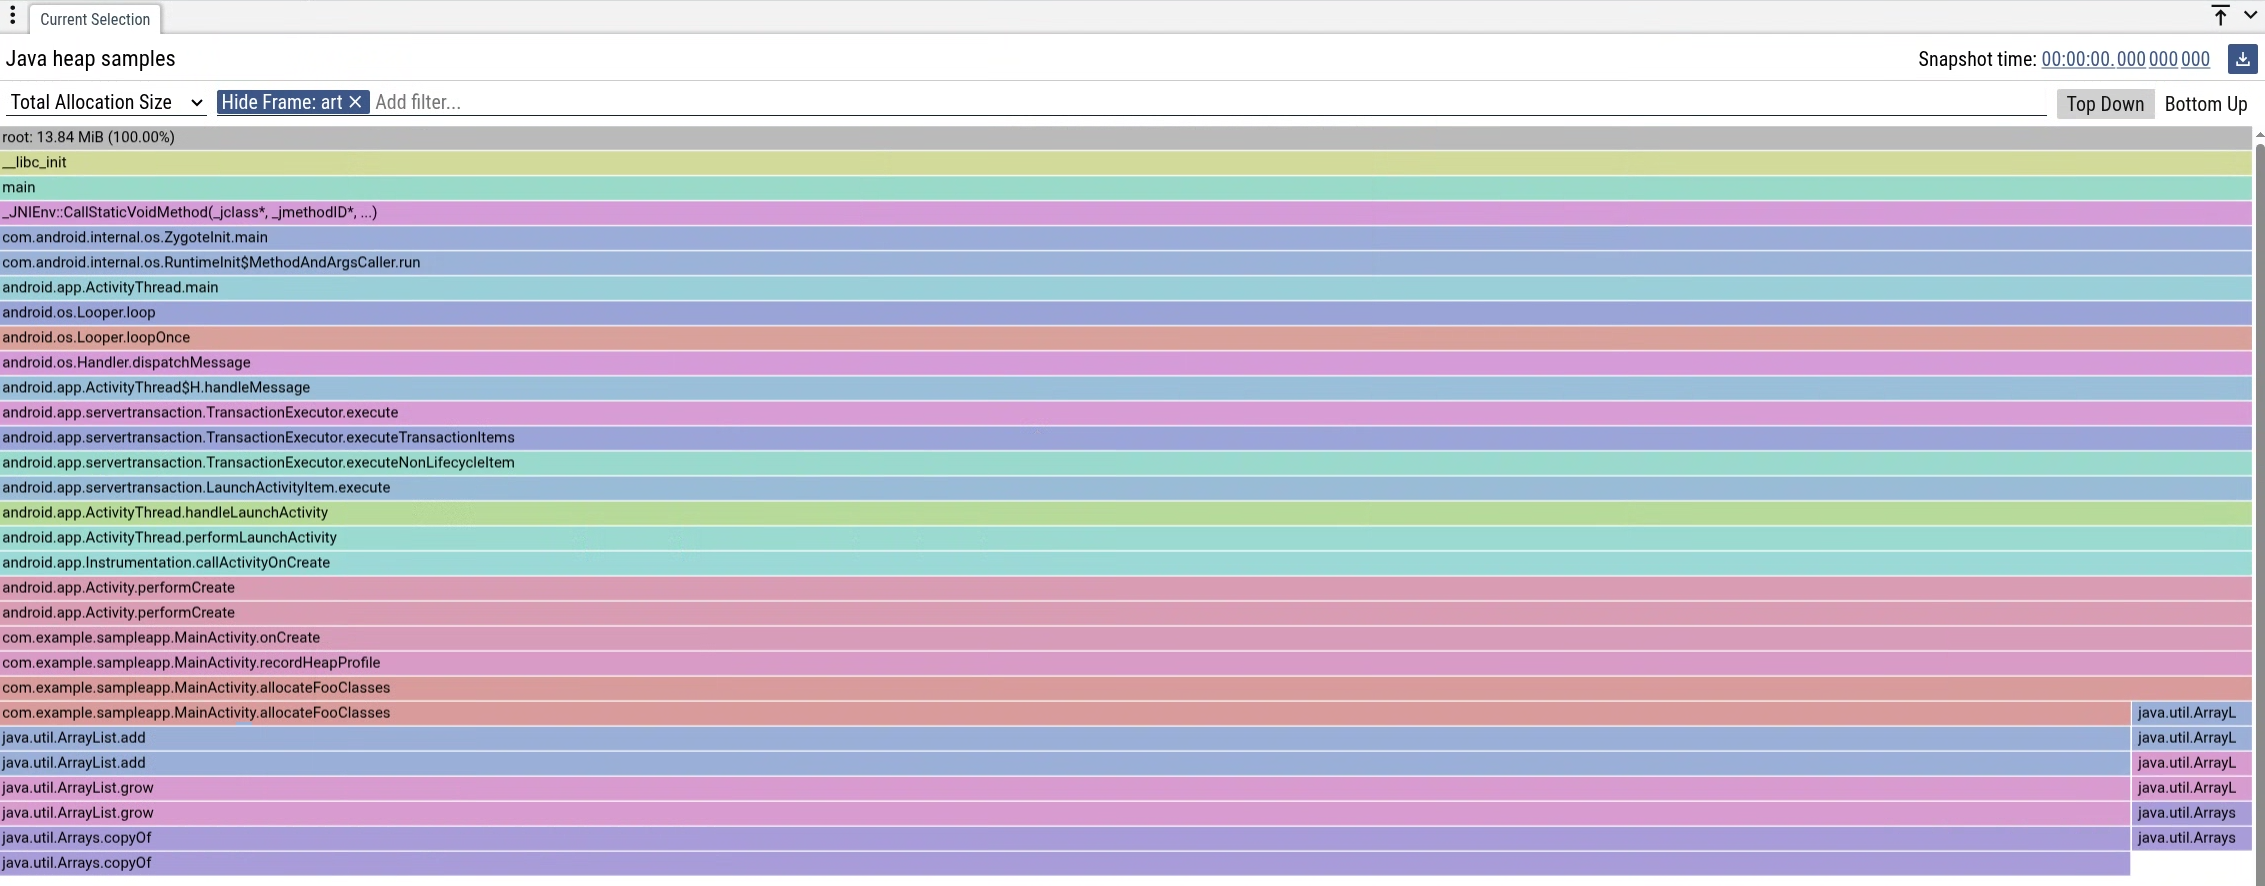
Heap profiles come in both native and Java versions and are excellent for debugging memory issues. They are similar to call stack samples, but instead of measuring CPU cycles, they take samples when memory is allocated.
We recommend using heap profiles to accomplish the following:
- Reduce memory churn. Heap profiles provide samples with code locations for memory allocations. This helps you identify areas that create many temporary objects, which can contribute to frequent Garbage Collections (GCs) in your app.
- Uncover memory leaks. Heap profiles can be used with other memory profiles to diagnose and fix memory leaks. They help you pinpoint locations that are allocating significantly more memory than expected.
Combine profiles
Often, you will analyze performance using a single profile. However, collecting multiple profiles or a single combined profile can often provide a more complete picture and help diagnose complex issues that a single profile alone cannot.
Consider these scenarios where combining profiles is beneficial:
Scenario 1: Investigating uninstrumented code. A system trace might show latency for operations you've already instrumented. However, you might need more information about uninstrumented parts of your code running during those times. To investigate, take a call stack profile to understand the executed code. This information can then help you improve your tracing by adding more trace slices.
Scenario 2: Analyzing memory leaks and garbage collections. Imagine a system trace shows a constant increase in Java heap memory due to allocations, triggering frequent garbage collections (GCs). To understand the allocated objects, take a heap profile or a heap dump. This combined approach helps you identify ways to reduce memory usage. For example, reducing wasteful or optimizable allocations using caching might prevent GCs from occurring.