
Bitmap objects are often the largest single contributors to an application's memory footprint. Whether it's app icons, notification images, or media content, inefficient bitmap handling can quickly lead to Out-Of-Memory (OOM) errors and system-wide memory pressure.
Bitmap configurations and pixel data
The amount of memory a bitmap consumes is primarily determined by its
dimensions (width × height) and its configuration (Bitmap.Config).
The configuration defines how many bytes are used to represent each pixel:
| Configuration | Bytes per Pixel | Description |
|---|---|---|
ALPHA_8 |
1 | Only alpha (transparency) channel. Useful for masks. |
RGB_565 |
2 | Red (5 bits), Green (6 bits), Blue (5 bits). No alpha. Good for opaque images where high color fidelity isn't critical. |
ARGB_8888 |
4 | Alpha, Red, Green, Blue (8 bits each). Default and most common. |
RGBA_F16 |
8 | Half-precision floating point. Used for wide-gamut and HDR content. |
HARDWARE |
N/A | Stored in graphics memory (gralloc/DMABuf). See Hardware Bitmaps. |
Memory Formula: Memory (Bytes) = Width × Height × Bytes Per Pixel
For example, a full-screen image on a 1080p device (1920x1080) in ARGB_8888
takes: 1920 × 1080 × 4 bytes ≈ 8.3 MB.
Heap bitmaps vs. shared bitmaps
Heap bitmaps (native heap)
In modern Android (8.0+), bitmap pixel data is stored in the Native Heap, while only a small wrapper object resides in the Java heap.
When an app needs to present an image, it is usually decoded from a compressed image file into a Bitmap and stored in the heap.
Shared bitmaps (ashmem/memfd)
When a bitmap is transferred between processes (e.g., via Binder to SystemUI
for a notification), Android avoids copying the pixel data by using shared
memory (ashmem or memfd).
A Bitmap instance can be copied to shared memory explicitly by calling
Bitmap.asShared(),
or implicitly if a Bitmap is put inside a Parcel (typically by adding the
Bitmap to a Parcelable such as a Bundle) and sent over Binder IPC.
When a shared Bitmap is sent over Binder IPC, the pixel data itself is not copied, but rather a file descriptor referencing a shared memory region is duplicated to the recipient process. The underlying memory region may be shared between multiple process, and is not freed until all file descriptors referencing it have been closed.
Mutable vs. immutable bitmaps
- Mutable Bitmaps: Can be modified after creation (e.g., via a
Canvas). They always require their own private memory allocation. If a mutable Bitmap is copied, a deep copy (second copy of all pixel data) must be made. - Immutable Bitmaps: Cannot be changed. This allows for optimizations like
sharing the same underlying memory buffer between different
Bitmapinstances. Bitmaps loaded from APK resources (BitmapFactory) are typically immutable.
Efficient bitmap handling
Bitmap pooling and reuse
Allocating and deallocating bitmaps frequently causes allocation churn, which forces the GC to run constantly. Common image loading libraries use a Bitmap Pool.
Google recommends Glide as the solution for Java-based applications, and Coil for Kotlin-based applications (especially when using Jetpack Compose).
When a bitmap is no longer needed, instead of letting it be GC'd, the app calls
bitmap.recycle() or returns it to a pool. The next time a bitmap of the same
dimensions and configuration is needed, the pool provides the existing buffer,
avoiding a new allocation.
Hardware bitmaps
Bitmap.Config.HARDWARE allows you to store pixel data directly in graphics
memory (DMABuf).
- Pros:
- Memory Savings: Doesn't use application or native heap; uses GPU memory. Often Bitmaps shown in an app's UI need to be copied to GPU memory anyway, so this saves that copy operation and the added memory cost.
- Performance: Extremely fast to draw because the data is already on the GPU.
- Cons:
- Immutable: Hardware bitmaps cannot be modified.
- Read-back is slow: Accessing pixels from the CPU (e.g.,
getPixel()) is very expensive. - Attribution: Harder to track in standard tools like AHAT (see below).
Hands-on exercise: bitmap exploration
We will use the BitmapLab sample app to explore these concepts.
1. Measuring with dumpsys meminfo
Launch BitmapLab and tap ALLOCATE 10MB ARGB_8888. Then run:
adb shell dumpsys meminfo -s com.android.bitmaplab
On modern Android versions, look for the Native Allocations section. These provide much better attribution for bitmaps than the generic App Summary:
 Native Allocations
                         Count                       Total(kB)
                        ------                         ------
   Bitmap (malloced):        1                          10240  # <--- 10MB Bitmap data!
Bitmap (nonmalloced):        0                              0
- Bitmap (malloced): Bitmaps allocated in the process's native heap. This is where most standard bitmaps live in Android 8.0+.
- Bitmap (nonmalloced): Bitmaps that use specialized memory like
Hardware Bitmaps or Shared Bitmaps (via
ashmemormemfd).
If you allocate a Shared Bitmap in BitmapLab, you will see it reflected
in Bitmap (nonmalloced):
 Native Allocations
                         Count                       Total(kB)
                        ------                         ------
   Bitmap (malloced):        1                          10240
Bitmap (nonmalloced):        1                          10240  # <--- Shared Bitmap!
Shared bitmaps tracking
On some Android versions and kernel configurations, dumpsys meminfo also
provides high-resolution tracking for bitmaps that are mapped into the process's
address space via file descriptors.
By default, shared bitmaps use a generic name ("bitmap"). To enable detailed attribution and unique bitmap tracking (identifying shared bitmaps across different processes), you must enable the following system property:
adb shell setprop debug.hwui.bitmap_ashmem_long_name true
When enabled, the ashmem regions in /proc/<pid>/smaps will have more
descriptive names. meminfo will take advantage of that, and the results will
look like this:
 Shared Bitmaps
                         Count                       Size(KB)
                        ------                         ------
              Mapped:        1                          10240
              Unique:        1                          10240
- Mapped: The total size of all bitmap-related memory mappings.
- Unique: The size of bitmaps only considering uniques (i.e. two or more mappings of the same underlying shared Bitmap pixel data count only once).
2. Bitmaps in AHAT
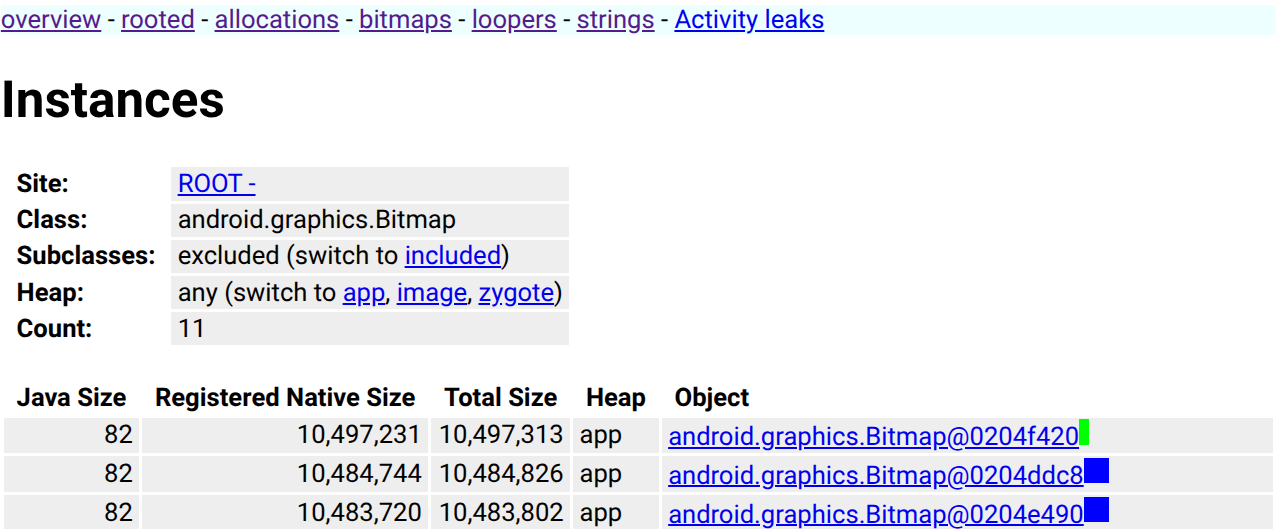
AHAT provides excellent visualization for Bitmaps.
- In BitmapLab, allocate a few bitmaps.
Capture a heap dump with the
-bflag (to include native bitmap data):adb shell am dumpheap -b png com.android.bitmaplab /data/local/tmp/bitmaps.hprof adb pull /data/local/tmp/bitmaps.hprof . ahat bitmaps.hprofOpen
localhost:7100and look for the Bitmaps link in the sidebar or search for theBitmapclass.AHAT will actually render the bitmaps in the browser, making it easy to identify which images are hogging memory.
3. Bitmap tracks in Perfetto
Perfetto can track bitmap allocations and counts over time. These counters are emitted by the Android framework when the gfx atrace category is enabled for a specific application.
Start a trace. You must include the
gfxcategory and target the specific app package using the-aflag:external/perfetto/tools/record_android_trace -o bitmaps.perfetto-trace \ -t 15s -b 64mb view gfx dalvik am res memory -a com.android.bitmaplabIn BitmapLab, tap Allocate and Clear buttons repeatedly.
Also tap Parcel/Unparcel Bitmap.
Analyze the trace in ui.perfetto.dev.
In the process section for com.android.bitmaplab, you will see:
* Bitmap Count: A counter showing the number of active bitmaps.
* Bitmap Memory: A counter showing the total bytes used by bitmaps.
High-level slices (Perfetto SDK)
BitmapLab also uses the Perfetto SDK to emit high-level slices for
bitmap operations. Search for BitmapLab_ in the trace to find:
* BitmapLab_parcelUnparcel: Slices covering the parceling and unparceling
logic.
* BitmapLab_postNotification: Slices covering the notification posting
flow.
Tracking notification flows
When you tap Post Notification, the app creates a notification containing the current bitmap and sends it to the system. The framework code responsible for this emits Perfetto slices with flow events connecting the parceling (writing the bitmap to a Parcel to be sent over Binder IPC) and unparceling (reading the bitmap from a Parcel on the receiving end).
In the screenshot below you can see the app parceling the large bitmap to be
used in a Binder transaction to post the notification, and the corresponding
unparceling in the system_server process.
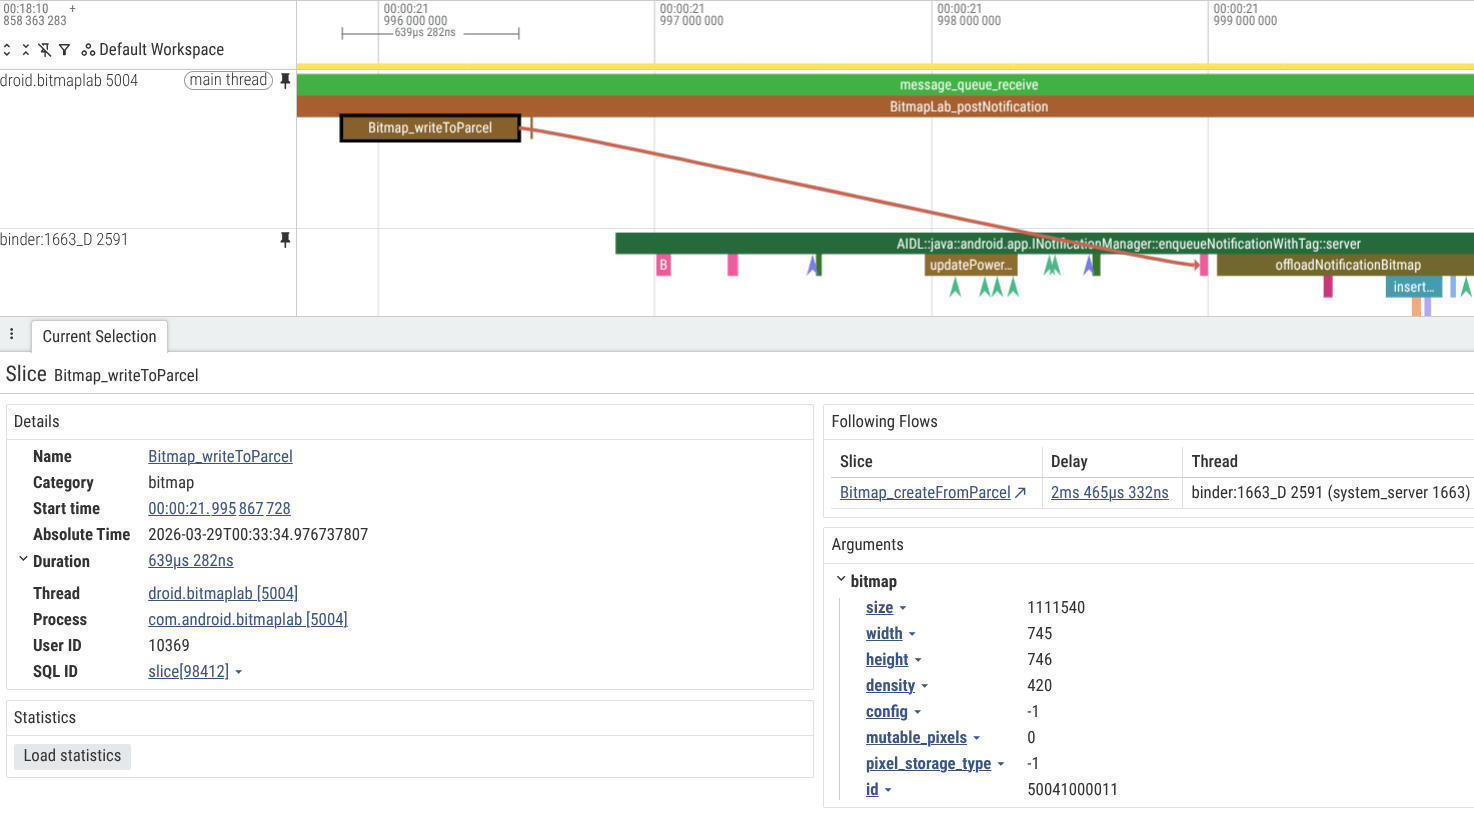
Using Perfetto you can even follow the same notification bitmap as it further
propagates across threads and processes, for instance from a binder thread in
system_server (which implements the INotificationManager Binder server) to
system_server worker threads that might then forward the same bitmap to
com.android.systemui to be shown in the notifications shade.
System app challenges
System apps like SystemUI (Notifications) and Launcher face unique challenges:
- Unbounded Content: Notifications and Widgets can be numerous. If each one holds a large bitmap, the system can quickly run out of memory.
- Duplication: The same app icon might be held in Launcher's cache, SystemUI's notification area, and the Settings app.
- Sharing via Hardware Buffers: To mitigate this, system components are
moving toward a centralized "image offload" service that shares
HardwareBufferinstances across processes. DMABuf Attribution: Hardware bitmaps save heap space but use DMABuf memory, which is harder to attribute to a specific process in standard memory tools.
Use
adb shell dmabuf_dumpto see system-wide DMABuf allocations. This tool provides a per-process breakdown of buffers:droid.bitmaplab:19562 Name Rss Pss nr_procs Inode Exporter <unknown> 3840 kB 1280 kB 3 3397 virtio_gpu system 12 kB 4 kB 3 3398 system <unknown> 3840 kB 1920 kB 2 3399 virtio_gpu system 12 kB 6 kB 2 3400 system PROCESS TOTAL 11556 kB 5136 kB- RSS: The total size of the buffer if it is mapped in the process.
- Pss: The proportional size (RSS divided by the number of processes sharing the buffer). This is the best metric for accounting.
- nr_procs: The number of processes currently holding a reference to this buffer.
- Exporter: The driver that allocated the buffer (e.g.,
virtio_gpuon Cuttlefish, or a vendor-specific Ion/DMA-BUF heap on hardware).
You can also use
adb shell dmabuf_dump -bfor a summary of all buffers and total system-wide DMA-BUF usage.