
WebView is a powerful component that allows you to display web content within your Android application. However, because it's essentially a full-featured browser engine (Chromium), it has a significant memory footprint and a complex multi-process architecture.
Technical background: Multi-process architecture
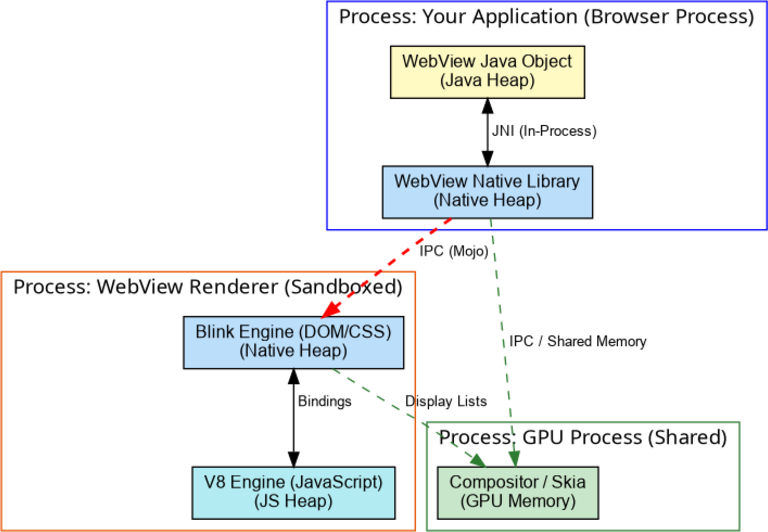
On modern Android-powered devices, WebView uses a multi-process model to improve security and stability. When your app uses a WebView, the memory is distributed across different processes:
- Browser process (the app process): This is your application's main
process. It contains the Java
WebViewobject and the "browser" part of the Chromium engine. This process manages the UI, network requests, and GPU rendering (integrated directly with the Android HWUI rendering pipeline). Unlike Chrome, WebView does not have a separate GPU process. - Renderer process: This process is responsible for parsing HTML, executing JavaScript, and layout. It is isolated from the rest of the system for security. Currently, apps just get one renderer process for all WebViews (except for a few rare special cases), unlike Chrome which often uses separate renderer processes for different sites.
Why this matters for memory
When you use dumpsys meminfo <your_package>, you only see the memory used by
the browser process (your app process). The memory used by the renderer
process is accounted for separately.
Inside the browser process, WebView memory is distributed as:
- Java heap: Contains the
WebViewJava wrapper and related objects. - Native heap: Contains the Chromium browser engine's internal data
structures, caches, and state. Note that due to the use of PartitionAlloc,
some WebView native allocations might not be counted under "Native Heap" in
dumpsys meminfoand may instead appear under "Other" or "Unknown". - Shared memory: Used for sharing graphical buffers and other data. This
may not be clearly categorized by
dumpsys meminfo.
Troubleshooting tools
Chrome DevTools
The most powerful tool for analyzing the memory inside the WebView (the renderer process) is Chrome DevTools.
Enable WebView debugging in your app:
// NOTE: In production, this should be gated behind a developer setting
// or only enabled for debuggable builds to prevent reverse engineering.
WebView.setWebContentsDebuggingEnabled(true);
Connect your device via USB.
Open Chrome on your host machine and navigate to
chrome://inspect/#devices.Find your app and click inspect.
In the DevTools window, go to the Memory tab to take heap snapshots or record allocation timelines for the JavaScript heap.
dumpsys meminfo
Use adb shell dumpsys meminfo --all <package> to see a breakdown of memory.
Look for the WebView category in the output and the object counts.
Profiling the renderer
Since the Renderer runs in a separate process, you can't profile its native heap by just profiling your app. You must identify the PID of the renderer process specifically.
To identify the correct renderer PID when multiple WebViews are active:
Use
dumpsys activity:adb shell dumpsys activity processes <your_package_name>Look for the
mConnectionssection. You will see aConnectionRecordlinking your app to aSandboxedProcessService. The PID of that process is your renderer. Example:mConnections: - ConnectionRecord{... com.android.memorylab/org.chromium.content.app.SandboxedProcessService0:0 ...}Check Process Names: Renderer processes are usually named
com.google.android.webview:sandboxed_processXor similar. If only one app is using a WebView, there will likely be only one.
Once you have the PID, you can profile it using heapprofd.
Best practices for WebView memory
Explicit destruction
Apps are expected to call WebView.destroy() to indicate when they're finished
with an instance.
While WebView tries to ensure that instances can be garbage collected and release all their resources automatically, this is hard to guarantee in 100% of cases. Even when automatic garbage collection works, it may be significantly delayed, causing the app to hold onto resources much longer than expected.
If an app calls WebView.destroy() at the appropriate time (e.g., in
Activity.onDestroy()), holding onto a reference to the WebView object itself
will not leak any significant native resources. There is no strict need to null
out references to the WebView object in Activity fields after destroying it,
as it will be cleaned up when the Activity itself is garbage collected.
Exercises: hands-on with WebView memory
Exercise 1: observing the multi-process footprint
Launch MemoryLab and take a baseline measurement of your app's memory:
adb shell dumpsys meminfo com.android.memorylabSample baseline (rango):
TOTAL PSS: 18915 KBTap Launch WebView (Normal).
In the WebView, tap Allocate JS Memory (1000 DIVs) several times.
Check the app's memory again:
adb shell dumpsys meminfo com.android.memorylabObserve that the memory in your app process doesn't increase significantly compared to the baseline! This is because the DOM elements are in the Renderer Process.
Find the renderer process:
adb shell ps -A | grep webview | grep sandboxedExample output:
u0_i9002 14227 1087 1632732 135880 do_epoll_wait 0 S com.google.android.webview:sandboxed_process0Check the memory of the renderer process (using its PID):
adb shell dumpsys meminfo 14227Observe the high TOTAL PSS of the renderer process. In our sample run, it jumped to ~55MB after a few allocations. Note that JavaScript allocations (handled by the V8 engine) typically contribute to the Private Other or Unknown (mmap) sections of
dumpsys meminfo, rather than the Dalvik Heap.
Exercise 2: the Java-side WebView leak
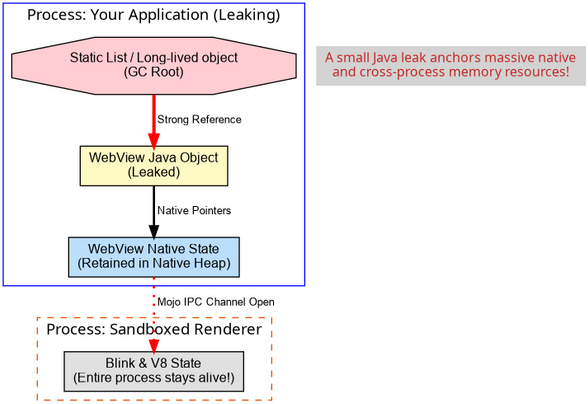
A common mistake is holding onto a WebView instance in a static field or in a
long-lived object that leaks. Because the WebView object is a heavy "anchor"
that holds onto native resources and potentially entire renderer processes,
leaking it is very costly.
- In MemoryLab, tap Launch WebView (Java Leak).
- The activity will automatically close after the page is loaded (simulating repeated navigation and leak accumulation).
- Tap the button 4 times.
Check the number of
WebViewinstances in your app:adb shell dumpsys meminfo com.android.memorylabLook for the Objects section at the bottom. You will see the count for
WebViewshas increased to 4.Sample output (4 leaked instances) on rango:
 Objects
           Views:       51         ViewRootImpl:        5
     AppContexts:       14           Activities:        5
          Assets:       38        AssetManagers:        0
   Local Binders:       55        Proxy Binders:       77
   Parcel memory:       41         Parcel count:       68
Death Recipients:        3             WebViews:        4
Capture a heap dump and use AHAT to find the leak. If you don't have
ahatin your path, you can build it from the Android tree:# Dump heap from device adb shell am dumpheap com.android.memorylab /data/local/tmp/heap.hprof adb pull /data/local/tmp/heap.hprof # Run ahat using the built JAR (found in out/host/linux-x86/framework/) java -jar out/host/linux-x86/framework/ahat.jar -p 8888 heap.hprofIn the AHAT web interface (
localhost:8888), click on the allocations link (or sites) in the top menu to see the overall memory usage.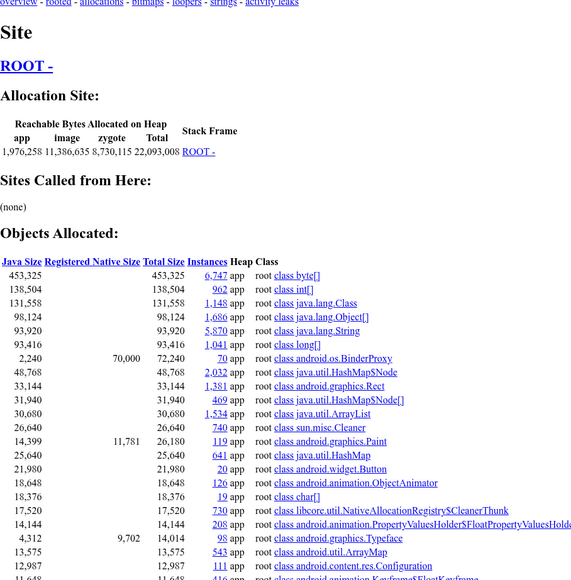
Search for the
android.webkit.WebViewclass. Click on its instance count to see all live instances. You should see multiple instances in the list.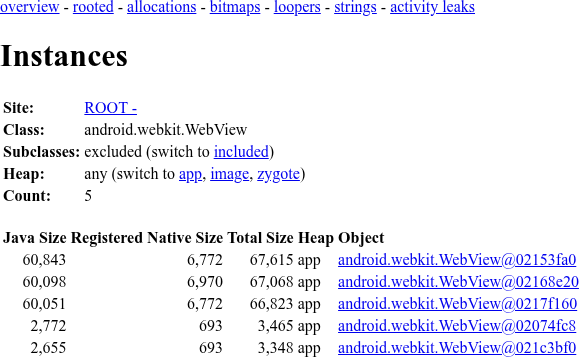
Click on one of the leaked
WebViewinstances. Scroll down to the Sample Path from GC Root section. You will see it is being held by thesLeakedWebViewslist incom.android.memorylab.WebViewActivity.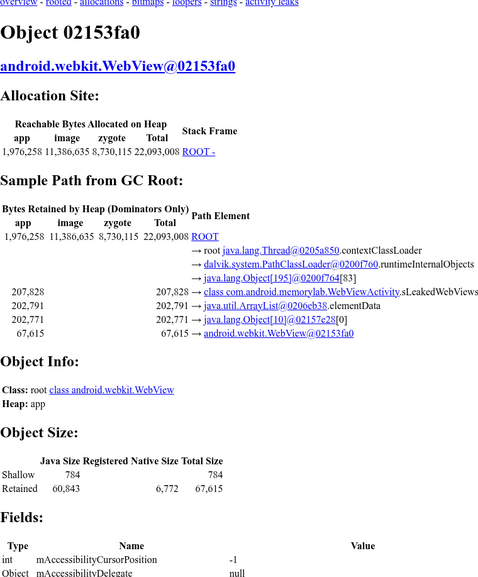
← Native | ↑ Up | App code →