
Native memory refers to allocations made in C, C++, or Rust code using functions
like malloc, free, or operators like new and delete. Unlike Java, native
memory is not automatically garbage-collected; you are responsible for managing
the lifecycle of every allocation.
Profiling with heapprofd
heapprofd is the platform-wide native heap profiler for Android. It uses a
sampling-based approach to record allocations and deallocations with minimal
overhead.
Using the heap_profile tool
The easiest way to capture a native heap profile is using the heap_profile
script provided by Perfetto.
Download the script from the Perfetto repository:
curl -O https://raw.githubusercontent.com/google/perfetto/master/tools/heap_profile
chmod +x heap_profile
Ensure your device is connected via ADB and run the tool, specifying the target process:
./heap_profile -n <package_name_or_process_name>Perform the user journey in your application.
Stop the profiler (Ctrl+C). The script will automatically pull the profile, start a local
pprofserver, and open your web browser to view the flamegraph.
Triggering snapshots
You can also trigger a dump of the current heap state while a Perfetto trace is running:
adb shell killall -USR1 heapprofd
This creates a snapshot (diamond icon) in the Perfetto UI.
Use an example heapprofd configuration like this:
buffers: {
    size_kb: 65536
}
data_sources: {
    config {
        name: "android.heapprofd"
        heapprofd_config {
            sampling_interval_bytes: 4096
            process_cmdline: "com.example.myapp"
        }
    }
}
duration_ms: 20000
Analyzing with pprof
The output of heapprofd is a set of .pb.gz files. If you used the
heap_profile script, these files are automatically pulled to your host
machine's temporary directory (e.g., /tmp/heap_profile-XXXXXX on Linux or
macOS), and a convenient symlink is created at /tmp/heap_profile-latest.
See also: Recording memory profiles with Perfetto
You can manually analyze these files using pprof, a tool for visualization and analysis of profiling data.
Viewing flamegraphs
Upload your profile to a pprof viewer such as Google pprof, available on
GitHub.
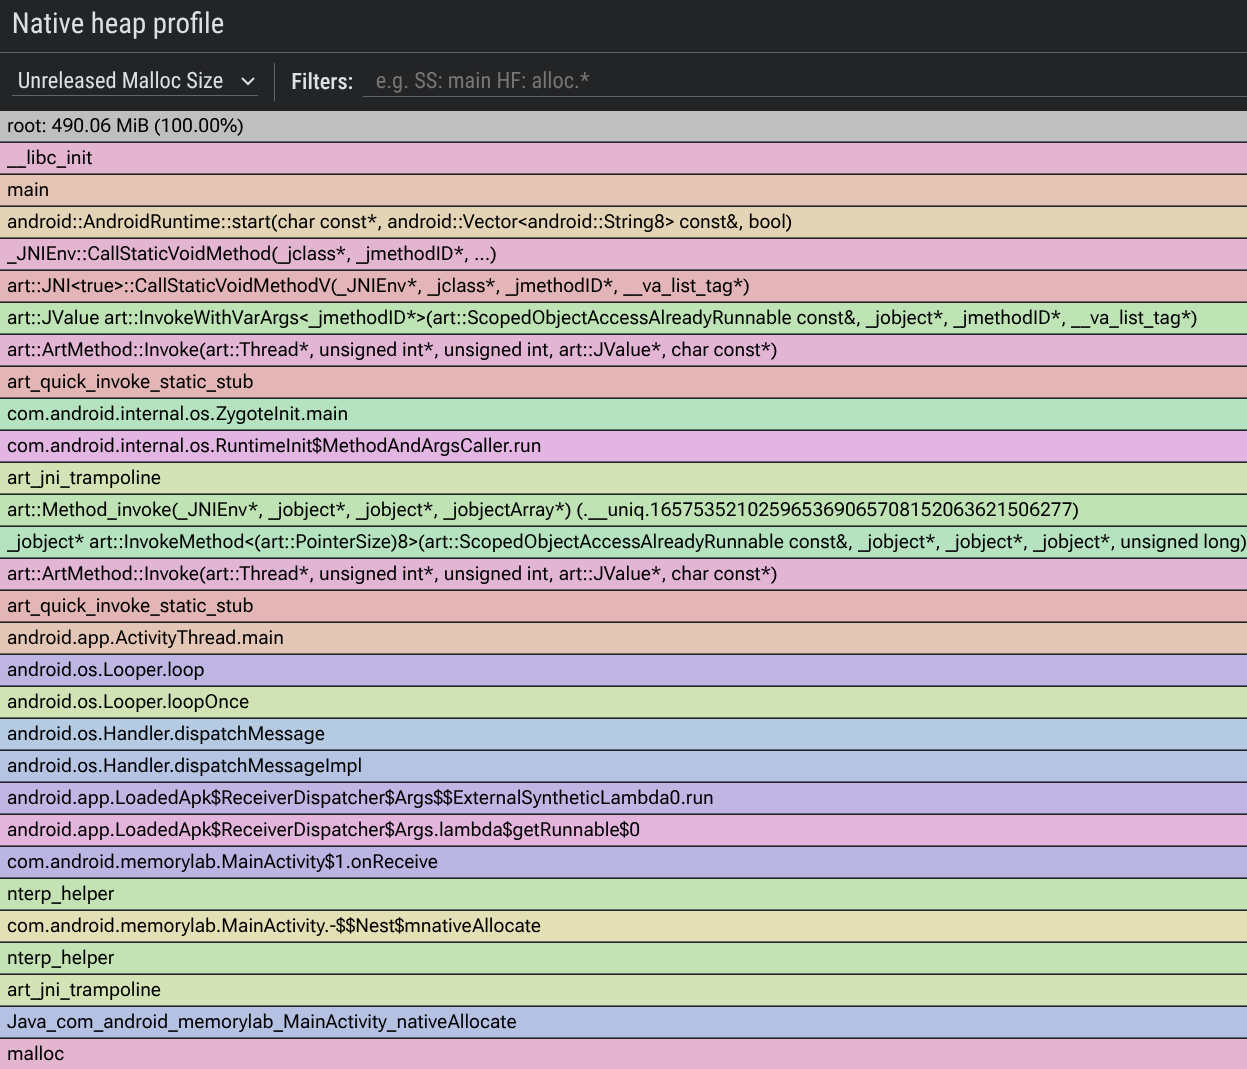
- Unreleased Memory: Look for allocations that were made but never freed. A flamegraph will show the call stacks responsible for the most unreleased bytes.
- Total Allocations: You can also view the total count or bytes allocated over the entire profile duration, which is useful for finding allocation churn in native code.
PerfettoSQL for native heap profiles
If you captured the native heap profile within a full Perfetto trace (using
heapprofd), you can query the raw allocations. This is useful for counting
objects or summarizing bytes:
SELECT
  upid,
  count(id) AS allocation_count,
  sum(size) AS total_bytes
FROM heap_profile_allocation
GROUP BY upid
ORDER BY total_bytes DESC;
You can also view the total count or bytes allocated during the profile, even if they were subsequently freed. This is useful for finding "allocation churn."
Symbolization
If you see "unknown" frames in your flamegraph, you need to symbolize the
profile. This requires providing the unstripped versions of your native
libraries (.so files with debug symbols).
Where to find symbols in AOSP: Symbols are generated during the build
process and stored at: out/target/product/<device_name>/symbols/
Use the --sym-dir flag with the heap_profile tool:
./heap_profile -n <process> --sym-dir <path-to-unstripped-symbols>
Analyzing graphics and DMA-BUFs
On modern Android-powered devices, a significant portion of memory is often consumed by graphics buffers, known as DMA-BUFs. These are used for UI layers, camera frames, and video buffers.
Because DMA-BUFs are shared between processes (e.g., between your app and the
surfaceflinger or camera service), they can be hard to track. The
dmabuf_dump tool reports all processes using DMA-BUFs.