
To understand memory usage on Android, you must look at the system from several different perspectives, ranging from high-level Java objects down to low-level kernel pages.
The performance cliff
Memory use in and of itself is not a good or bad thing; what matters is what you are using the memory for. However, as you approach the limit of available memory on a device, you eventually "fall off a performance cliff."
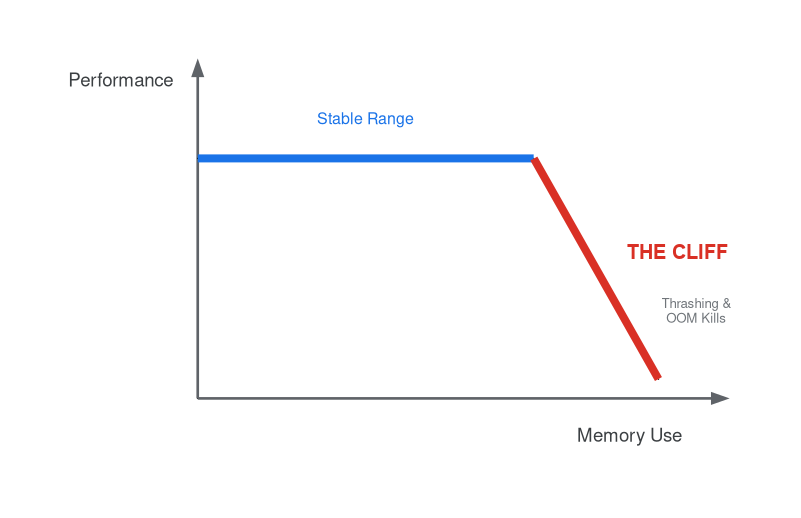
When you are far away from the cliff, adding a small amount of memory usage (e.g., 50MB) may have no perceptible impact on performance. However, a cliff is reached when the available RAM is exhausted. At this point, the operating system must start paging out memory and killing processes to free up space. Beyond this cliff, even a small increase in memory use can lead to significant "thrashing," where the device becomes unresponsive or appears to reboot because critical processes are killed.
The Android stack
Each layer of the Android stack has its own unique view of memory:
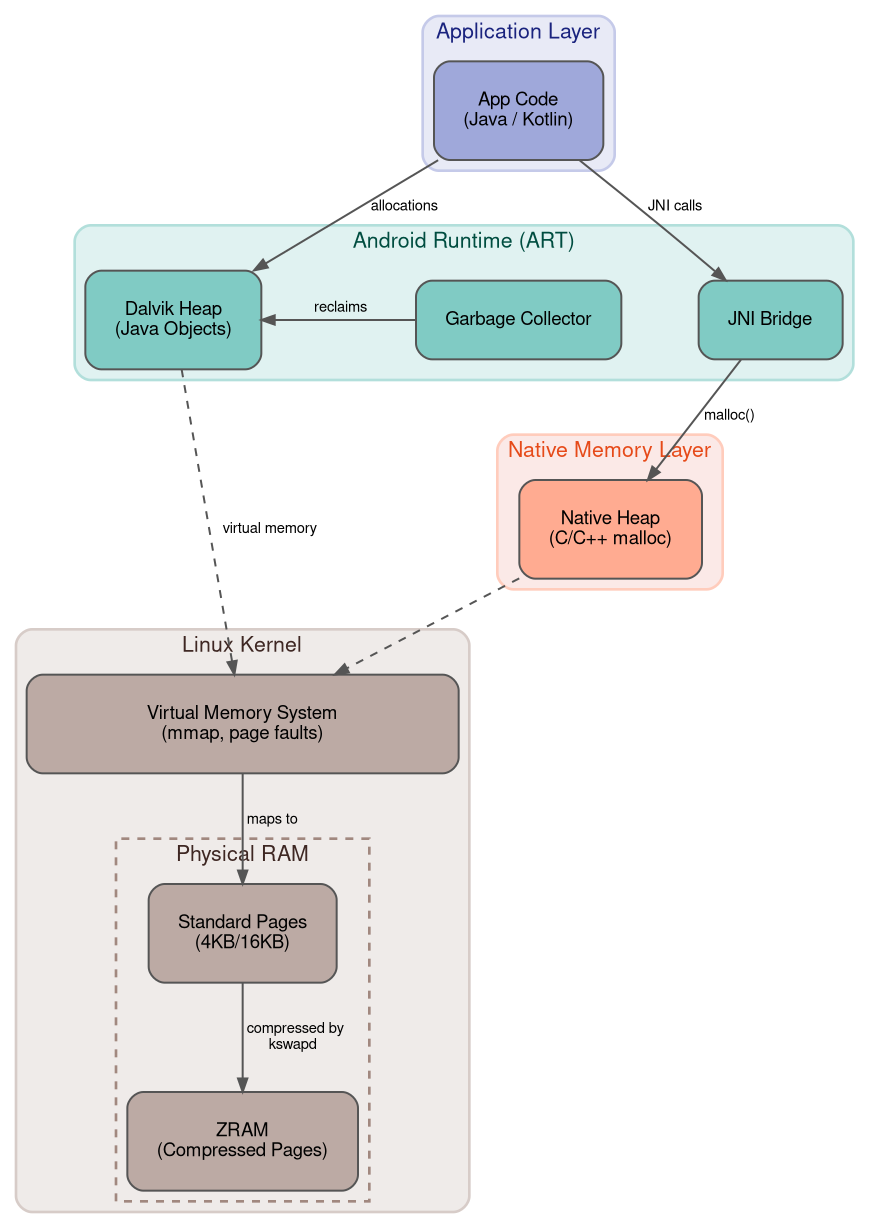
- Applications (Java/Kotlin): Developers primarily see Java objects allocated on the Java heap.
- Android Runtime (ART): ART manages the Java/Kotlin heap by using virtual memory pages from the kernel. Formerly known as Dalvik (the terms are sometimes used interchangeably).
- Linux Kernel: The kernel sees memory in terms of physical and virtual pages. Traditionally, these are 4KB, but Android also supports 16KB page sizes. The kernel knows nothing about "Java objects."
If you want to optimize memory, you must either optimize within your own layer (e.g., loading fewer bitmaps) or understand the layers below you to see how your high-level allocations translate to physical page usage.
Memory types: anonymous vs. file-backed
Before diving into how the OS reclaims memory, you must understand the two fundamental categories of memory pages in Linux:
- Anonymous Memory (
anon): Memory that is not backed by a file on storage. This includes memory allocated by C/C++malloc(like the Scudo allocator) and memory allocated for Java objects on the Java/Kotlin heap. Because this memory has no source file to return to, the OS must either keep it in RAM or compress and swap it out to ZRAM when under pressure. - File-Backed Memory (
file): Memory that is mapped directly from a file on storage. This includes executable code (DEX files,.sonative libraries) and fonts.
Memory mapped files (mmap)
Android uses mmap to map both file-backed and anonymous memory into a
process's address space.
When dealing with file-backed memory, pages are further classified into:
- Clean Memory: Pages mapped from a file that have not been modified. If the system needs more memory, the kernel can simply drop these pages, as they can be re-loaded directly from the file on storage later.
- Dirty Memory: Pages that have been modified by the process. These cannot be dropped; they behave like anonymous memory and must be kept in RAM or moved to ZRAM.
Android prefers file formats (like DEX) that are amenable to memory mapping, allowing the system to easily reclaim clean memory under pressure. Because anonymous and dirty memory cannot be simply dropped, high private dirty/anon memory is the primary cause of system thrashing and Low Memory Killer (LMK) interventions. If your application uses a lot of private dirty memory, you are directly contributing to the performance cliff.
The Zygote process model
Android minimizes the cost of starting new applications by using a process called Zygote.
- Zygote starts up at boot and preloads common framework classes and resources into its memory. From the kernel's perspective, this becomes anonymous dirty memory, but it is unique to the Zygote process.
- When a new application starts, the system forks the Zygote process.
- The new child process inherits the memory of the Zygote using a shared mapping with copy-on-write (COW) semantics.
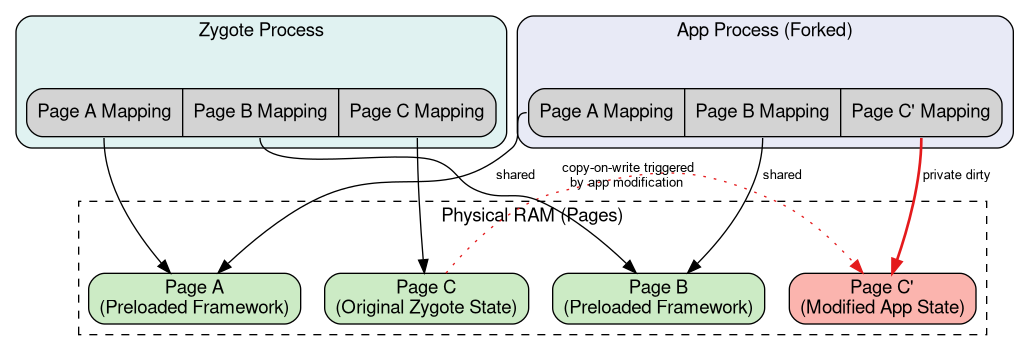
As long as the child process only reads the memory inherited from Zygote, the physical memory pages remain shared between all processes. When a child process modifies a shared page, the kernel transparently creates a private copy of that page for the process. This model allows many processes to share a large portion of their memory—especially the framework code and resources—significantly reducing the overall system memory footprint.
RSS, PSS, and USS
Because memory is shared heavily between processes—primarily through the Zygote model—there are three main ways to account for a process's memory usage:
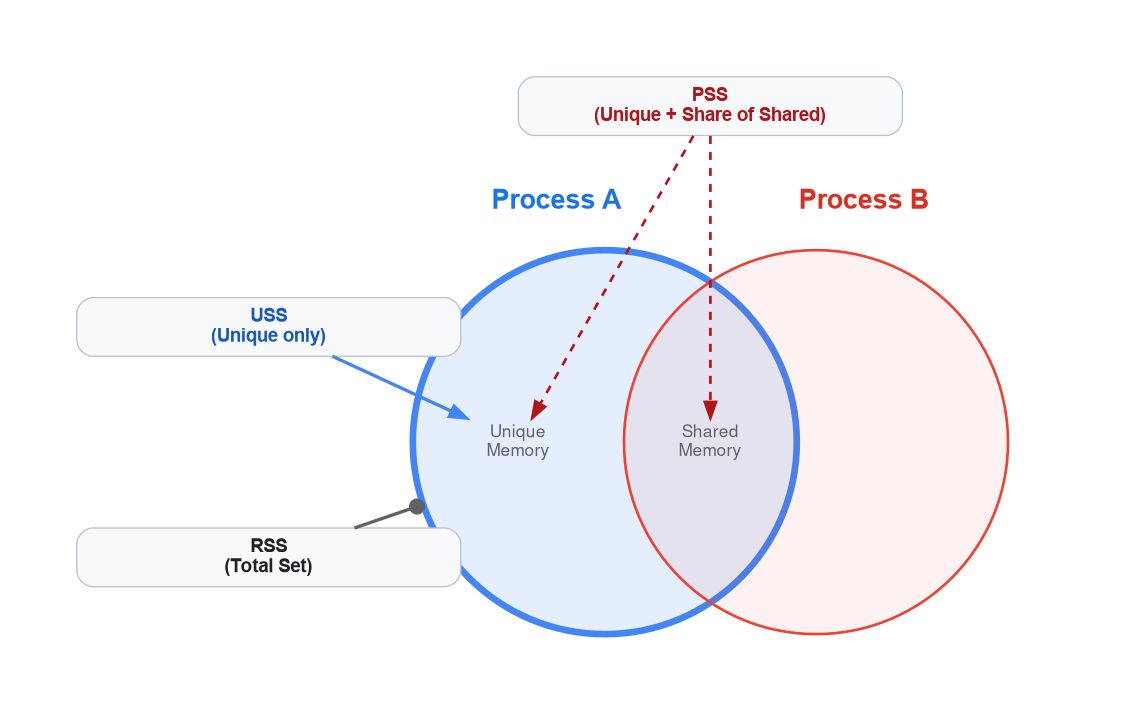
- RSS (Resident Set Size): The total number of pages the process has in RAM. This overestimates usage because it counts shared pages multiple times (once for every process sharing them).
- PSS (Proportional Set Size): The total amount of memory unique to the process, plus its proportional share of shared memory. If a page is shared by 5 processes, each process is charged for 1/5th of that page.
- USS (Unique Set Size): The amount of memory that is unique to the process. This is the memory that would be returned to the system if the process were killed.
Which metrics to use, when?
Choosing the right memory metric depends on what you are trying to measure and the environment in which you are measuring it.
| Metric | Best For | Key Strength | Main Drawback |
|---|---|---|---|
| PSS | System-wide memory snapshots | Accurately proportions shared memory. Summing PSS equals total memory used. | Fluctuates based on other running processes. Bad for comparing a specific app over time. |
| RSS | Tracking an individual app over time, field telemetry | Stable, independent of other processes. Fast and cheap to collect. | Overestimates total usage because it counts shared memory multiple times. |
| USS | Assessing the impact of killing a process | Shows exactly how much memory would be freed if the app was terminated. | Ignores shared memory entirely. |
PSS (Proportional Set Size)
- Best for: Taking a complete system memory snapshot of a certain device at a given time.
- Why: PSS has the useful mathematical property that the sum of the PSS for all running processes equals the total memory used by processes in the system. It perfectly apportions shared memory without double-counting.
- When to avoid: You must not use PSS to compare a specific process across two different snapshots, at different times, or across different devices. Because PSS depends on how many other processes are currently sharing pages with your process, your app's PSS can fluctuate even if your app's actual behavior remains completely unchanged.
RSS (Resident Set Size)
- Best for: Tracking an individual app's memory usage over time, across different Critical User Journeys (CUJs), or comparing between app versions. It is also the most practical choice for field telemetry.
- Why: RSS is more stable than PSS. It tells you about the memory mapped into your process regardless of what other apps are doing. Furthermore, RSS is cheap to collect. Measuring PSS or USS requires scanning complex kernel memory management structures and obtaining locks, which can cause system performance issues (like UI jank) if collected too frequently.
- Field Measurement Best Practices: When collecting data from devices in
the wild, it is usually best to measure anonymous RSS + swap (ZRAM).
- Why anonymous only? File-backed pages (like code, app resources, fonts, or other memory-mapped files) can be evicted by the kernel at any time due to system-wide pagecache pressure. Including file pages in metrics to track a particular app introduces noise from the OS's memory management decisions that may be driven by memory pressure from other apps or the system. Conversely, anonymous memory (like the Java and native heaps) is directly controlled by your app.
- Why add swap? Under memory pressure, the OS will compress anonymous pages and move them to ZRAM (swap). If you only measure resident anonymous memory, your metrics might falsely show a "decrease" in memory usage simply because the system was under pressure and swapped out your pages. Adding swapped memory ensures you account for all the anonymous memory your app has allocated, whether it currently resides in RAM or ZRAM.
USS (Unique Set Size)
- Best for: Determining the immediate system impact of killing a process.
- Why: USS accurately represents the exact amount of memory that would be
immediately reclaimed and returned to the system if the process were
terminated (for instance, by the Low Memory Killer daemon,
lmkd). - How to use: This metric is highly valuable when evaluating persistent processes or background services. If you are assessing the system-wide cost of a background process, USS tells you exactly how much memory the system is sacrificing exclusively to keep that specific process alive.