
This page covers the interaction between kswapd and lmkd on Android,
demonstrating how they work together to manage memory pressure.
Background
Android uses two primary mechanisms to reclaim memory when the system runs low:
kswapd: A standard Linux kernel daemon that reclaims pages by evicting clean file-backed pages or swapping anonymous pages to ZRAM.lmkd: Android's userspace Low Memory Killer daemon. Whenkswapdcannot keep up with memory demands and system pressure increases (as signaled by PSI),lmkdsteps in to kill processes to free up larger chunks of memory.
kswapd and lmkd are two complementary memory reclaim systems. They work to
achieve the same goal (create free memory) but by different means. To compare
and contrast:
- Recoverable vs Destructive:
kswapddrops memory pages that can be read back from storage, or swaps memory pages to other memory partitions or storage that can be read back on demand.lmkdkills processes, which destroys non-volatile state. - Reclaim Bandwidth:
kswapdspends more CPU to reclaim a given amount of free memory thanlmkd, and takes longer to reclaim said memory.lmkdcan reclaim large amounts of memory in short bursts of relatively little effort. Consider that on mobile devices, CPU effort translates not only to latency, but also to battery power.
OOM score buckets
Android assigns an Out-Of-Memory (OOM) score adjustment (oom_score_adj) to
processes based on their importance to the user. Processes with higher scores
are killed first.
Common buckets include:
- Cached (Score >= 900): Processes not currently needed, kept for faster restart.
- Service (Score 500): Processes hosting started services.
- Foreground Service (Score 200): Processes hosting foreground services.
- Foreground (Score 0): The app the user is currently interacting with.
Deep dive: PSI and LMKD triggering
What is PSI?
Pressure Stall Information (PSI) is a Linux kernel feature that provides a canonical way to measure resource shortages. It tracks the time tasks are delayed due to shortages of CPU, memory, and I/O.
Memory PSI: "some" vs "full"
Memory PSI specifically tracks delays caused by memory shortages (e.g., waiting for page reclaim or refaults). It provides two metrics:
some: The percentage of time during which at least one task was stalled on memory. This indicates that memory shortage is affecting performance but some work is still progressing.full: The percentage of time during which all non-idle tasks were stalled simultaneously. This indicates a critical state where the system is completely blocked waiting for memory.
How PSI triggers LMKD
The userspace lmkd daemon registers with the kernel to receive notifications
when PSI thresholds are exceeded (by monitoring /proc/pressure/memory). When
the system experiences high memory pressure (e.g., full stall exceeding a
configured duration), the kernel wakes up lmkd. lmkd then evaluates the
state of the system and decides whether to kill processes, and which ones, based
on their OOM scores and size.
LMKD tuning
LMKD behavior can be tuned using system properties.
Finding tuning values on a device
You can find the current LMKD tuning values on a connected device by running:
adb shell getprop | grep lmk
Common LMKD properties
Here are some of the key properties used to tune LMKD (refer to Android Documentation for full list):
ro.lmk.use_psi: Set totrueto use PSI monitors for memory pressure detection (default on Android 10+).ro.lmk.psi_partial_stall_ms: The threshold forsome(partial) stall duration in milliseconds to trigger a kill (default 70ms on normal devices, 200ms on low-ram devices).ro.lmk.psi_complete_stall_ms: The threshold forfullstall duration in milliseconds to trigger a kill (default 700ms).ro.lmk.kill_heaviest_task: Iftrue, LMKD kills the process using the most memory among candidates in the same OOM bucket.
Relevant tuning values on test device (Google Pixel 8 Pro)
(Note: Typical defaults for high-end devices running Android 15)
ro.lmk.use_psi:truero.lmk.psi_partial_stall_ms:70(typical)ro.lmk.psi_complete_stall_ms:700(typical)ro.lmk.kill_heaviest_task:true
ZRAM and swap verification
ZRAM capacity heavily impacts how fast swap fills up and triggers LMKD kills. You can check ZRAM and swap status on the device using these commands:
# Check ZRAM sizing and usage
adb shell free -m

# Check swap partition details
adb shell cat /proc/swaps
Hands-on exercise: triggering kswapd and lmkd
In this exercise, you will use the KswapdLmkdLab sample app to create
processes in different OOM buckets and then consume memory in the main process
to trigger kswapd and lmkd.
The app is configured to automatically spawn subprocesses and allocate memory to make them attractive targets for LMKD.
1. Create subprocesses
The app automatically spawns the following subprocesses upon launch:
- Cached Process (oom_score_adj >= 900)
- Service Process (oom_score_adj 500)
- Foreground Service Process (oom_score_adj 200)
Verify the processes and their OOM scores using ADB:
adb shell dumpsys activity processes | grep com.android.kswapdlmkdlab
Sample Output Snippet:
    Proc #  0: fg       T/A/TOP  LCMNFUATI  t: 0 18959:com.android.kswapdlmkdlab/u0a358 (top-activity)
    Proc #  1: prcp     b/ /FGS  -------TI  t: 0 19050:com.android.kswapdlmkdlab:foreground/u0a358 (fg-service)
    Proc #  2: svc      b/ /SVC  -------TI  t: 0 19077:com.android.kswapdlmkdlab:service/u0a358 (started-services)
    Proc #  3: cch      b/ /CACC -------TI  t: 0 19014:com.android.kswapdlmkdlab:cached/u0a358 (cch-client-act)
The process state abbreviations correspond to:
fg: Foreground (OOM score 0)prcp: Perceptible (Foreground Service, OOM score 200)svc: Started Service (OOM score 500)cch: Cached Process (OOM score 900)
2. Trigger memory pressure
The app will automatically start allocating memory in the main process. To make the test effective on high-RAM devices, the app also commands the subprocesses to allocate memory (e.g., 500MB each) to make them better targets for LMKD.
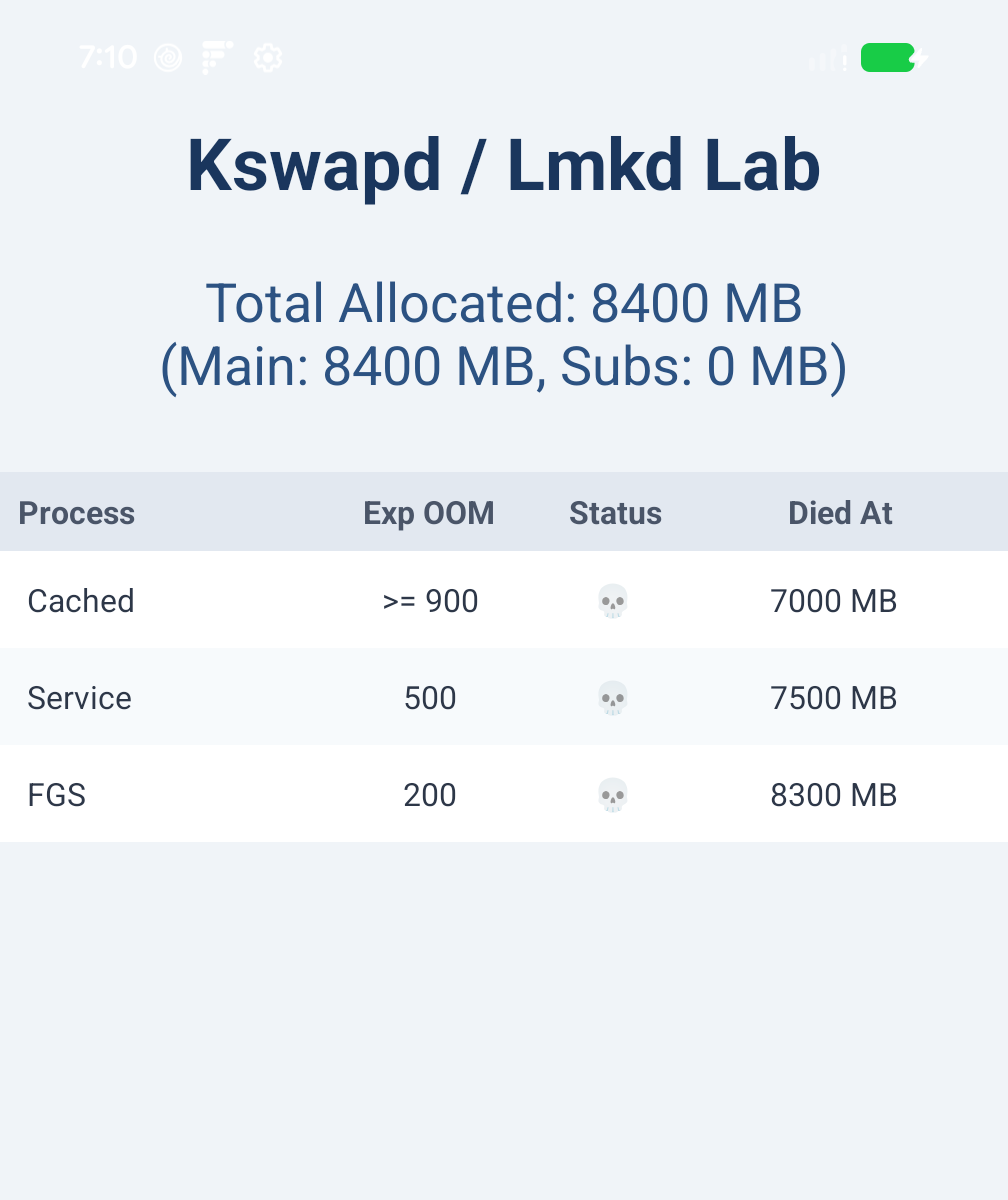
Sample app in action
Here is a screenshot of the app after a test run completed on a Google Pixel 8 Pro (which has approximately 12 GB of total RAM).
Perfetto trace analysis
To capture the interaction, use the following Perfetto configuration to capture scheduling, memory counters, LMK kills, and Pressure Stall Information (PSI).
Perfetto configuration
Capture the interaction by running Perfetto with scheduling, memory counters, LMK kills, and Pressure Stall Information (PSI):
adb shell perfetto -c - --txt -o /data/misc/perfetto-traces/kswapd_lmkd.perfetto-trace <<EOF
buffers: { size_kb: 131072 }
data_sources: {
    config {
        name: "linux.ftrace"
        ftrace_config {
            ftrace_events: "lowmemorykiller/lowmemory_kill"
            ftrace_events: "vmscan/mm_vmscan_kswapd_wake"
            ftrace_events: "vmscan/mm_vmscan_kswapd_sleep"
            ftrace_events: "psi/psi_event"
        }
    }
}
duration_ms: 180000
EOF
Review the trace
Below is a screenshot taken from a trace showing the period of time shortly
before the :cached (most killable) process is killed, until the :foreground
(least killable) process is killed.
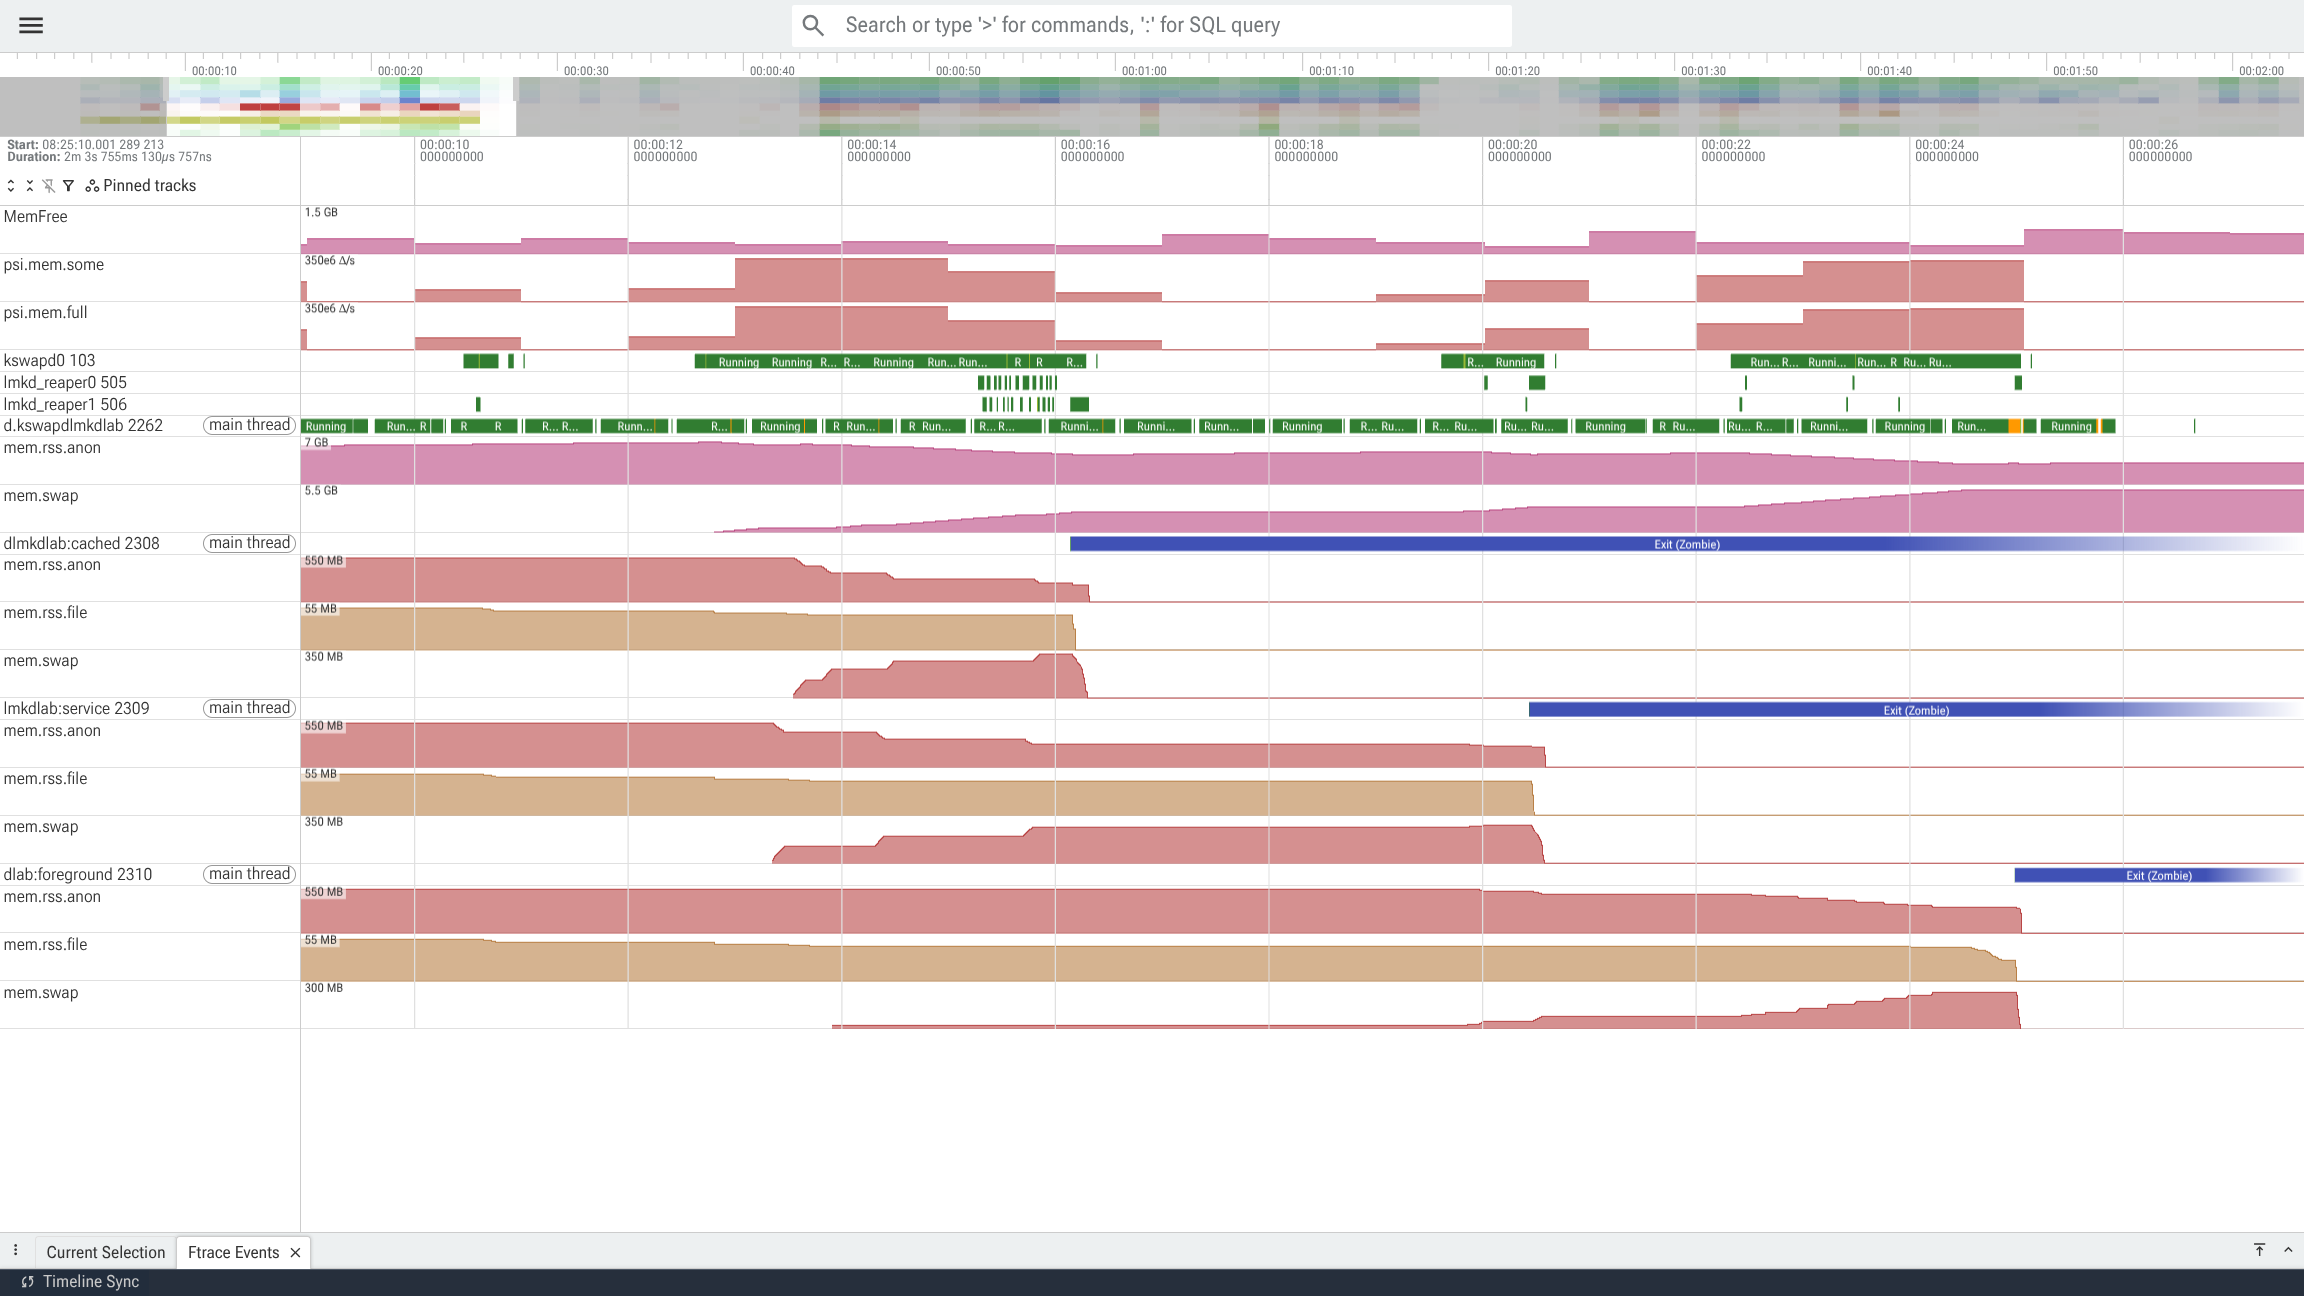
You can see that MemFree is already fairly low and is under constant pressure.
kswapd is constantly working and relieves pressure by dropping mem.rss.file
pages and moving mem.rss.anon to mem.swap from all the kswapdlmkdlab
processes (the main process and the subprocesses), and likely from other
processes not shown in this screenshot. At the same time, the kswapdlmkdlab
app continues to allocate memory, increasing pressure faster than kswapd can
reclaim.
When the pressure becomes too high, as seen in psi.mem being high for a
sufficient period of time, lmkd wakes up and kills some processes. You can see
that lmkd respects the OOM scores, killing kswapdlmkdlab:cached first, then
:service, then :foreground.
Review the timeline of events and reflect on the following:
- How
kswapdandlmkdcomplement each other:kswapdis the first to respond to memory pressure, butlmkdhelps whenkswapd's reclaim bandwidth is not meeting allocation demand. - The rate of memory being freed: observe the CPU time spent in
kswapdand the memory being reclaimed by droppingmem.rss.fileor swappingmem.rss.anontomem.swap. Compare this with the short bursts of activity inlmkdthat result in large amounts of process private memory being released.
Queries
Run these queries in the Perfetto UI (Query SQL) to extract data from your trace.
1. kswapd activity
To find when the kernel's swap daemon was active and running, execute:
SELECT ts, dur, state
FROM thread_state
JOIN thread USING (utid)
WHERE thread.name LIKE 'kswapd%'
  AND state = 'Running'
LIMIT 5;
Sample Output:
| ts | dur | state |
|---|---|---|
| 30317633052969 | 159180 | Running |
| 30317633398347 | 3999186 | Running |
| 30317638448111 | 1847941 | Running |
| 30317641455354 | 1031006 | Running |
| 30317643272615 | 888387 | Running |
2. LMKD kills
LMKD writes low-memory kills to the instant table. To query all LMKD kills:
SELECT ts, name
FROM instant
WHERE name LIKE 'lmk,%'
ORDER BY ts ASC;
The event name format is:
lmk,<pid>,<kill_reason>,<oom_score_adj>,<min_oom_score>,<max_thrashing>.
kill_reason: An integer indicating whylmkddecided to kill the process (defined insystem/memory/lmkd/statslog.h):0:PRESSURE_AFTER_KILL1:NOT_RESPONDING2:LOW_SWAP_AND_THRASHING(ZRAM swap space is extremely low and thrashing occurred)3:LOW_MEM_AND_SWAP(System is low on both free memory and ZRAM swap)4:LOW_MEM_AND_THRASHING5:DIRECT_RECL_AND_THRASHING6:LOW_MEM_AND_SWAP_UTIL7:LOW_FILECACHE_AFTER_THRASHING8:LOW_MEM9:DIRECT_RECL_STUCK
max_thrashing: The maximum page thrashing percentage at the time of the kill.
Sample Output:
| ts | name |
|---|---|
| 30326148679967 | lmk,2308,3,900,201,0 |
| 30330439763710 | lmk,2309,3,500,201,0 |
| 30334985999837 | lmk,2310,2,200,0,307 |
Visualization
To visualize the data, you can use the following gnuplot script to plot system free memory, kswapd activity, lmkd kills, and PSI on a single time series. The script assumes it is run from the Android build top directory.
Sample output plot
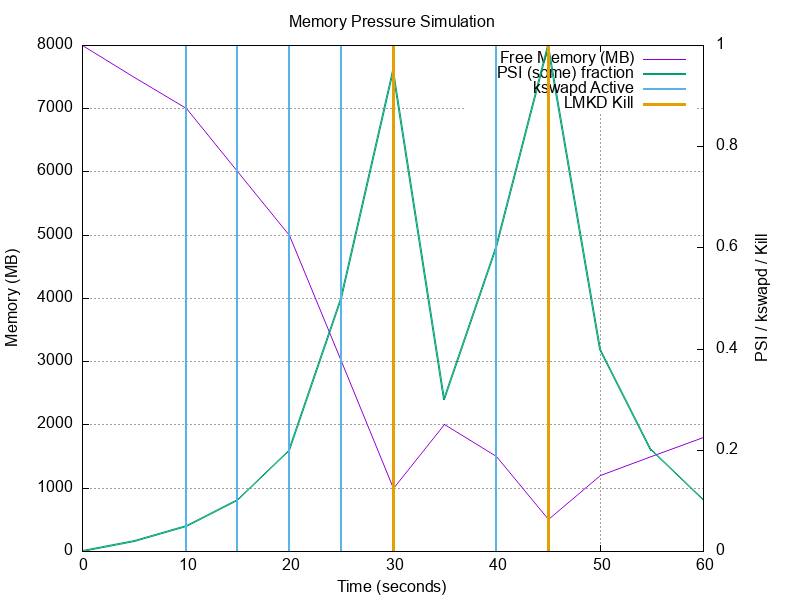
The following plot was generated using the script above with sample data representative of the test run.
Plot Explanation:
This plot illustrates the dynamic interaction between the different memory management components during the stress test:
- Free Memory Drop: As the main app allocates memory, the system free memory (purple line) steadily decreases.
- kswapd Activation: When free memory drops below certain watermarks,
kswapdwakes up (blue impulses) to reclaim memory by swapping to ZRAM. This is visible as intermittent spikes. - PSI Spikes: As
kswapdstruggles to keep up with the high rate of allocation, threads start stalling on memory allocation, causing the PSI (Pressure Stall Information) (green line) to spike. - LMKD Kills: When PSI reaches critical levels (e.g., exceeding the
ro.lmk.psi_complete_stall_msthreshold conceptually) and free memory is extremely low,lmkdintervenes by killing low-priority processes (orange impulses at time 30 and 45) to free up large chunks of memory. Notice that immediately after a kill, free memory rises and PSI drops, showing the effectiveness of the kill in relieving pressure. ________________________________________________________________________________
← Memory reclaim: eviction and swap | ↑ Up