
The Profile GPU Rendering tool indicates the relative time that each stage of the rendering pipeline takes to render the previous frame. This knowledge can help you identify bottlenecks in the pipeline so that you can optimize to improve your app's rendering performance.
This page briefly explains what happens during each pipeline stage and discusses issues that can cause bottlenecks. Before reading this page, you should be familiar with the information presented in Profile GPU rendering speed. In addition, to understand how all of the stages fit together, it may be helpful to review how the rendering pipeline works.
Visual representation
The Profile GPU Rendering tool displays stages and their relative times in the form of a graph: a color-coded histogram. Figure 1 shows an example of such a display.
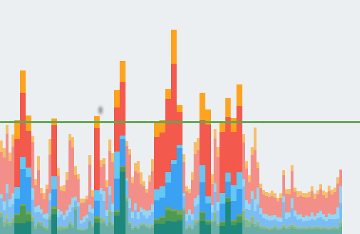
Each segment of each vertical bar displayed in the Profile GPU Rendering graph represents a stage of the pipeline and is highlighted using a specific color in the bar graph. Figure 2 shows a key to the meaning of each displayed color.

Once you understand what each color signifies, you can target specific aspects of your app to try to optimize its rendering performance.
Stages and their meanings
This section explains what happens during each stage as well as bottleneck causes to look out for.
Input handling
The input handling stage of the pipeline measures how long the app spent handling input events. This metric indicates how long the app spent executing code called as a result of input event callbacks.
When this segment is large
High values in this area are typically a result of too much work, or too-complex work, occurring inside the input-handler event callbacks. Since these callbacks always occur on the main thread, solutions to this problem focus on optimizing the work directly or offloading the work to a different thread.
Scrolling through a
LazyColumn
or LazyRow
can also appear in this phase. Once a user touch qualifies as a scroll, the lazy
list consumes touch events to compose and lay out items dynamically. If your app
performs custom work responding to scroll position
changes, it's important to make this operation as fast as possible to prevent frame
drops. Profiling tools like CPU Profiler in Android Studio or Perfetto can help you
investigate further. See
Overview of system tracing for more information.
Animations
The animations phase shows you how long it took to evaluate all the animation states
that were running in that frame. Some common animation APIs in Compose are
animate*AsState,
Transition,
and Animatable.
In addition, the Recomposer runs during this phase to process snapshot state
changes and update compositions. This means recomposition overhead often surfaces
directly within the animation stage.
For Jetpack Compose UIs, include the Compose Runtime Tracing library to see detailed composition traces alongside system events.
When this segment is large
High values in this area are typically a result of work that's executing due
to state changes driven by the animation. For example, a fling animation, which scrolls your LazyColumn
or LazyRow, causes rapid composition, measurement, and allocation of new list items.
Measure
To draw your composables on the screen, Android executes three phases across layout nodes in your UI tree.
First, the system measures the layout nodes. Every composable has specific constraints and modifiers that describe the size limits of the object on the screen. Some composables can have a specific, fixed size; others have a size that adapts to the constraints passed down by the parent layout container.
Second, the system places the layout nodes. Once Compose calculates the sizes of child nodes during the measurement phase, it can proceed with the placement phase, in which it sizes and positions the layout nodes on the screen.
The system always performs this single-pass layout for efficiency. When a composable layout is invalidated, Compose measures that specific node and only propagates layout updates up to parent hierarchies if the child changes its size or constraints.
When this segment is large
A large segment in this area means the app is spending too much time in the layout phase, which consists of positioning and determining the size of layout nodes. These operations include executing measurement and placement modifiers for composables, which can delay frame preparation if the layout tree is overly complex. In these cases, addressing performance involves benchmarking your Compose app and following performance best practices.
Use CPU Profiler in Android Studio or Perfetto to inspect layout passes and identify bottlenecks. See Overview of system tracing for more information.
Draw
The draw stage translates rendering operations, such as drawing a background, shape, or text, into a sequence of native drawing commands. The system captures these commands into a display list for GPU execution.
The Draw bar records how much time it takes to complete capturing the commands into the display list, for all the layout nodes that needed to be updated on the screen for this frame. The measured time also applies to any custom drawing logic you may have inside draw modifiers or a Canvas composable.
When this segment is large
In simplified terms, you can understand this metric as showing how long it
took to run all of the drawing commands for each invalidated layout node.
This measurement includes any time spent dispatching these commands to child nodes
and vector drawables. For this reason, when you see this bar spike, the cause could
be that many composables suddenly became invalidated. Invalidation makes it
necessary to re-execute drawing commands and regenerate layout nodes' display
lists. Alternatively, a lengthy time may be the result of a few custom composables
or canvases that have some extremely complex logic in their
DrawScope
implementation.
Additionally, Compose often handles its internal measure and layout passes within what the platform considers the Draw phase. Consequently, an elevated Draw bar can be caused by expensive or excessive internal measure/layout operations rather than drawing commands alone. When in doubt, capture a Perfetto trace to see whether the overhead stems from drawing routines or Compose measure and layout passes.
Upload
The upload metric represents the time it takes to transfer bitmap objects from CPU memory to GPU memory during the current frame.
As different processors, the CPU and the GPU have different RAM areas dedicated to processing. When you draw a bitmap on Android, the system transfers the bitmap to GPU memory before the GPU can render it to the screen. Then, the GPU caches the bitmap so that the system doesn't need to transfer the data again unless the texture gets evicted from the GPU texture cache.
Note: On Lollipop devices, this stage is purple.
When this segment is large
All resources for a frame need to reside in GPU memory before they can be used to draw a frame. This means that a high value for this metric could mean either a large number of small resource loads or a small number of very large resources. A common case is when an app displays a single bitmap that's close to the size of the screen. Another case is when an app displays a large number of thumbnails.
To shrink this bar, you can employ techniques such as:
- Ensuring your bitmap resolutions are not much larger than the size at which they will be displayed. For example, avoid displaying a 1024x1024 image as a 48x48 image.
- Taking advantage of modern libraries like Coil to asynchronously pre-upload a bitmap before the next sync phase.
Issue commands
The issue commands segment represents the time it takes to issue all the commands necessary for drawing display lists to the screen.
For the system to draw display lists to the screen, it sends the necessary commands to the GPU. Typically, it performs this action through the OpenGL ES API.
This process takes some time, as the system performs final transformation and clipping for each command before sending the command to the GPU. Additional overhead then arises on the GPU side, which computes the final commands. These commands include final transformations and additional clipping.
When this segment is large
The time spent in this stage is a direct measure of the complexity and quantity of display lists that the system renders in a given frame. For example, having many draw operations, especially in cases where there's a small inherent cost to each draw primitive, could inflate this time. For example:
for (i in 0 until 1000) {
    canvas.drawPoint()
}
is a lot more expensive to issue than:
canvas.drawPoints(thousandPointArray)
There isn't always a 1:1 correlation between issuing commands and actually drawing display lists. Unlike the issue commands bar, which captures the time it takes to send drawing commands to the GPU, the draw metric represents the time that it took to capture the issued commands into the display list.
This difference arises because the display lists are cached by the system wherever possible. As a result, there are situations where a scroll, transform, or animation requires the system to re-send a display list, but not have to actually rebuild it—recapture the drawing commands—from scratch. As a result, you can see a high issue commands bar without seeing a high draw commands bar.
Swap buffers
Once Android finishes submitting its display list to the GPU, the system issues one final command to tell the graphics driver that it's done with the current frame. At this point, the driver can finally present the updated image to the screen.
When this segment is large
It's important to understand that the GPU executes work in parallel with the CPU. The Android system issues draw commands to the GPU and then moves on to the next task. The GPU reads those draw commands from a queue and processes them.
In situations where the CPU issues commands faster than the GPU consumes them, the communications queue between the processors can become full. When this occurs, the CPU blocks and waits until there is space in the queue to place the next command. This full-queue state arises often during the swap buffers stage, because at that point, a whole frame's worth of commands have been submitted.
The key to mitigating this problem is to reduce the complexity of work occurring on the GPU, in similar fashion to what you would do for the issue commands phase.
Miscellaneous
In addition to the time it takes the rendering system to perform its work, there's an additional set of work that occurs on the main thread and has nothing to do with rendering. Time that this work consumes is reported as miscellaneous time. Miscellaneous time generally represents work that might be occurring on the UI thread between two consecutive frames of rendering.
When this segment is large
If this value is high, it is likely that your app has callbacks, intents, or other work that should be happening on another thread. Tools such as CPU Profiler in Android Studio or Perfetto can provide visibility into the tasks that are running on the main thread. This information can help you target performance improvements. See Overview of system tracing for more information.