
The following are new features in Android Studio Hedgehog.
IntelliJ IDEA 2023.1 platform update
Android Studio Hedgehog includes the IntelliJ IDEA 2023.1 updates, which improve the Studio IDE experience. For details on the changes, see the IntelliJ IDEA 2023.1 release notes.
Analyze Android vitals in App Quality Insights
App Quality Insights now includes Android vitals data, so you can more easily access core metrics collected by Google Play and improve your user experience. Use Android vitals to address issues related to app stability to help improve the quality of your app on Google Play.
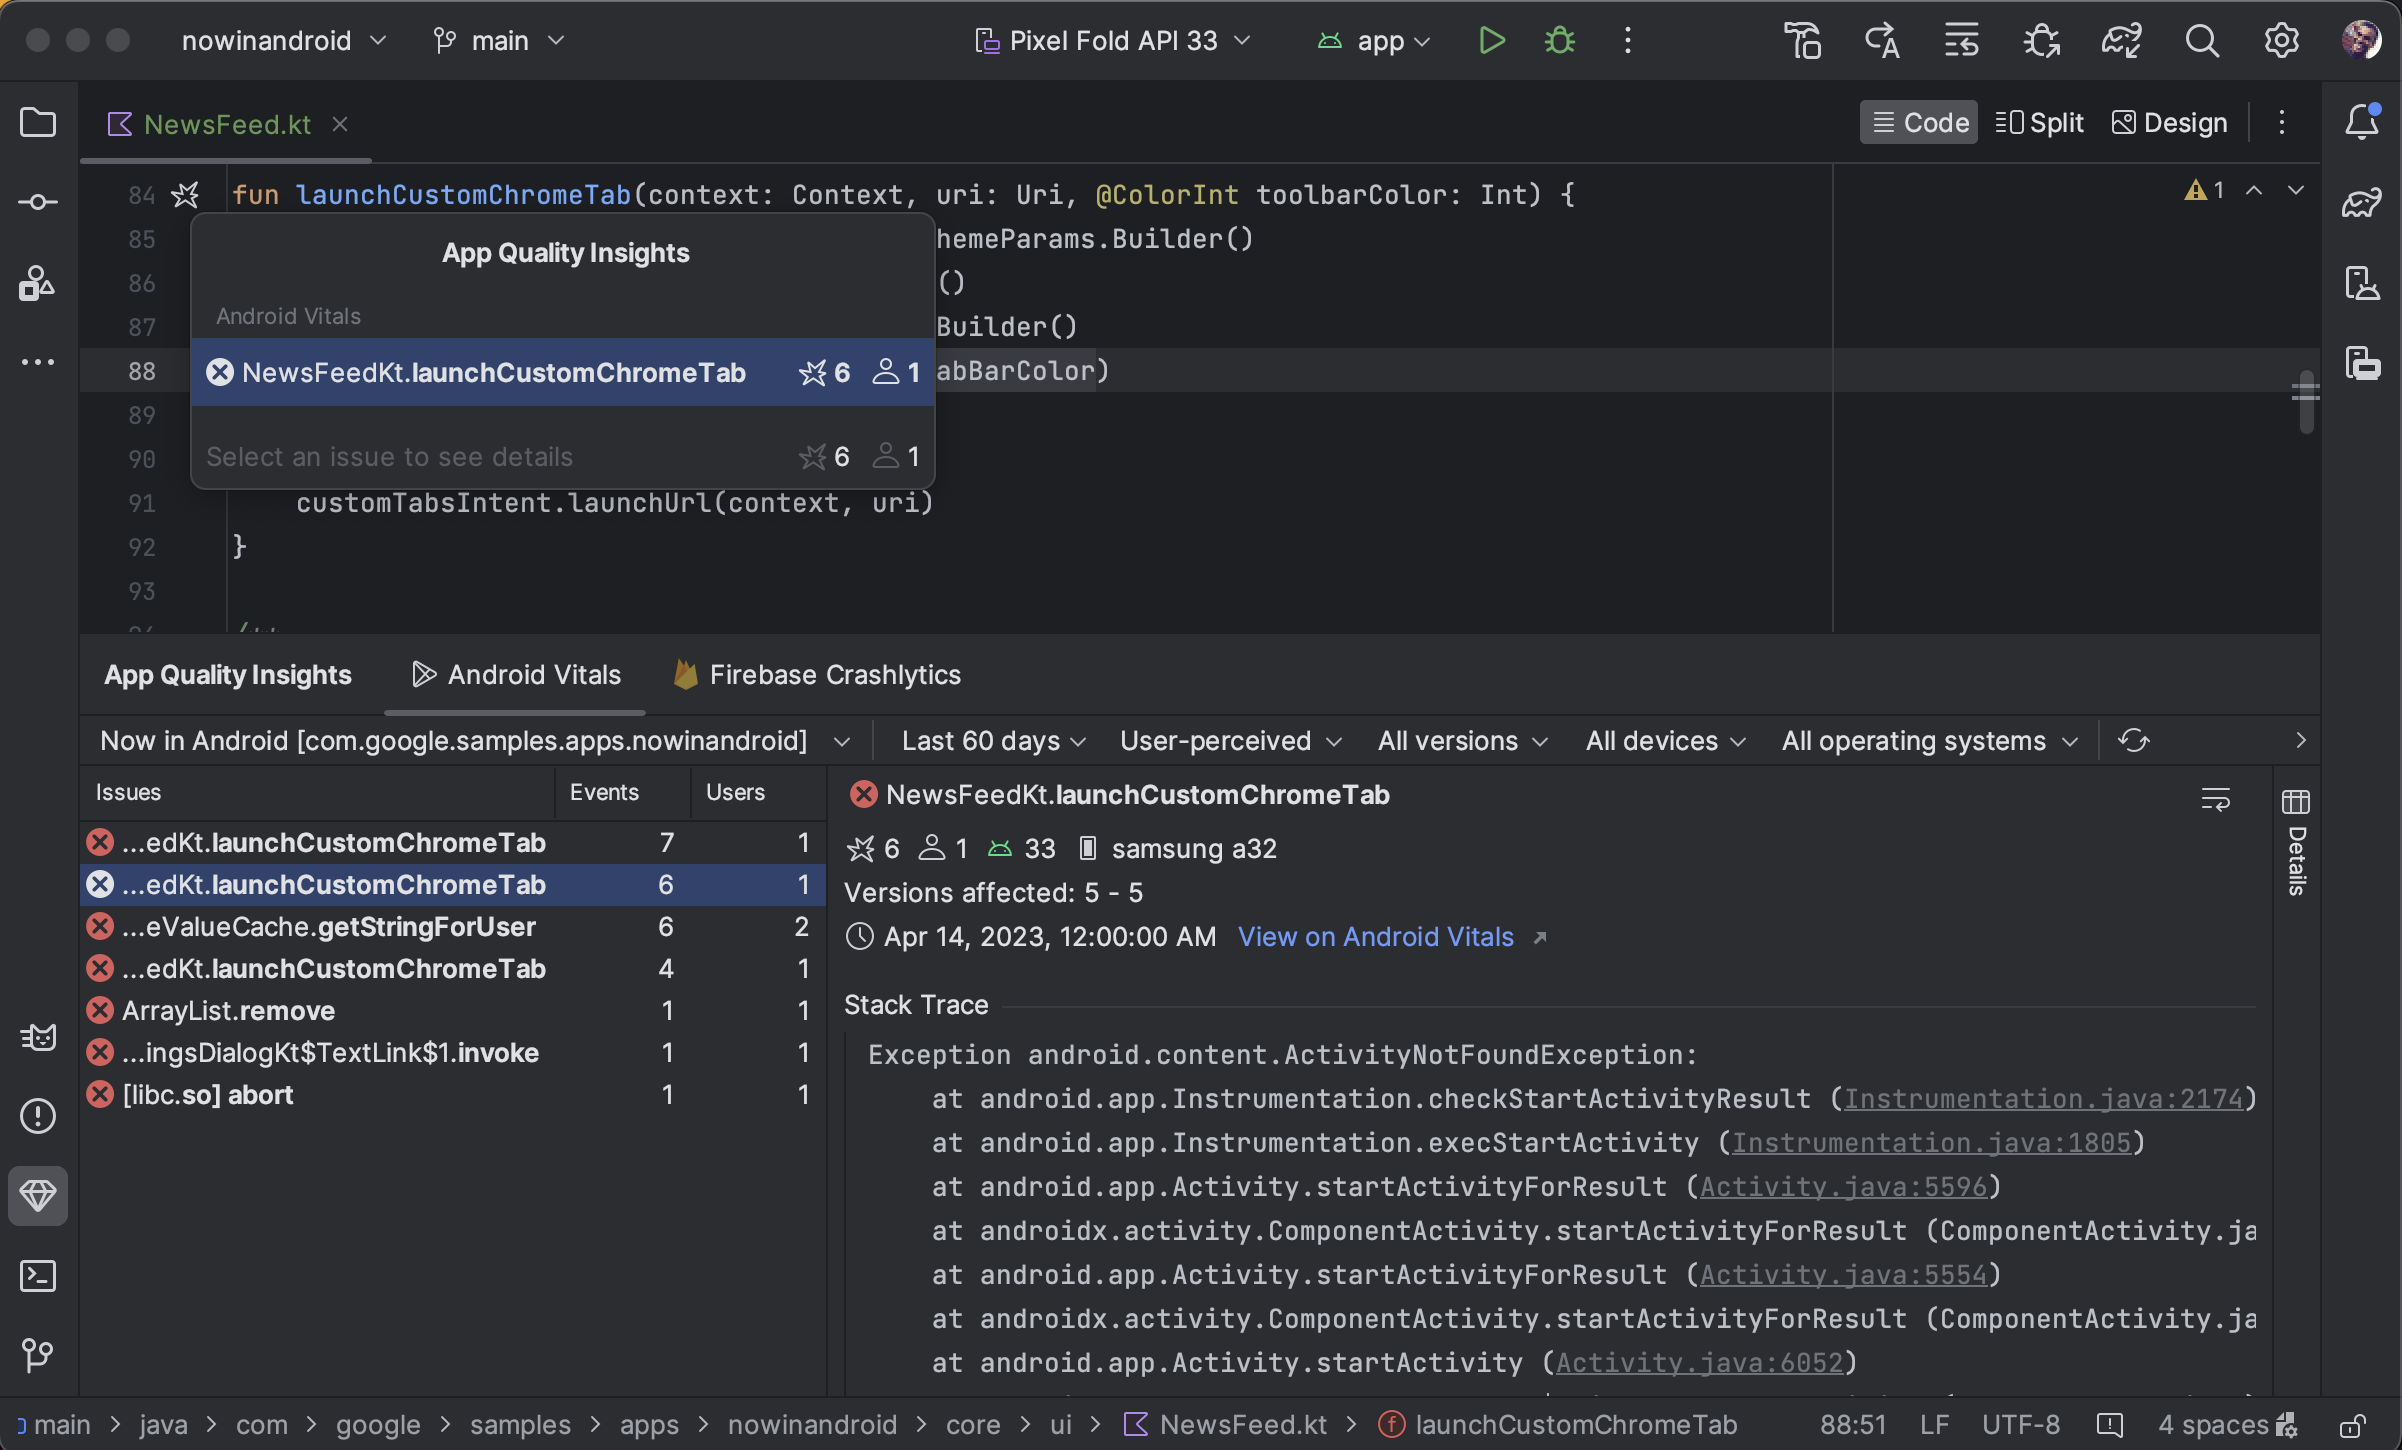
You can view Android vitals issues, filter them, and jump from stack trace to code all from the App Quality Insights tool window. To get started, follow these steps:
- Sign in to your developer account in Android Studio using the profile icon
 at
the end of the toolbar.
at
the end of the toolbar. - Open App Quality Insights by clicking the tool window in Android Studio or clicking View > Tool Windows > App Quality Insights.
- Click the Android vitals tab within App Quality Insights.
Different numbers between Android vitals and Crashlytics
Note that Android vitals and Crashlytics might report different values for the numbers of users and events associated with the same crash. These discrepancies happen because Play and Crashlytics can catch crashes at different times and for different users. Here are a couple reasons for why the Play and Crashlytics counts might differ:
- Play catches crashes starting at boot time, whereas Crashlytics catches crashes that happen after the Crashlytics SDK initializes.
- If a user opts out of crash reporting when they get a new phone, those crashes aren't reported to Play; however, Crashlytics catches crashes based on an app's own privacy policy.
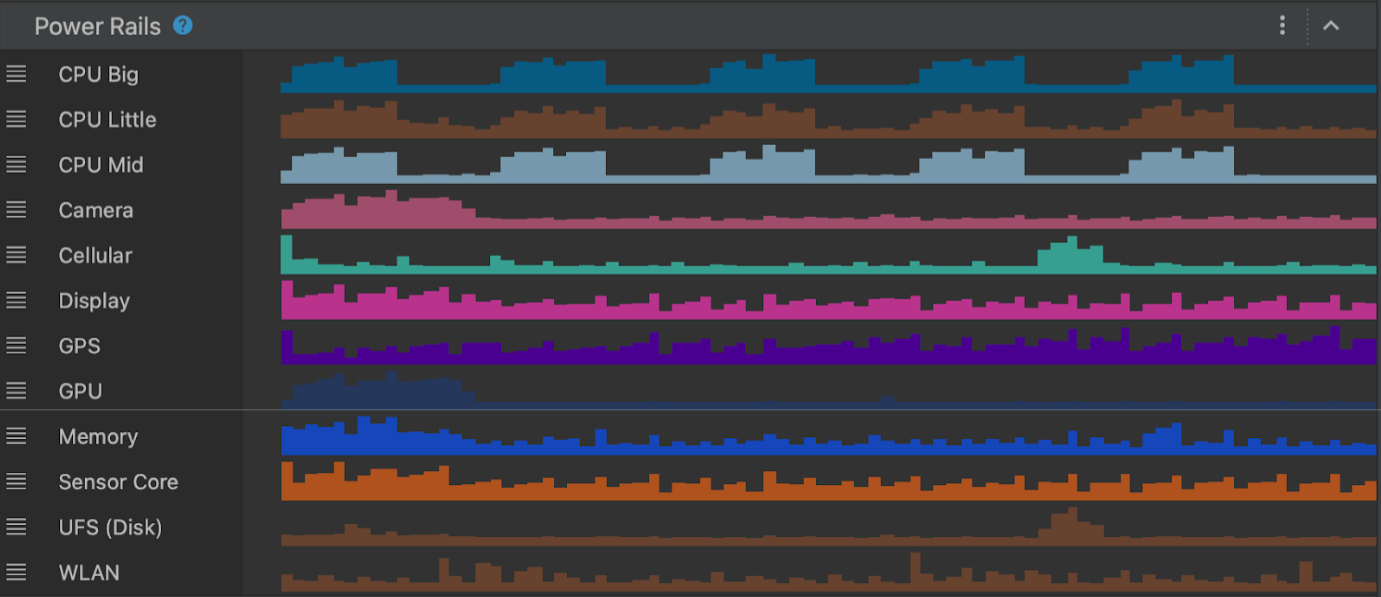
New Power Profiler
Starting in Android Studio Hedgehog, the Power Profiler shows power consumption on devices. You can view this new data in the On Device Power Rails Monitor (ODPM). The ODPM segments the data by subsystems called Power Rails. See Profileable power rails for a list of supported subsystems.
The System Trace records and displays power consumption data. It is part of the CPU profiler. This data helps you to visually correlate power consumption of the device with the actions occurring in your app. The Power Profiler enables visualizing this data.
To view the data from the new Power Profiler, take a system trace on a Pixel 6+ device:
- Select View > Tool Windows > Profiler.
- Click anywhere in the CPU timeline to open the CPU Profiler and start a system trace.
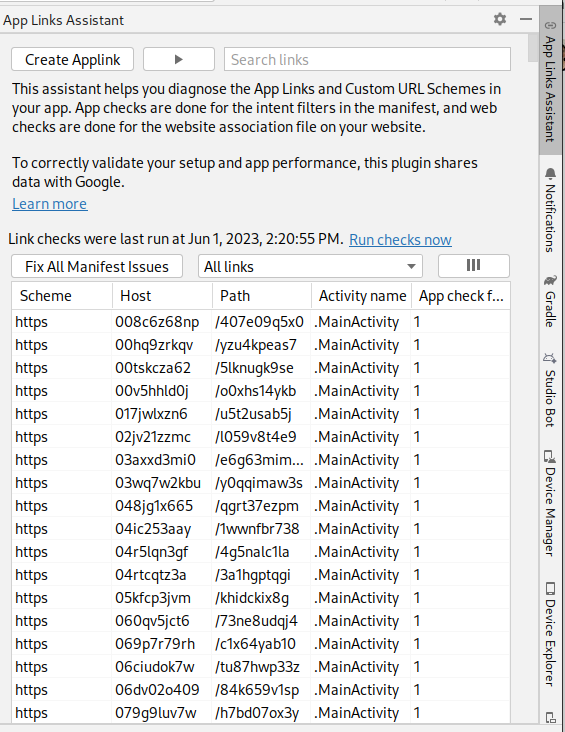
New App Links Assistant
The new App Links Assistant provides a comprehensive overview of the deep links
set up in your app. The Assistant displays all existing deep links in the app's
AndroidManifest.xml file, validates whether the configuration for those deep
links is correct, and provides a quick way to automatically fix the
misconfigurations.
To open the App Links Assistant navigate to Tools > App Links Assistant in Android Studio. For more information about app links, see Add Android App Links.
Live Edit updated manual mode shortcut
Live Edit in Android Studio Hedgehog includes a new shortcut for manual mode (Push Manually): Control+\ (Command+\ for macOS). Manual mode is helpful in situations where you want to have precise control over when updates are deployed to the running application. For example, if you're making a large scale change in a file and don't want any intermediate state to be reflected on the device. You can choose between Push Manually and Push Manually on Save in the Live Edit settings or using the Live Edit UI indicator. For more information, see the video clip in Live Edit for Jetpack Compose.
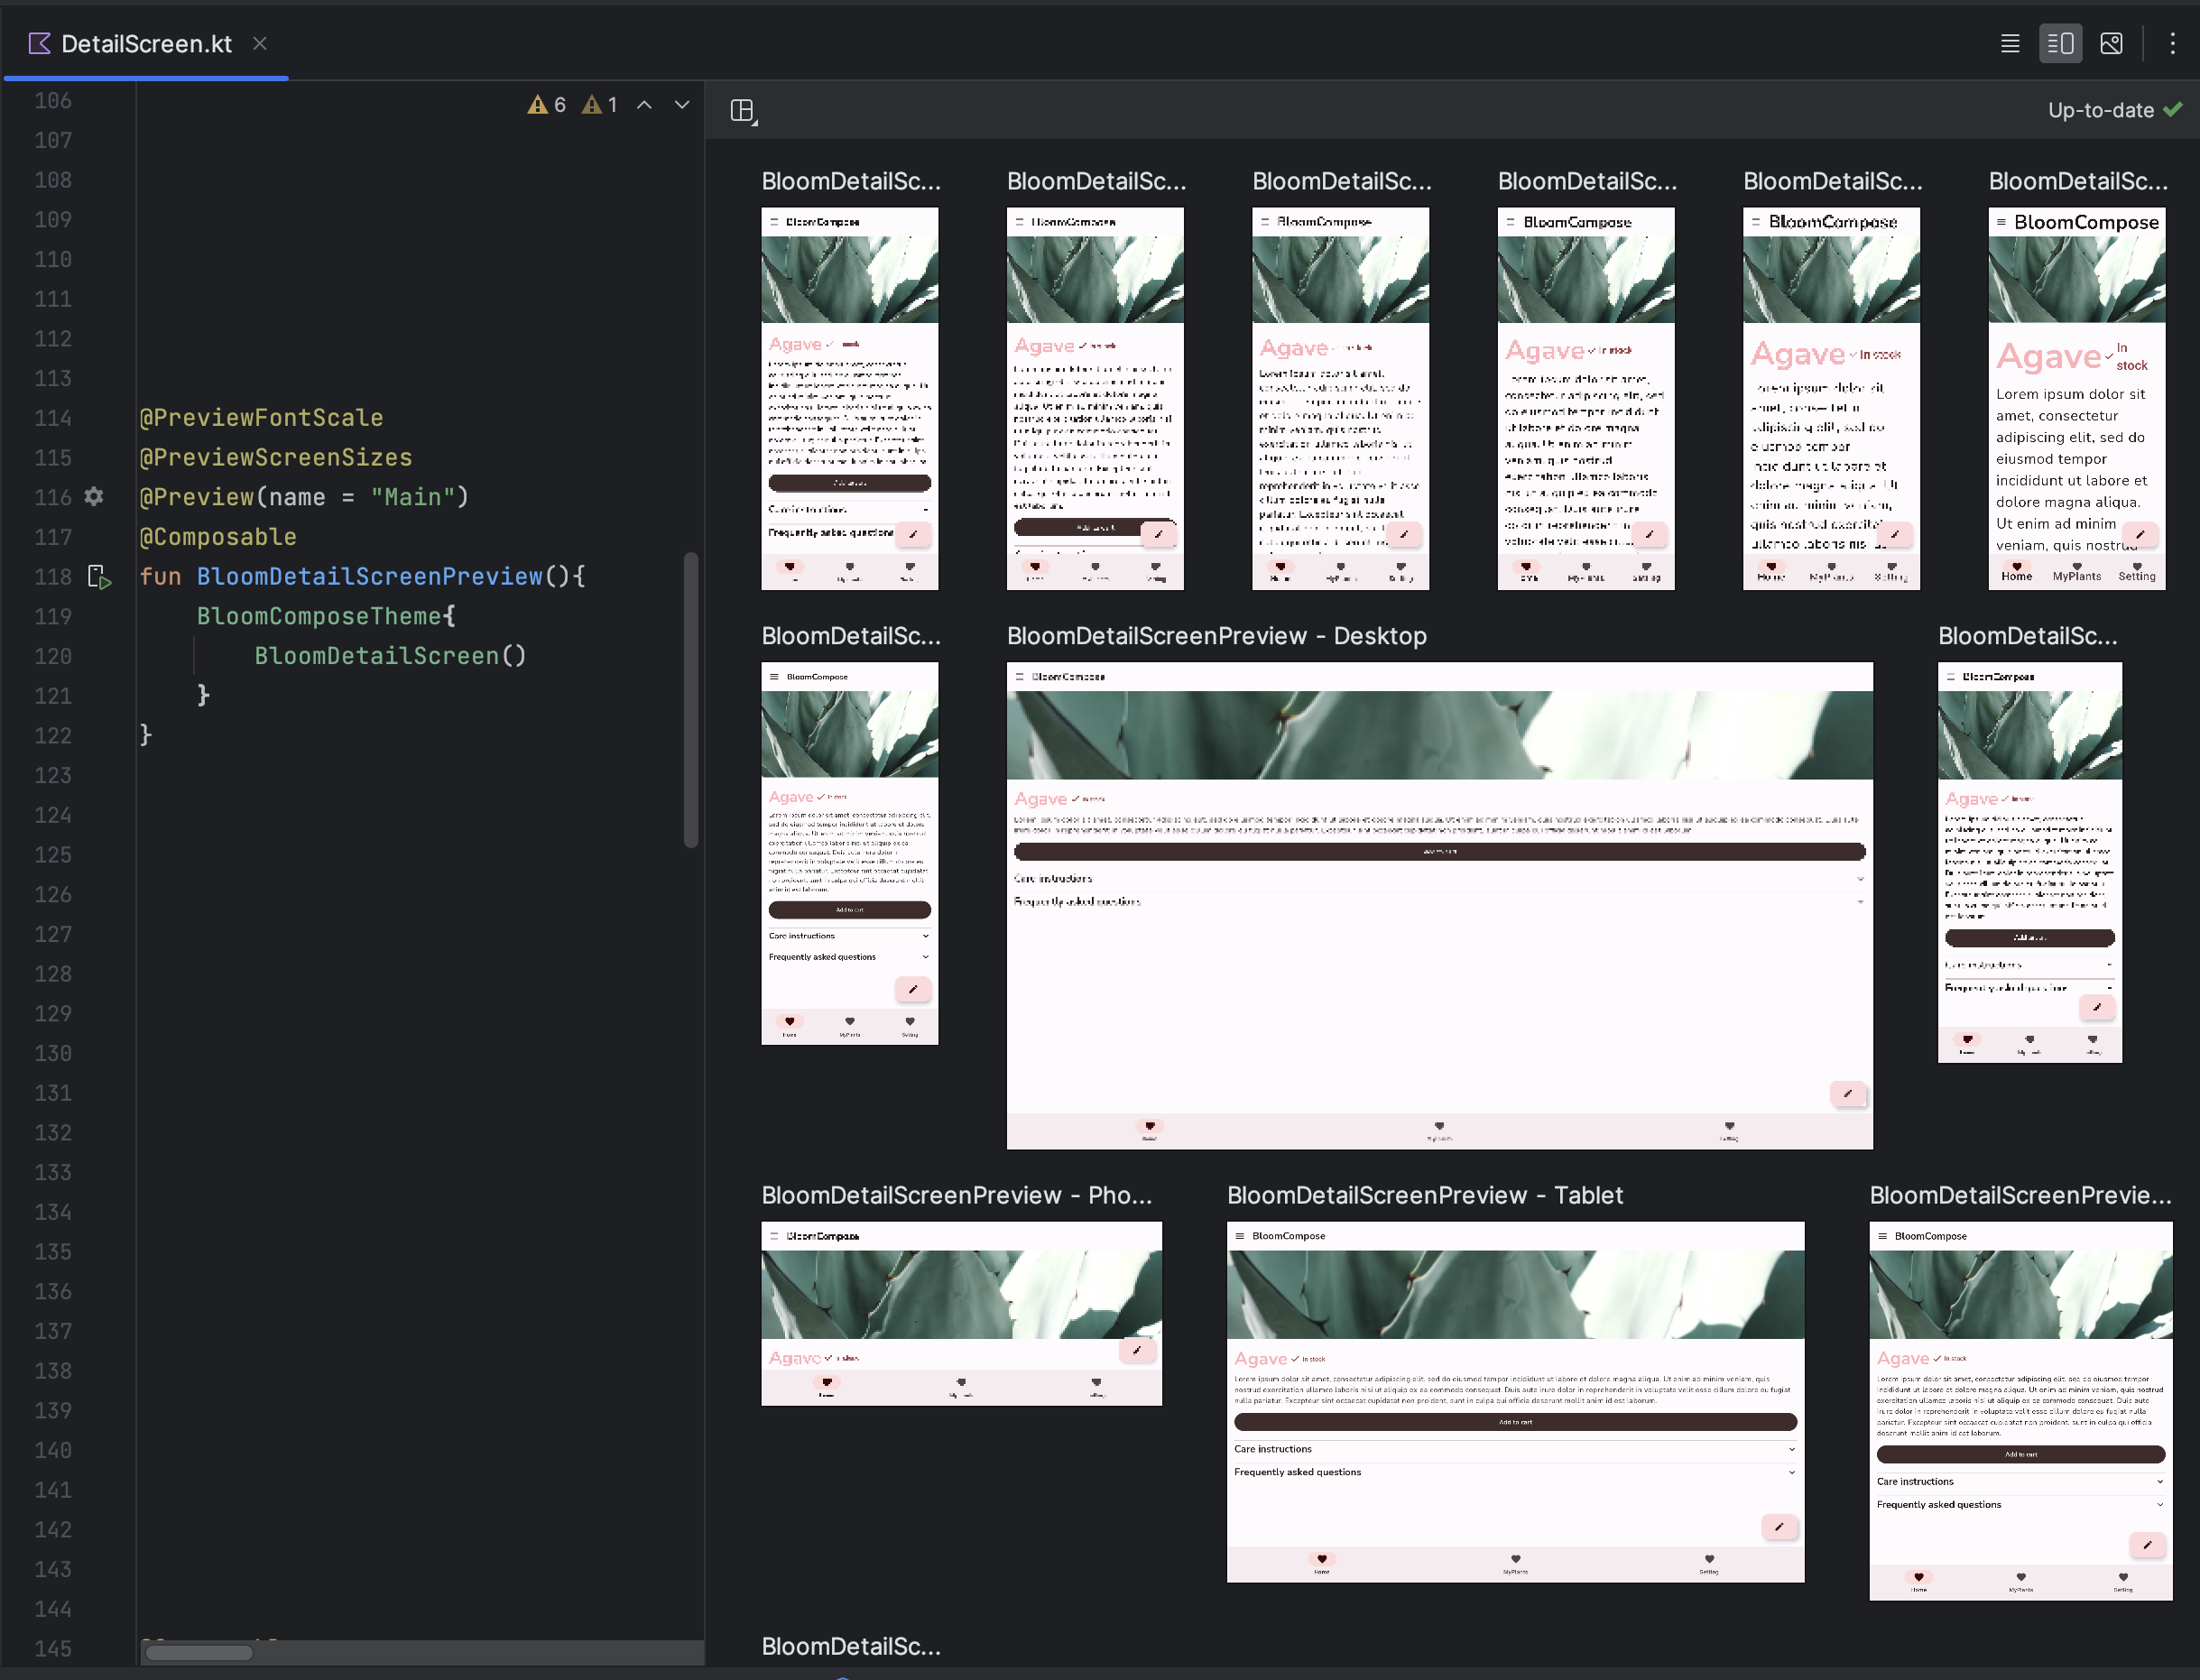
Compose Multipreview templates
androidx.compose.ui:ui-tooling-preview 1.6.0-alpha01+ introduces new
Multipreview API
templates: @PreviewScreenSizes, @PreviewFontScales, @PreviewLightDark,
and @PreviewDynamicColors, so that with one single annotation, you can
preview your Compose UI in common scenarios.
Compose Preview Gallery Mode
In Android Studio Hedgehog, a new Gallery mode has been introduced in Compose Preview, which lets you focus on one preview at a time and save resources on rendering. We recommend using Gallery Mode when you need to iterate on your app's UI and switching to other modes, for example Grid or List, when you need to see UI variants.
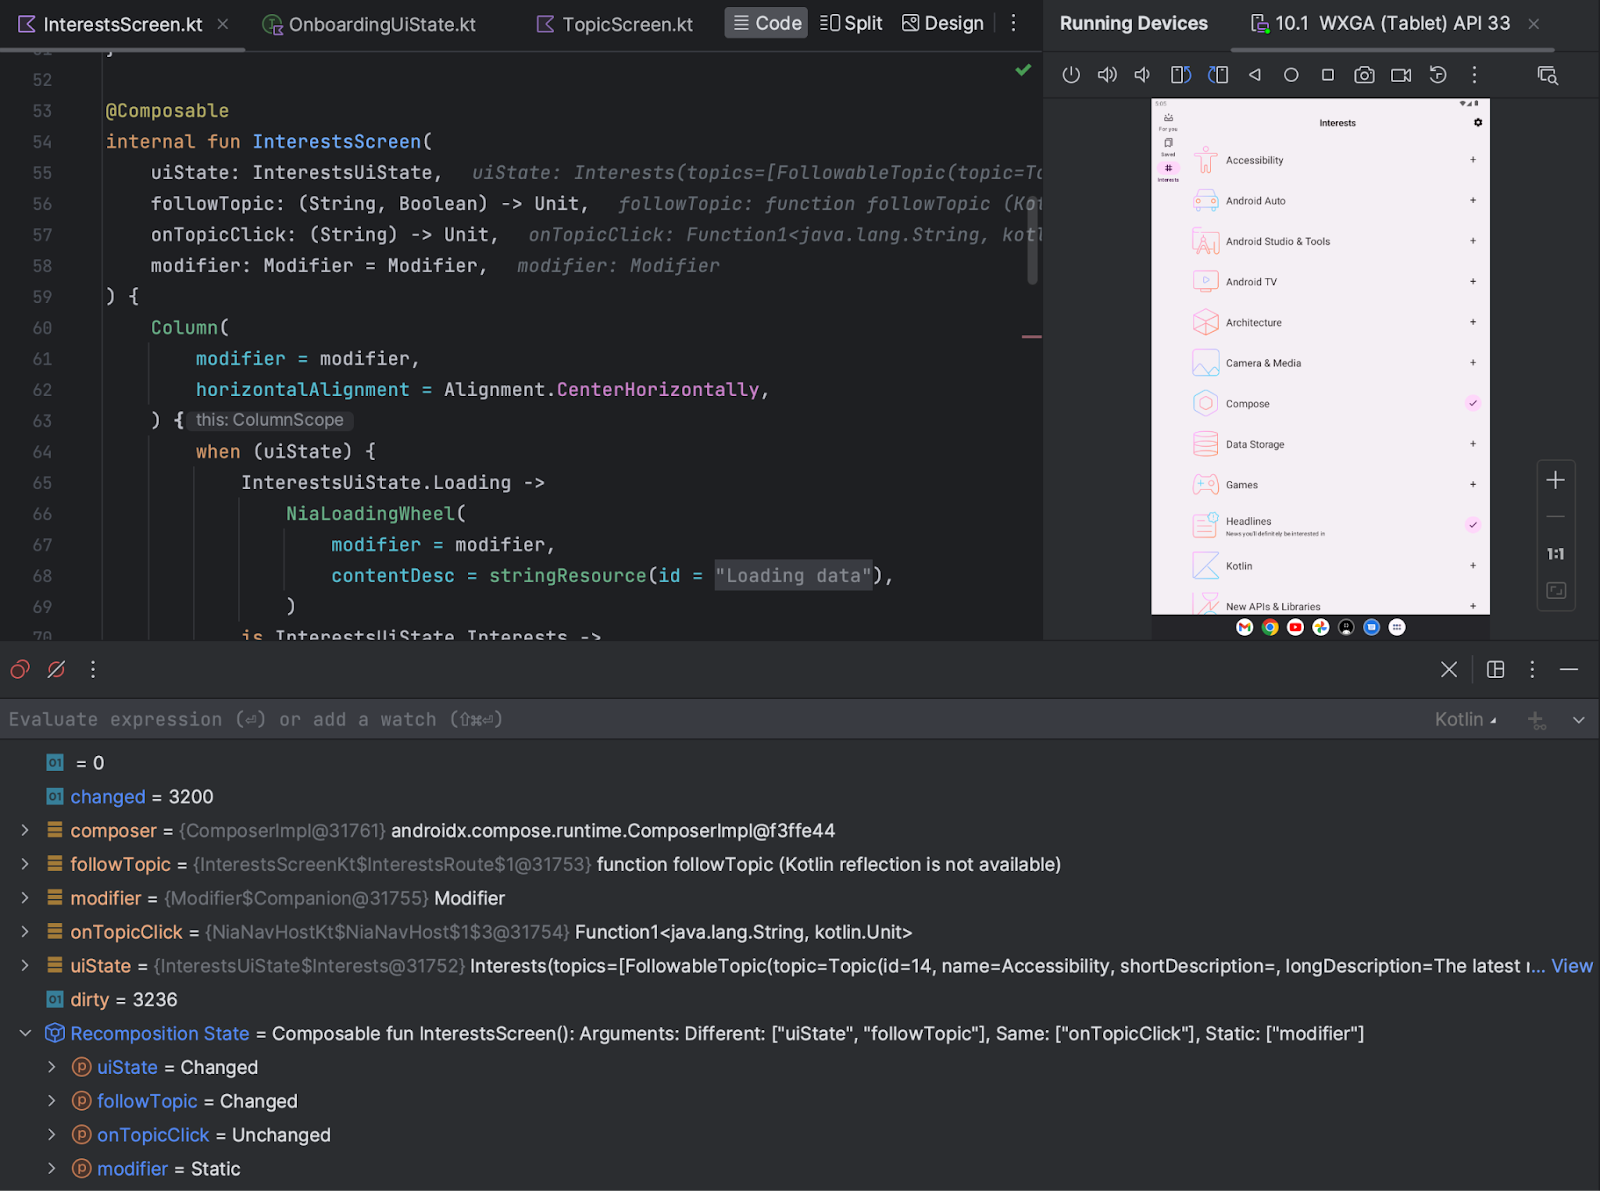
Compose state information in debugger
When parts of your Compose UI recompose unexpectedly, it's sometimes difficult to understand why. Now, when setting a breakpoint on a composable function, the debugger lists the parameters of the composable and their state, so you can more easily identify what changes might have caused the recomposition. For example, when you pause on a composable, the debugger can tell you exactly which parameters have "Changed" or have remained "Unchanged", so you can more efficiently investigate the cause of the recomposition.
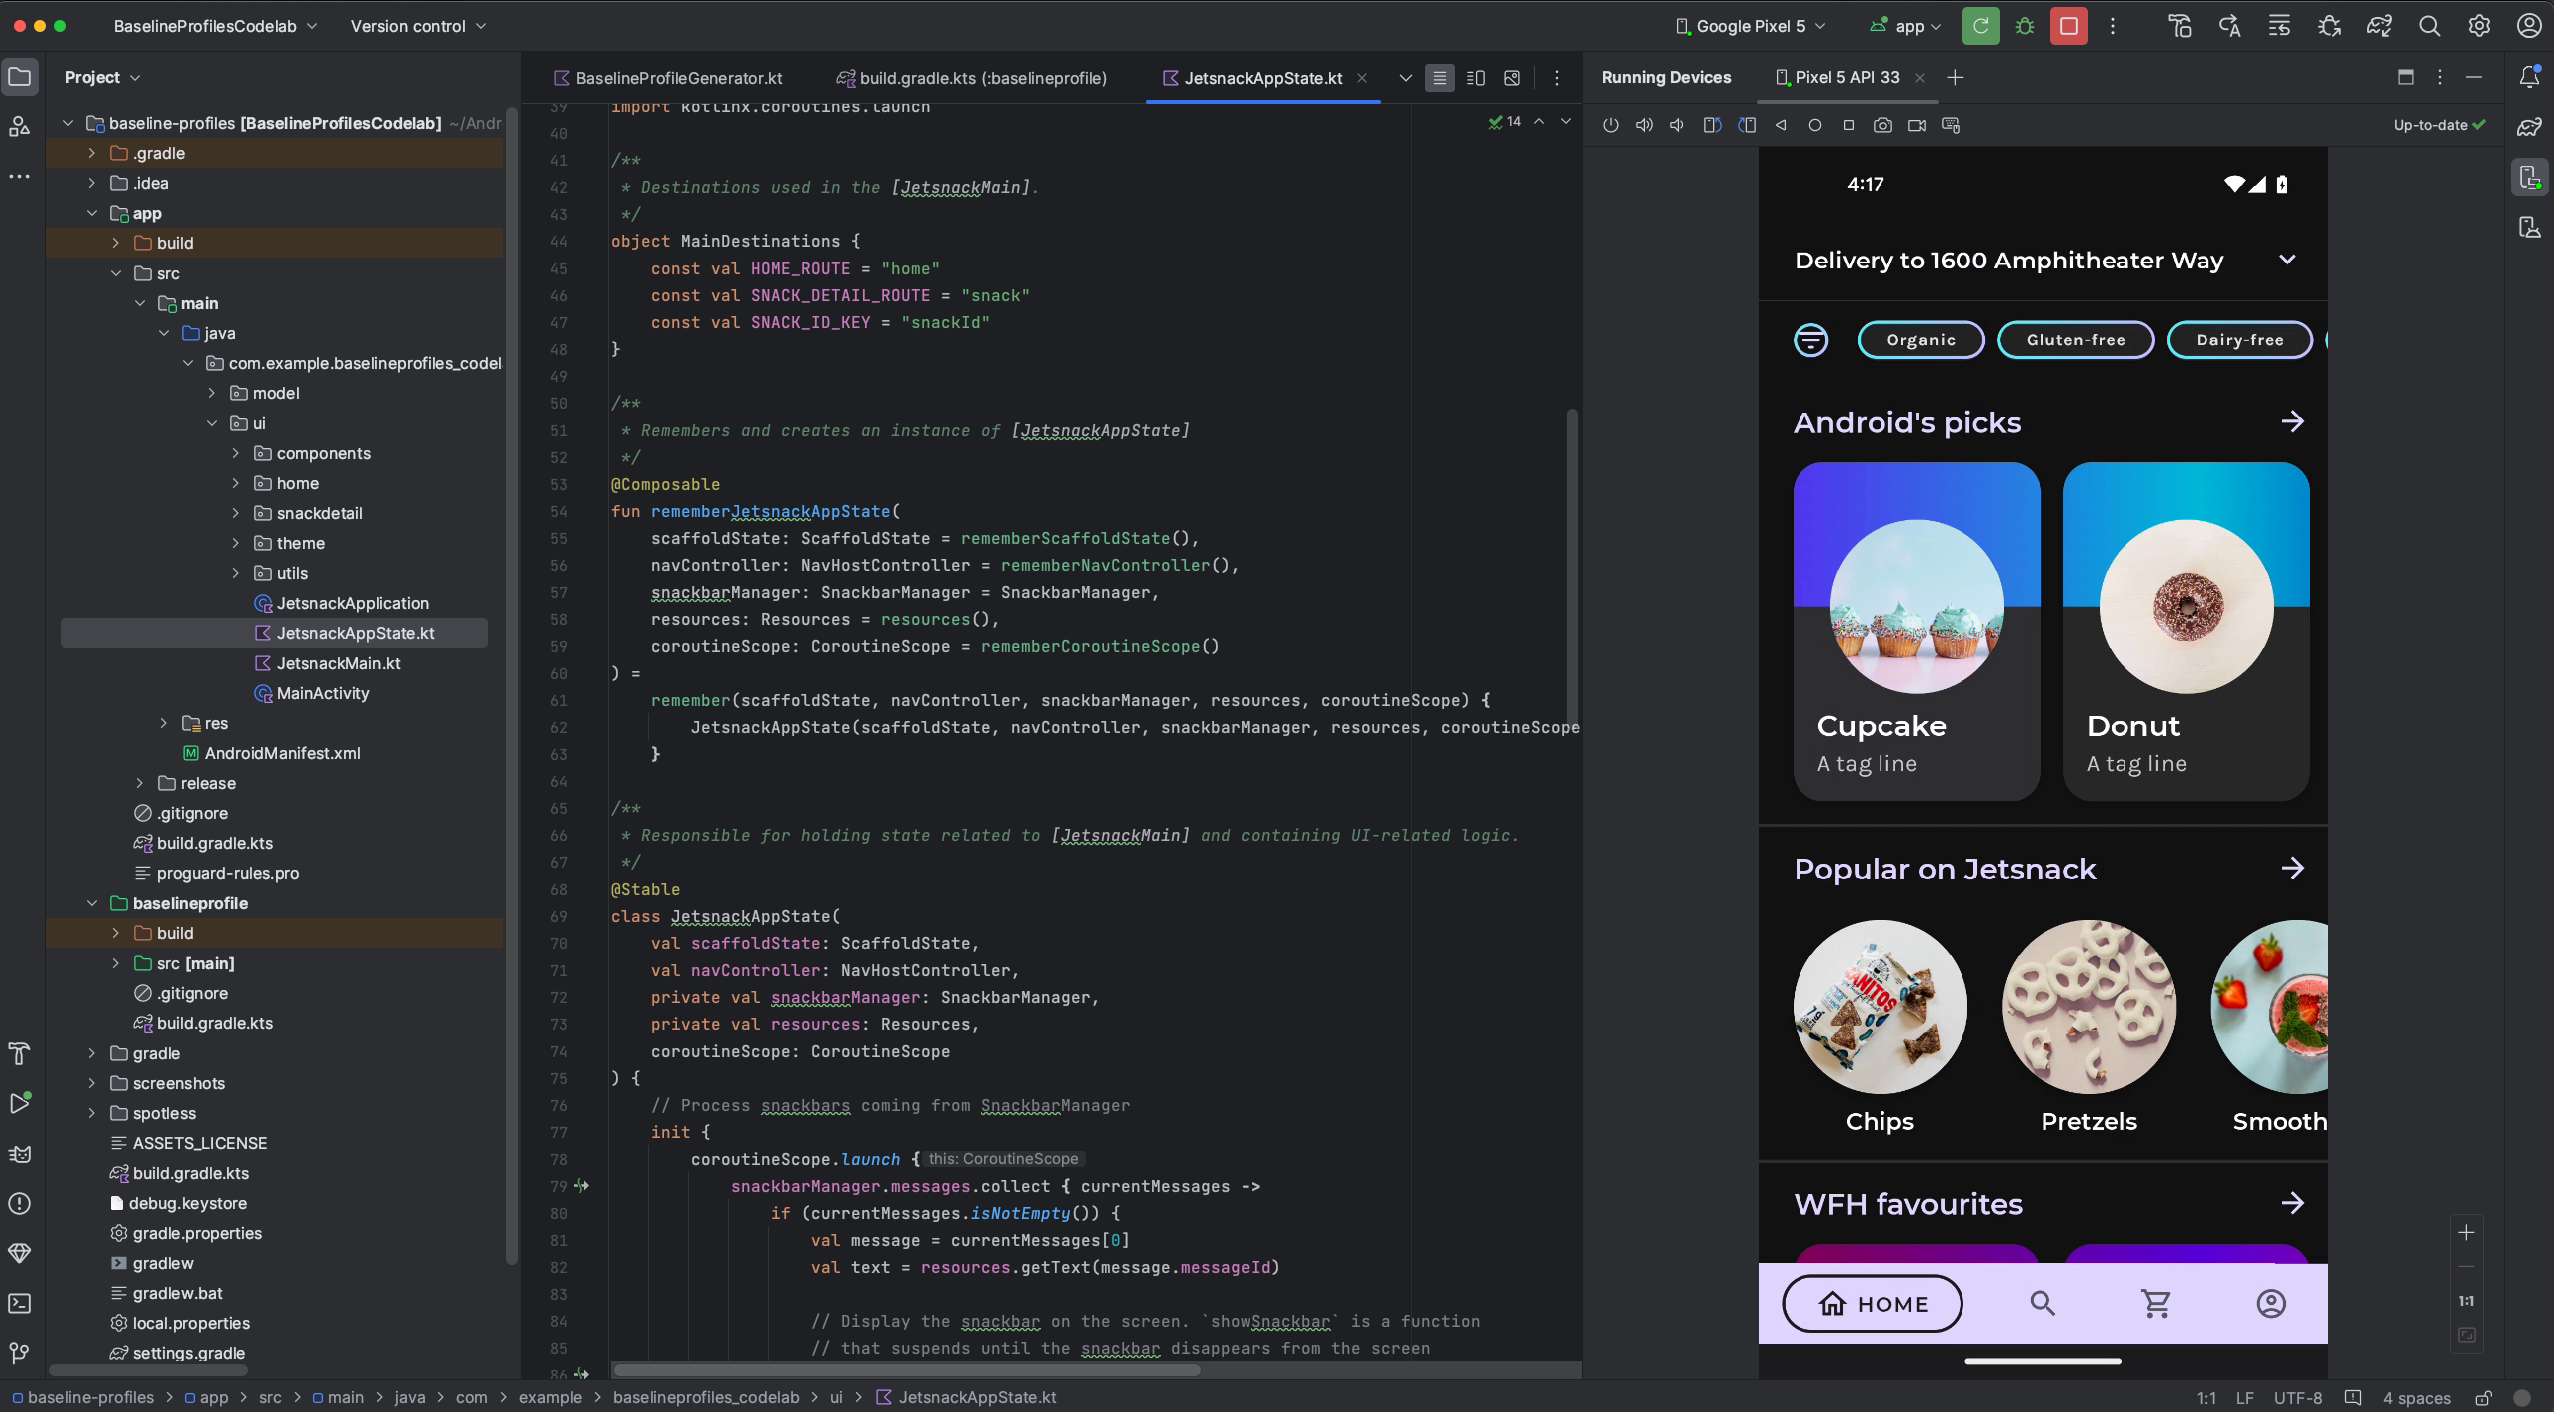
Device mirroring
You can now mirror your physical device in the Running Devices window in Android Studio. By streaming your device's display directly to Android Studio, you can execute common actions such as starting apps and interacting with them, rotating the screen, folding and unfolding the phone, changing the volume, and more right from the Studio IDE itself.
Device mirroring is always available when there are devices connected to the computer that have USB or wireless debugging enabled. You can start and stop mirroring using the Running Devices window or the Device Manager (View > Tool Windows > Device Manager). You can also customize when device mirroring is activated in its settings (Settings > Tools > Device Mirroring).
Known issues
Some device may not be capable of encoding at a bitrate sufficient to support device mirroring. In these situations, you might see an error in the Running Devices window as well as logs similar to what's shown below.
2023-06-01 15:32:22,675 [  56094]   WARN - ScreenSharingAgent Samsung SM-A045F API 33 - Too many video encoder errors:
2023-06-01 15:32:22,676 [  56095]   WARN - ScreenSharingAgent Samsung SM-A045F API 33 - encoder: c2.android.vp8.encoder
2023-06-01 15:32:22,676 [  56095]   WARN - ScreenSharingAgent Samsung SM-A045F API 33 - mime type: video/x-vnd.on2.vp8
2023-06-01 15:32:22,676 [  56095]   WARN - ScreenSharingAgent Samsung SM-A045F API 33 - max resolution: 640x640
2023-06-01 15:32:22,676 [  56095]   WARN - ScreenSharingAgent Samsung SM-A045F API 33 - min resolution: 2x2
2023-06-01 15:32:22,676 [  56095]   WARN - ScreenSharingAgent Samsung SM-A045F API 33 - alignment: 2x2
2023-06-01 15:32:22,676 [  56095]   WARN - ScreenSharingAgent Samsung SM-A045F API 33 - max frame rate: 960
2023-06-01 15:32:22,676 [  56095]   WARN - ScreenSharingAgent Samsung SM-A045F API 33 - max frame rate for 288x640: 960
2023-06-01 15:32:22,870 [  56289]   WARN - ScreenSharingAgent Samsung SM-A045F API 33 - max bitrate: 20000000
2023-06-01 15:32:22,871 [  56290]   WARN - ScreenSharingAgent Samsung SM-A045F API 33 - terminated with code 1
Privacy notice
Based on the device mirroring settings, Android Studio can automatically start
device mirroring for any connected and paired device. This might result in
information disclosure for devices connected with the adb tcpip command
because the mirroring information and commands are passed over a non-encrypted
channel. In addition, Android Studio uses a non-encrypted channel to communicate
with the adb server, so mirroring information can be intercepted by other users
on your host machine.
Hardware input forwarding
You can now enable transparent forwarding of your workstation hardware inputs,
such as the mouse and keyboard, to a connected physical and virtual device. To
enable transparent forwarding, click Hardware input
 for the target device in the Running Devices window.
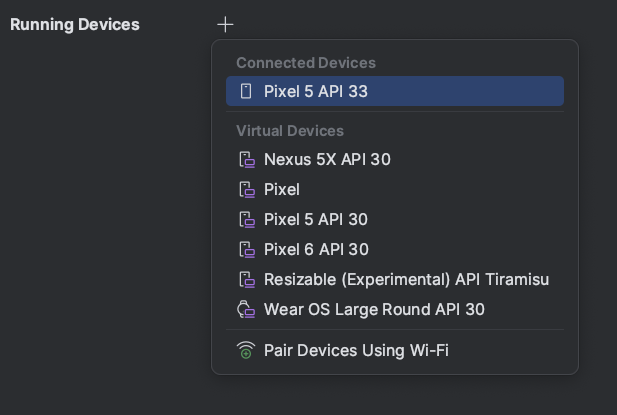
Manage devices directly from the Running Devices window
You can now start an Android Virtual Device (AVD), or start mirroring a
physical device, directly from the Running Devices window by clicking the
+ icon and selecting a device. To stop the AVD or mirroring of a physical
device, close the device tab.
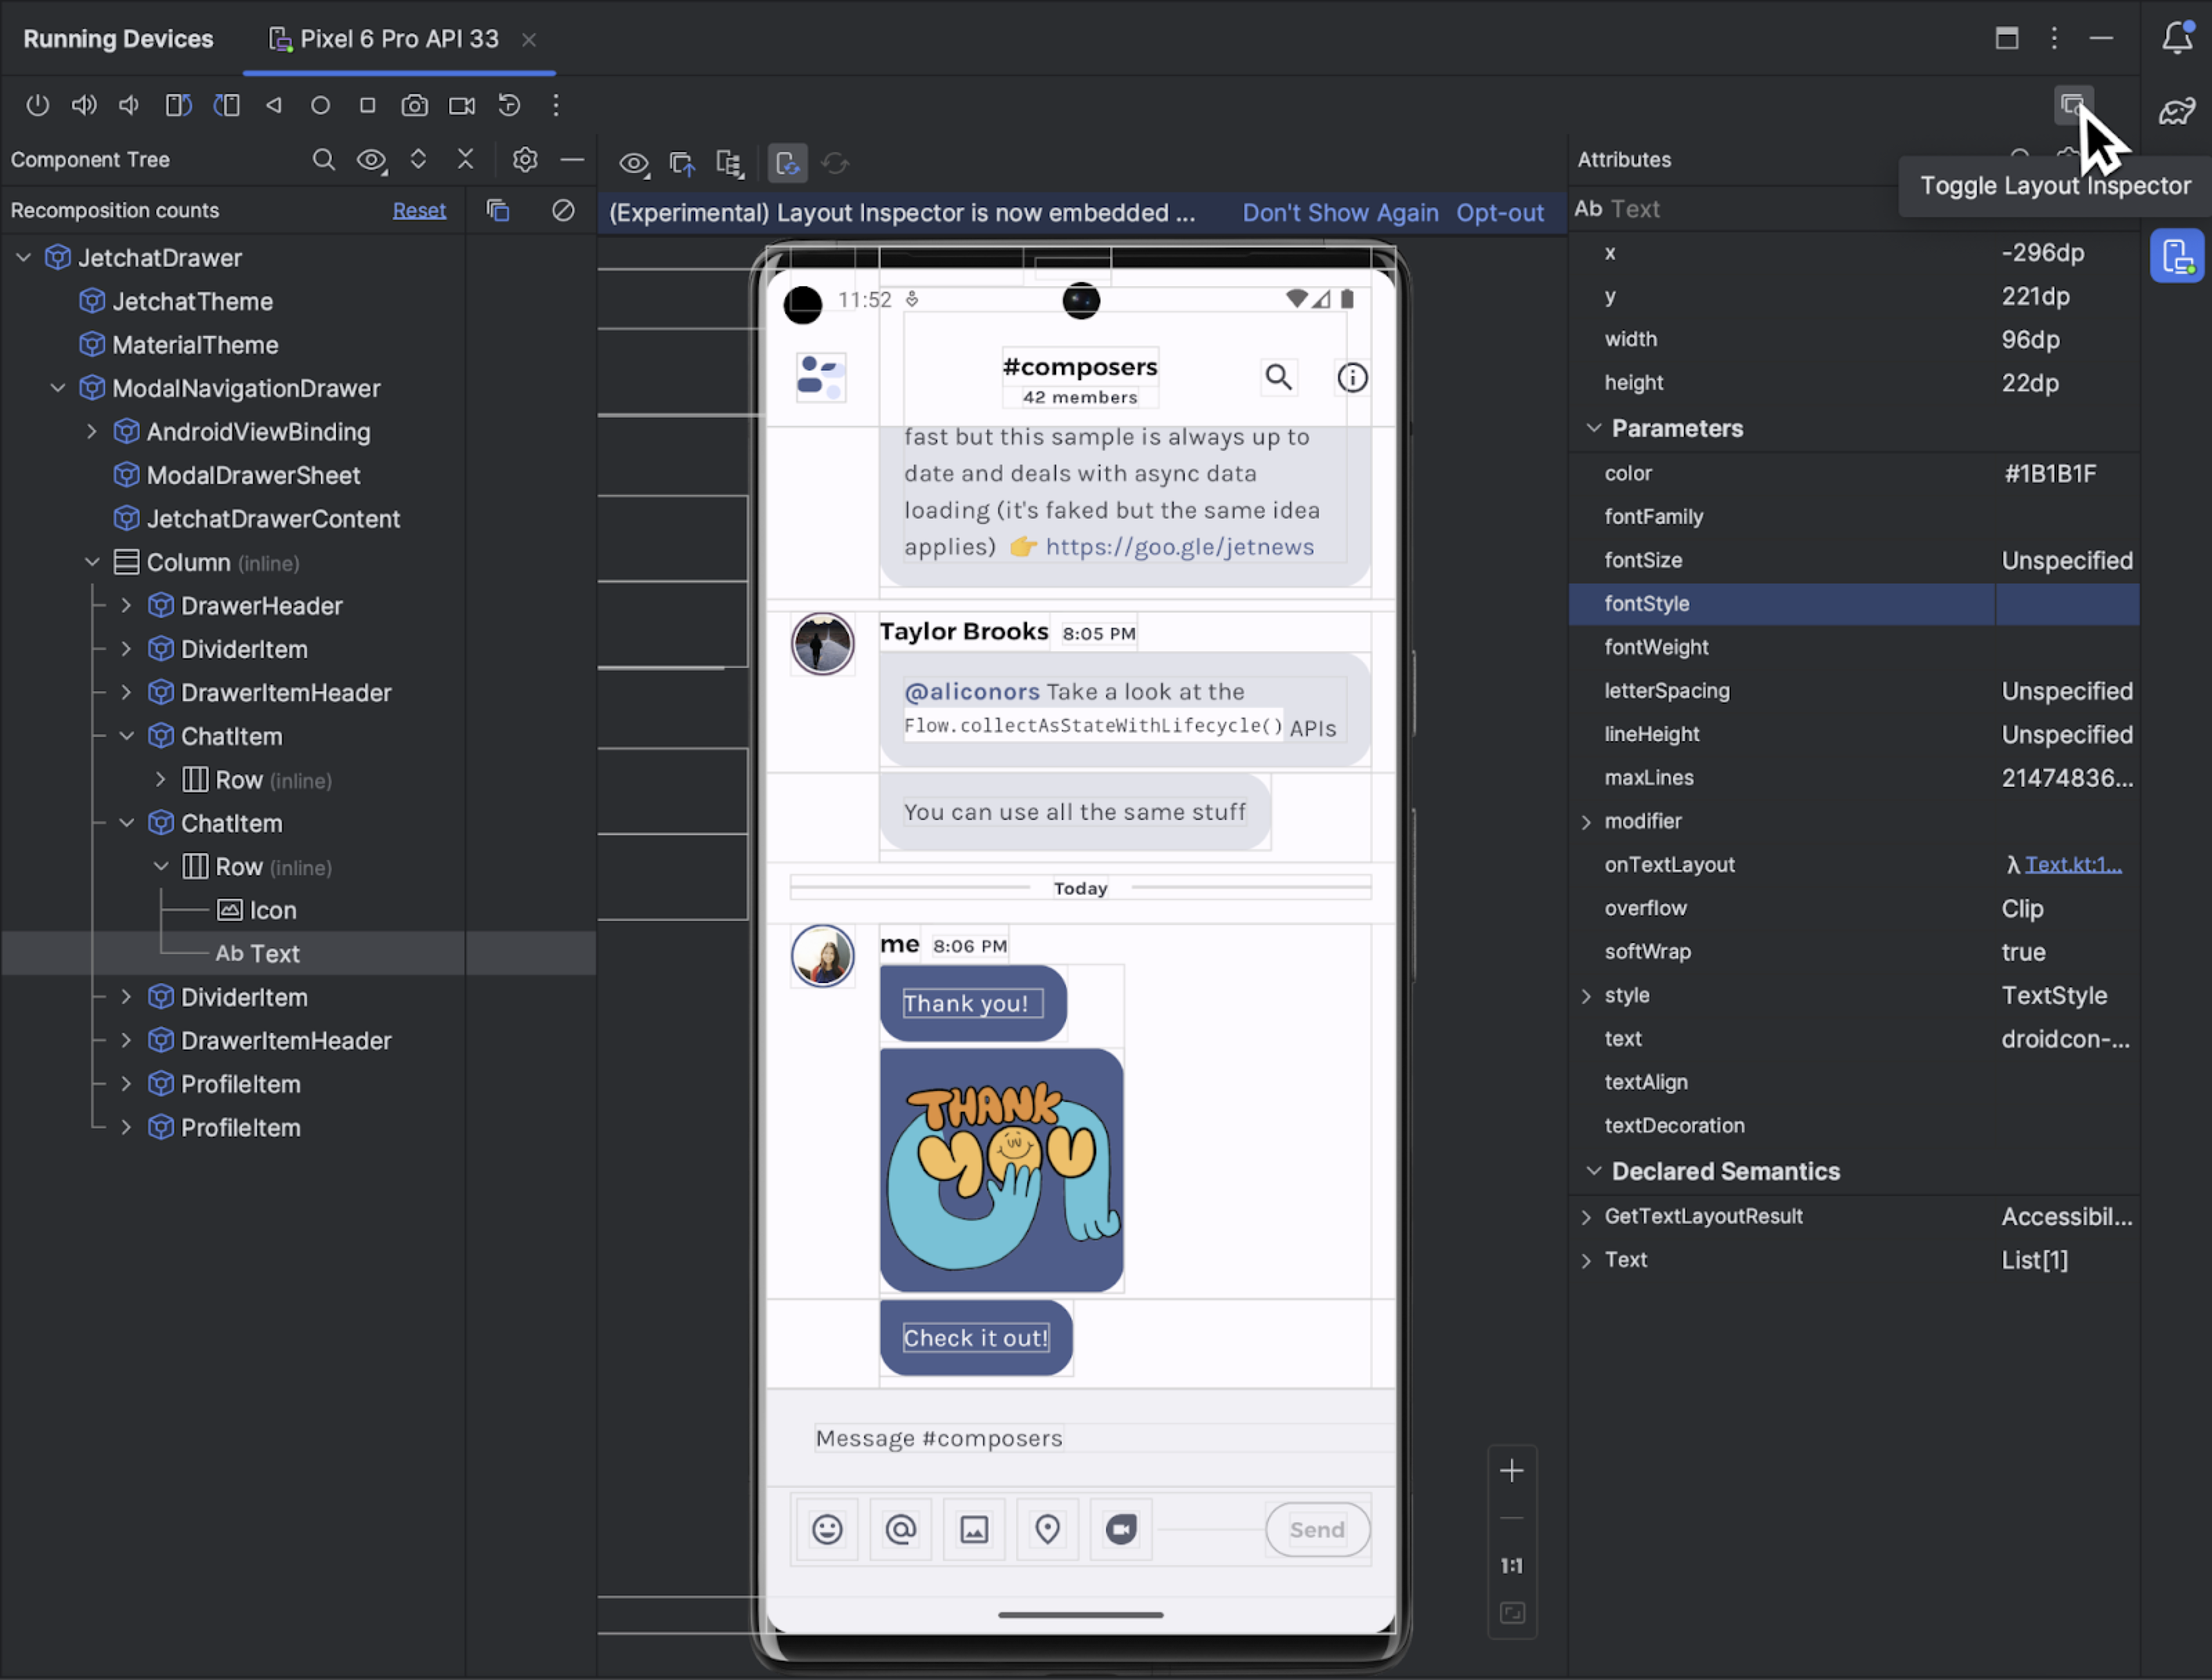
Embedded Layout Inspector
Starting with Android Studio Hedgehog Canary 2, you can run the Layout Inspector directly in the Running Devices tool window. This experimental feature conserves screen real estate and helps organize your UI debugging workflow in a single tool window. In embedded mode you can show a view hierarchy, inspect the properties of each view, and access other common Layout Inspector features. To access the full set of options, you still need to run the Layout Inspector in a standalone window (File > Settings > Experimental > Layout Inspector on Windows or Android Studio > Settings > Experimental > Layout Inspector on macOS).
A limitation of the embedded Layout Inspector is that 3D mode is only available in snapshots.
To help us improve the embedded Layout Inspector, please send us feedback.
New UI improvements
The new UI for Android Studio brings a more modern, cleaner look and feel to the Studio IDE. We've listened to your feedback so far and have fixed issues related to the following features in Android Studio Hedgehog:
- Compact mode
- Support for splitting vertically or horizontally
- Project tabs for macOS
- Fixes to distraction-free mode
- Advanced settings for always showing tool window actions
SDK Upgrade Assistant updates
The SDK Upgrade Assistant provides a
step-by-step wizard flow to help you with
targetSdkVersion
upgrades. Here are the updates to the SDK Upgrade Assistant in Android Studio
Hedgehog:
- See breaking changes for upgrading to Android 14
- Added relevance filters so some unnecessary steps are removed
- For certain changes, pinpoint exactly where in code the changes need to be made
Disable build optimization for target API level only
You can now disable IDE optimization for the target device API level. By default, Android Studio reduces overall build time by tailoring the dexing process for the API level of the target device you're deploying to. To turn this feature off, go to File > Settings > Experimental (Android Studio > Settings > Experimental on macOS) and uncheck Optimize build for target device API level only. Note that turning off this build optimization might increase build time.
[Windows-only] Minimize the impact of antivirus software on build speed
Build Analyzer informs you if antivirus software might be impacting your build performance. This can happen if antivirus software, such as Windows Defender, is doing real-time scanning of directories used by Gradle. Build Analyzer recommends a list of directories to exclude from active scanning and, if possible, it offers a link to add them to the Windows Defender folder exclusion list.
Eclipse Android Development Tool projects are no longer supported
Android Studio Hedgehog and higher don't support importing Eclipse ADT projects. You can still open these projects, but they are no longer recognized as Android projects. If you need to import this type of project you can use an earlier version of Android Studio. If a given version of Android Studio is unable to import your project, you can try with an even earlier version. Once the project is converted into an Android project using an earlier version of Android Studio, you can use the AGP Upgrade Assistant to work on that project using the latest Android Studio version.
Use Firebase Test Lab devices with Gradle-managed devices
When using AGP 8.2.0-alpha03 or higher, you can run your automated instrumented tests at scale on Firebase Test Lab devices when using Gradle-managed devices. Test Lab lets you run your tests simultaneously on a wide range of Android devices, both physical and virtual. These tests run in remote Google data centers. With support from Gradle-managed devices (GMD), the build system can now fully manage running tests against these Test Lab devices based on the configurations in your project's Gradle files.
Get started with Gradle-managed Firebase Test Lab devices
The following steps describe how to start using Firebase Test Lab devices with GMD. Note that these steps use the gcloud CLI to provide user credentials, which might not apply to all development environments. For more information about what authentication process to use for your needs, see How Application Default Credentials works.
To create a Firebase project, go to the Firebase console. Click Add project and follow the on-screen prompts to create a project. Remember your project ID.
- To install the Google Cloud CLI, follow the steps at Install the gcloud CLI.
- Configure your local environment.
- Link to your Firebase project in gcloud:
gcloud config set project FIREBASE_PROJECT_ID
Authorize the use of your user credentials for API access. We recommend authorizing by passing a service account JSON file to Gradle using the DSL in the module-level build script:
Kotlin
  firebaseTestLab {
    ...
    serviceAccountCredentials.set(file(SERVICE_ACCOUNT_JSON_FILE))
  }
Groovy
  firebaseTestLab {
    ...
    serviceAccountCredentials = file(SERVICE_ACCOUNT_JSON_FILE)
  }
Alternatively, you can authorize manually by using the following terminal command:
gcloud auth application-default login
Optional: Add your Firebase project as the quota project. This step is only needed if you exceed the no-cost quota for Test Lab.
gcloud auth application-default set-quota-project FIREBASE_PROJECT_ID
- Link to your Firebase project in gcloud:
Enable required APIs.
In the Google Developers Console API Library page, enable the Cloud Testing API and Cloud Tool Results API by typing these API names into the search box at the top of the console, and then clicking Enable API on the overview page for each API.
Configure your Android project.
Add the Firebase Test Lab plugin in the top-level build script:
Kotlin
  plugins {
    ...
    id("com.google.firebase.testlab") version "0.0.1-alpha05" apply false
  }
Groovy
  plugins {
    ...
    id 'com.google.firebase.testlab' version '0.0.1-alpha05' apply false
  }
Enable custom device types in the
gradle.propertiesfile:android.experimental.testOptions.managedDevices.customDevice=true
Add the Firebase Test Lab plugin in the module-level build script:
Kotlin
  plugins {
    ...
    id "com.google.firebase.testlab"
  }
Groovy
  plugins {
    ...
    id 'com.google.firebase.testlab'
  }
Create and run tests on a Gradle-managed Firebase Test Lab device
You can specify a Firebase Test Lab device for Gradle to use for testing your
app in the module-level build script. The following code sample creates a
Pixel 3 running API level 30 as a Gradle-managed Test Lab device called
ftlDevice. The firebaseTestLab {} block is available when you apply the
com.google.firebase.testlab plugin to your module. The minimum supported
Android Gradle Plugin version is 8.2.0-alpha01.
Kotlin
firebaseTestLab {
  managedDevices {
    create("ftlDevice") {
      device = "Pixel3"
      apiLevel = 30
    }
  }
  ...
}
Groovy
firebaseTestLab {
  managedDevices {
    ftlDevice {
      device = "Pixel3"
      apiLevel = 30
    }
  }
  ...
}
To run your tests using the Gradle-managed Test Lab devices you configured, use
the following command. device-name is the name of the device you configured in
your Gradle build script, such as ftlDevice, and BuildVariant is the build
variant of your app you want to test. Note that Gradle doesn't run tests in
parallel or support other Google Cloud CLI configurations for Test Lab devices.
On Windows:
gradlew device-nameBuildVariantAndroidTest
On Linux or macOS:
./gradlew device-nameBuildVariantAndroidTest
The test output includes a path to an HTML file that has the test report. You can also import test results into Android Studio for further analysis by clicking Run > Test History in the IDE.
Create and run tests on a device group
To scale your testing, add multiple Gradle-managed Firebase Test Lab devices to a device group and then run tests on all of them with a single command. Say you have multiple devices set up as follows:
firebaseTestLab {
  managedDevices {
    create("GalaxyS23Ultra") { ... }
    create("GalaxyZFlip3") { ... }
    create("GalaxyZFold3") { ... }
    create("GalaxyTabS2") { ... }
  }
}
To add them to a device group called samsungGalaxy, use the groups {} block:
firebaseTestLab {
  managedDevices {...}
}

android {
  ...
  testOptions {
    managedDevices {
      groups {
        create("samsungGalaxy") {
          targetDevices.add(devices["GalaxyS23Ultra"])
          targetDevices.add(devices["GalaxyZFlip3"])
          targetDevices.add(devices["GalaxyZFold3"])
          targetDevices.add(devices["GalaxyTabS3"])
        }
      }
    }
  }
}
To run tests on all the devices in the device group, use the following command:
On Windows:
gradlew group-nameGroupBuildVariantAndroidTest
On Linux or macOS:
./gradlew group-nameGroupBuildVariantAndroidTest
Optimize test runs with smart sharding
Testing on Gradle-managed Test Lab devices now supports smart sharding. Smart sharding automatically distributes your tests across shards such that each shard runs for approximately the same time, reducing manual allocation efforts and overall test run duration. Smart sharding uses your test history, or information about how long your tests have taken to run previously, to distribute tests in an optimal way. Note that you need version 0.0.1-alpha05 of the Gradle plugin for Firebase Test Lab to use smart sharding.
To enable smart sharding, specify the amount of time tests within each shard
should take. You should set the target shard time duration to at least five
minutes less than timeoutMinutes to avoid the situation where shards are
canceled before tests can finish.
firebaseTestLab {
  ...
  testOptions {
    targetedShardDurationMinutes = 2
  }
}
To learn more, read about the new DSL options.
Updated DSL for Gradle-managed Firebase Test Lab devices
There are more DSL options you can configure to help customize your test runs or migrate from other solutions you may already be using. See some of these options as described in the following code snippet.
firebaseTestLab {
  ...

  /**
   * A path to a JSON file that contains service account credentials to access to
   * a Firebase Test Lab project.
   */
  serviceAccountCredentials.set(file("your_service_account_credentials.json"))


  testOptions {
    fixture {
      /**
       * Whether to grant permissions on the device before tests begin.
       * Available options are "all" or "none".
       *
       * Default value is "all".
       */
      grantedPermissions = "all"

      /**
       * Map of files to push to the device before starting the test.
       *
       * The key is the location on the device.
       * The value is the location of the file, either local or in Google Cloud.
       */
      extraDeviceFiles["/sdcard/dir1/file1.txt"] = "local/file.txt"
      extraDeviceFiles["/sdcard/dir2/file2.txt"] = "gs://bucket/file.jpg"

      /**
       * The name of the network traffic profile.
       *
       * Specifies network conditions to emulate when running tests.
       *
       * Default value is empty.
       */
      networkProfile = "LTE"
    }

    execution {
      /**
       * The maximum time to run the test execution before cancellation,
       * measured in minutes. Does not include the setup or teardown of device,
       * and is handled server-side.
       *
       * The maximum possible testing time is 45 minutes on physical devices
       * and 60 minutes on virtual devices.
       *
       * Defaults to 15 minutes.
       */
       timeoutMinutes = 30

      /**
       * Number of times the test should be rerun if tests fail.
       * The number of times a test execution should be retried if one
       * or more of its test cases fail.
       *
       * The max number of times is 10.
       *
       * The default number of times is 0.
       */
      maxTestReruns = 2

      /**
       * Ensures only a single attempt is made for each execution if
       * an infrastructure issue occurs. This doesn't affect `maxTestReruns`.
       * Normally, two or more attempts are made by Firebase Test Lab if a
       * potential infrastructure issue is detected. This is best enabled for
       * latency sensitive workloads. The number of execution failures might be
       * significantly greater with `failFast` enabled.
       *
       * Defaults to false.
       */
      failFast = false

      /**
       * The number of shards to split the tests across.
       *
       * Default to 0 for no sharding.
       */
      numUniformShards = 20

      /**
      * For smart sharding, the target length of time each shard should takes in
      * minutes. Maxes out at 50 shards for physical devices and 100 shards for
      * virtual devices.
      *
      * Only one of numUniformShards or targetedShardDurationMinutes can be set.
      *
      * Defaults to 0 for no smart sharding.
      */
      targetedShardDurationMinutes = 15
    }

    results {
      /**
       * The name of the Google storage bucket to store the test results in.
       *
       * If left unspecified, the default bucket is used.
       *
       * Please refer to Firebase Test Lab permissions for required permissions
       * for using the bucket.
       */
      cloudStorageBucket = "bucketLocationName"

      /**
       * Name of test results for the Firebase console history list.
       * All tests results with the same history name are grouped
       * together in the Firebase console in a time-ordered test history list.
       *
       * Defaults to the application label in the APK manifest in Flank/Fladle.
       */
      resultsHistoryName = "application-history"

      /**
       * List of paths to copy from the test device's storage to the test
       * results folder. These must be absolute paths under /sdcard or
       * /data/local/tmp.
       */
      directoriesToPull.addAll(
        "/sdcard/path/to/something"
      )

      /**
       * Whether to enable video recording during the test.
       *
       * Disabled by default.
       */
      recordVideo = false

      /**
       * Whether to enable performance metrics. If enabled, monitors and records
       * performance metrics such as CPU, memory, and network usage.
       *
       * Defaults to false.
       */
      performanceMetrics = true
    }
  }
}