
Android Studio 3.1 (March 2018)
Android Studio 3.1.0 is a major release that includes a variety of new features and improvements.
3.1.4 (August 2018)
This update to Android Studio 3.1 includes the following changes and fixes:
- The bundled Kotlin is now version 1.2.50.
-
New projects are created with
kotlin-stdlib-jdk* artifacts, rather than withkotlin-stdlib-jre*artifacts, which are deprecated. - R8 parsing of ProGuard rules has been improved.
- The following bugs have been fixed:
-
Attempting to run the Kotlin Main class failed with an error:
"Error: Could not find or load main class..." - R8 entered an infinite loop while performing certain optimizations.
- Using the Rerun failed tests command in the Run window sometimes incorrectly returned the message "No tests were found".
-
D8 did not correctly handle
invoke-virtualinstances, causing a crash with aVerifyError:invoke-super/virtual can't be used on private method -
The Data Binding compiler was depending on an old version of
com.android.tools:annotations. The compiler now uses tools annotations from the base project when available. - Android Studio crashed during fragment transitions when using profilers.
- The debugger crashed when debugging a layout with a text box.
- D8 failed to read some ZIP files with special characters.
3.1.3 (June 2018)
This update to Android Studio 3.1 includes fixes for the following bugs:
- Memory leaks caused Android Studio to become slow and unresponsive after you had been using the Layout Editor. This update includes fixes for most of these issues. We intend to release another update soon to address additional memory leaks.
- Some applications built with D8 crashed on some Verizon Ellipsis tablets.
-
Installation of applications built with D8 failed with an
INSTALL_FAILED_DEXOPTerror on devices running Android 5.0 or 5.1 (API level 21 or 22). - Some applications that used the OkHttp library and were built with D8 crashed on devices running Android 4.4 (API level 19).
-
Android Studio sometimes failed to start, with a
ProcessCanceledExceptionduring class initialization forcom.intellij.psi.jsp.JspElementType.
3.1.2 (April 2018)
This update to Android Studio 3.1 includes fixes for the following bugs:
- In some cases, Android Studio hung indefinitely during exit.
-
Builds configured with source sets failed with the following message when Instant Run was enabled:
"The SourceSet name is not recognized by the Android Gradle Plugin." - When Instant Run was enabled, builds of new Kotlin projects failed when triggered by the Run command.
-
During editing of the
build.gradlefile, there was sometimes a noticeable delay between typing a character and the character appearing on the screen. -
Build failures occurred during dexing in some projects with large numbers of modules or external dependencies, with the following error message:
"RejectedExecutionException: Thread limit exceeded replacing blocked worker" - The computation of the D8 main DEX list was not taking into account some reflective invocations.
This update also includes changes that make running lint checks from Gradle much faster in some scenarios.
3.1.1 (April 2018)
This update to Android Studio 3.1 includes fixes for the following bugs:
-
In some cases, when a project created in Android Studio 3.0 was opened for the first time in Android Studio 3.1, the Gradle-aware Make task was removed from the Before launch area in Run/Debug Configurations. The result was that projects did not build when the Run or Debug button was clicked, which in turn caused failures such as deployment of incorrect APKs and crashes when using Instant Run.
To solve this problem, Android Studio 3.1.1 adds the Gradle-aware Make task to the run configuration for projects that are missing this entry. This modification occurs after the first Gradle sync when the project is loaded.
- The debugger crashed when debugging a layout with a text box if advanced profiling was enabled.
- Android Studio froze after you clicked Build Variants.
- AAR (Android archive) files were extracted twice, once during the Gradle sync process and once during the Gradle build process.
- Elements were missing from some vector drawables imported from SVG files.
-
The warning regarding the deprecation of the
compiledependency configuration has been updated with better guidance regarding theimplementationandapiconfigurations. For details of migrating away from using thecompileconfiguration, see the documentation for the new dependency configurations.
Coding/IDE
IntelliJ 2017.3.3
The core Android Studio IDE has been updated with improvements from IntelliJ IDEA through the 2017.3.3 release. Improvements include better control flow analysis for collections and strings, improved nullability inference, new quick fixes, and much more.
For details, see the JetBrains release notes for IntelliJ IDEA versions 2017.2 and 2017.3, as well as the JetBrains release notes for bug-fix updates.
SQL editing improvements with Room
When you use the Room database library, you can take advantage of several improvements to SQL editing:
- Code completion within a
Queryunderstands SQL tables (entities), columns, query parameters, aliases, joins, subqueries, and WITH clauses. - SQL syntax highlighting now works.
- You can right-click a table name in SQL and rename it, which also rewrites the corresponding Java or Kotlin code (including, for example, the return type of the query). Renaming works in the other direction, too, so renaming a Java class or field rewrites the corresponding SQL code.
- SQL usages are shown when using Find usages (right-click and choose Find usages from the context menu).
- To navigate to an SQL entity's declaration in Java or Kotlin code, you can hold Control (Command on Mac) while clicking the entity.
For information on using SQL with Room, see Save data in a local database using Room.
Updates to data binding
This update includes several improvements for data binding:
-
You can now use a
LiveDataobject as an observable field in data binding expressions. TheViewDataBindingclass now includes a newsetLifecycle()method that you use to observeLiveDataobjects. -
The
ObservableFieldclass can now accept otherObservableobjects in its constructor. -
You can preview a new incremental compiler for your data binding classes. For details of this new compiler and instructions for enabling it, see Data Binding Compiler V2.
Benefits of the new compiler include the following:
-
ViewBindingclasses are generated by the Android Plugin for Gradle before the Java compiler. - Libraries keep their generated binding classes when the app is compiled, rather than being regenerated each time. This can greatly improve performance for multi-module projects.
-
Compiler and Gradle
D8 is the default DEX compiler
The D8 compiler is now used by default for generating DEX bytecode.
This new DEX compiler brings with it several benefits, including the following:
- Faster dexing
- Lower memory usage
- Improved code generation (better register allocation, smarter string tables)
- Better debugging experience when stepping through code
You don't need to make any changes to your code or your development workflow to get these benefits, unless you had previously manually disabled the D8 compiler.
If you set android.enableD8 to false in your
gradle.properties, either delete that flag or set it to
true:
android.enableD8=true
For details, see New DEX compiler.
Incremental desugaring
For projects that use Java 8 language features, incremental desugaring is enabled by default, which can improve build times.
Desugaring converts syntactic sugar into a form that the compiler can process more efficiently.
You can disable incremental desugaring by specifying the following in
your project's gradle.properties file:
android.enableIncrementalDesugaring=false
Simplified output window
The Gradle Console has been replaced with the Build window, which has Sync and Build tabs.
For details about how to use the new, simplified Build window, seeMonitor the build process.
Batch updates and indexing concurrency
The Gradle sync and IDE indexing processes are now much more efficient, reducing time wasted on many redundant indexing operations.
C++ and LLDB
We have made many quality and performance improvements in the coding, syncing, building, and debugging phases of C++ development. Improvements include the following:
-
If you work with large C++ projects, you should notice a significant improvement in the reduction of time spent building symbols. Sync time is also greatly reduced for large projects.
-
Performance when building and syncing with CMake has been improved through more aggressive reuse of cached results.
-
The addition of formatters ("pretty printers") for more C++ data structures makes LLDB output easier to read.
-
LLDB now works with only Android 4.1 (API level 16) and higher.
Note: Native debugging with Android Studio 3.0 or greater does not work on 32-bit Windows. If you are using 32-bit Windows and need to debug native code, use Android Studio 2.3.
Kotlin
Kotlin upgraded to version 1.2.30
Android Studio 3.1 includes Kotlin version 1.2.30.
Kotlin code now analyzed with command-line lint check
Running lint from the command line now analyzes your Kotlin classes.
For each project that you would like to run lint on,
Google's Maven
repository must be included in the top-level build.gradle
file. The Maven repository is already included for projects created in
Android Studio 3.0 and higher.
Performance tools
Sample native C++ processes with CPU Profiler
The CPU Profiler now includes a default configuration to record sampled traces of your app's native threads. You can use this configuration by deploying your app to a device running Android 8.0 (API level 26) or higher and then selecting Sampled (Native) from the CPU Profiler's recording configurations dropdown menu. After that, record and inspect a trace as you normally would.
You can change default settings, such as the sampling interval, by creating a recording configuration.
To switch back to tracing your Java threads, select either a Sampled (Java) or Instrumented (Java) configuration.
Filter CPU traces, memory allocation results, and heap dumps
The CPU Profiler and Memory Profiler include a search feature that allows you to filter results from recording a method trace, memory allocations, or heap dump.
To search, click Filter
 in the top-right corner of the pane, type
your query, and press Enter.
in the top-right corner of the pane, type
your query, and press Enter.
Tip: You can also open the search field by pressing Control + F (Command + F on Mac).
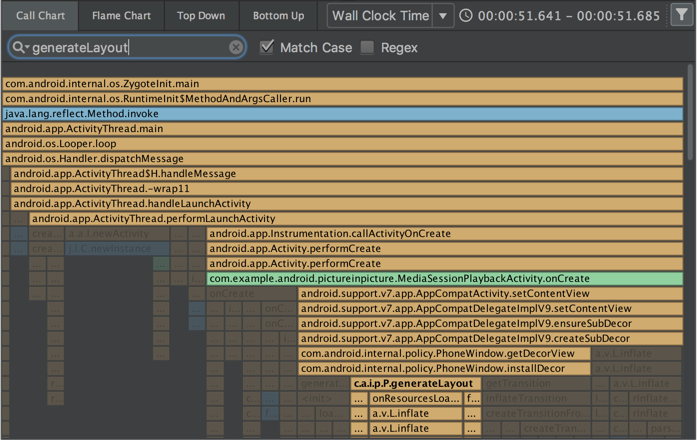
In the CPU Profiler's Flame Chart tab, call stacks that include methods related to your search query are highlighted and moved to the left side of the chart.
For more information on filtering by method, class, or package name, see Record and inspect method traces.
Request tab in the Network Profiler
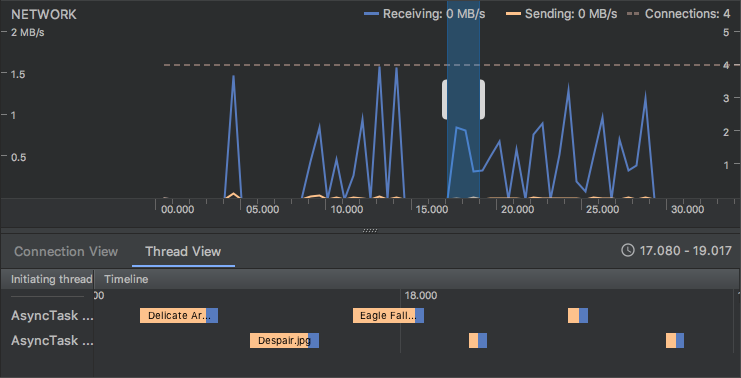
The Network Profiler now includes a Request tab that provides details about network requests during the selected timeline. In previous versions, the Network Profiler only provided information about network responses.
Thread View in the Network Profiler
After selecting a portion of the timeline in the Network Profiler, you can select one of the following tabs to see more detail about the network activity during that timeframe:
- Connection View: Provides the same information as previous versions of Android Studio—it lists files that were sent or received during the selected portion of the timeline across all of your app's CPU threads. For each request, you can inspect the size, type, status, and transmission duration.
- Thread View: Displays network activity of each of your app's CPU threads. This view allows you to inspect which of your app's threads are responsible for each network request.
Layout Inspector
The Layout Inspector gained new features, including some functionality previously provided by the deprecated Hierarchy Viewer and Pixel Perfect tools:
- Zoom buttons and keyboard shortcuts for navigating and inspecting layouts
- Reference grid overlay
- Ability to load a reference image and use it as an overlay (useful for comparing your layout with a UI mockup)
- Render subtree preview to isolate a view in a complex layout
Layout Editor
The Palette in the Layout Editor has received many improvements:
- Reorganization of categories for views and layouts.
- New Common category for views and layouts, which you can add to with a Favorite command.
- Improved search for views and layouts.
- New commands for opening documentation for a specific view or layout element.
You can use the new Convert view command in the Component tree or design editor to convert a view or layout to another type of view or layout.
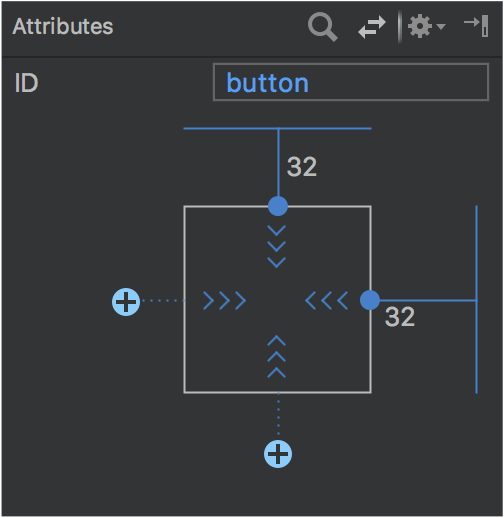
You can now easily create constraints to items near the selected view using the
new Create a connection ![]() buttons in the view inspector at the top of the Attributes window.
buttons in the view inspector at the top of the Attributes window.
Run and Instant Run
The behavior of the Use same selection for future launches option in the Select deployment target dialog has been made more consistent. If the Use same selection option is enabled, then the Select deployment target dialog opens only the first time that you use the Run command until the selected device is no longer connected.
When targeting a device running Android 8.0 (API level 26) or higher, Instant Run can deploy changes to resources without causing an application restart. This is possible because the resources are contained in a split APK.
Emulator
For details of what's new and changed in the emulator since Android Studio 3.0, see the Android Emulator release notes from version 27.0.2 through version 27.1.12.
Major improvements include the following:
- Quick Boot snapshots for saving of emulator state and faster start, with the ability to use the Save now command to save a custom start state.
- Windowless emulator screen.
- System images for Android 8.0 (API level 26), Android 8.1 (API level 27), and Android P Developer Preview.
User interface and user experience improvements
More tooltips, keyboard shortcuts, and helpful messages
We have added tooltips and helpful message overlays in many places throughout Android Studio.
To see keyboard shortcuts for many commands, just hold the mouse pointer over a button until the tooltip appears.
Tools > Android menu removed
The Tools > Android menu has been removed. Commands that were previously under this menu have been moved.
- Many commands moved to directly under the Tools menu.
- The Sync project with gradle files command moved to the File menu.
- The Device Monitor command has been removed, as described below.
Device Monitor available from the command line
In Android Studio 3.1, the Device Monitor serves less of a role than it previously did. In many cases, the functionality available through the Device Monitor is now provided by new and improved tools.
See the Device Monitor documentation for instructions for invoking the Device Monitor from the command line and for details of the tools available through the Device Monitor.