
Android Studio 3.2 (September 2018)
Android Studio 3.2 is a major release that includes a variety of new features and improvements.
3.2.1 (October 2018)
This update to Android Studio 3.2 includes the following changes and fixes:
- The bundled Kotlin version is now 1.2.71.
- The default build tools version is now 28.0.3.
- In the Navigation library, argument types have been renamed from
typetoargType. - The following bugs have been fixed:
- When using the Data Binding library, variable names with underscores were causing compilation errors.
- CMake was causing IntelliSense and other CLion features to fail.
- Adding a
SliceProviderwas causing compilation errors in projects that did not useandroidx.*libraries. - Some Kotlin unit tests were not being run.
- An issue with data binding was causing a
PsiInvalidElementAccessException. <merge>elements were sometimes causing the Layout Editor to crash.
3.2.0 known issues
Note: These issues have been resolved in Android Studio 3.2.1
We strongly recommend against using Kotlin version 1.2.70.
Kotlin version 1.2.61 fixes a bug that can cause Android Studio to hang, but Kotlin 1.2.70 does not include this fix.
Kotlin versions 1.2.71 and later, however, do include this fix.
-
Although you typically don't need to specify the build tools version, when using Android Gradle plugin 3.2.0 with
renderscriptSupportModeEnabledset totrue, you need to include the following in each module'sbuild.gradlefile:android.buildToolsVersion "28.0.3"
What's New Assistant
A new assistant informs you about the latest changes in Android Studio.
The assistant opens when you start Android Studio after a fresh installation or update if it detects that there is new information to show. You can also open the assistant by choosing Help > What's new in Android Studio.
Android Jetpack
Android Jetpack helps to accelerate Android development with components, tools, and guidance that eliminate repetitive tasks and enable you to more quickly and easily build high-quality, testable apps. Android Studio includes the following updates to support Jetpack. For more information, see the Jetpack documentation.
Navigation Editor
The new Navigation Editor integrates with the navigation components of Android Jetpack to provide a graphical view for creating the navigation structure of your app. The Navigation Editor simplifies the design and implementation of navigation between in-app destinations.
In Android Studio 3.2, the Navigation Editor is an experimental feature. To enable the Navigation Editor, click File > Settings (Android Studio > Preferences on Mac), select the Experimental category in the left pane, check the box next to Enable Navigation Editor, and restart Android Studio.
To learn more, read the Navigation Editor documentation.
AndroidX migration
As part of Jetpack, we are migrating the Android Support Libraries to a new
Android extension library using the androidx namespace. For more
information, see the
AndroidX overview.
Android Studio 3.2 helps you through this process with a new migration feature.
To migrate an existing project to AndroidX, choose Refactor > Migrate to AndroidX. If you have any Maven dependencies that have not migrated to the AndroidX namespace, the Android Studio build system also automatically converts those project dependencies.
The Android Gradle plugin provides the following global flags that you can set
in your gradle.properties file:
android.useAndroidX: When set totrue, this flag indicates that you want to start using AndroidX from now on. If the flag is absent, Android Studio behaves as if the flag were set tofalse.android.enableJetifier: When set totrue, this flag indicates that you want to have tool support (from the Android Gradle plugin) to automatically convert existing third-party libraries as if they were written for AndroidX. If the flag is absent, Android Studio behaves as if the flag were set tofalse.
Both flags are set to true when you use the
Migrate to AndroidX command.
If you want to start using AndroidX libraries immediately and don't need to
convert existing third-party libraries, you can set the
android.useAndroidX flag to true and the
android.enableJetifier flag to false.
Android App Bundle
Android App Bundle is a new upload format that includes all of your app’s compiled code and resources, but defers APK generation and signing to the Google Play Store.
Google Play’s new app serving model then uses your app bundle to generate and serve optimized APKs for each user’s device configuration, so each user downloads only the code and resources they need to run your app. You no longer need to build, sign, and manage multiple APKs, and users get smaller, more optimized downloads.
Additionally, you can add feature modules to your app project and include them in your app bundle. Your users can then download and install your app’s features on demand.
To build a bundle, choose Build > Build Bundle(s) / APK(s) > Build Bundle(s).
For more information, including instructions for building and analyzing an Android App Bundle, see Android App Bundle.
Sample data in Layout Editor
Many Android layouts have runtime data that can make it difficult to visualize
the look and feel of a layout during the design stage of app development. You
can now easily see a preview of your view in the Layout Editor filled with
sample data. When you add a view, a button
 appears below the view in the Design window. Click this button to set the
design-time view attributes. You can choose
from a variety of sample data templates and specify the number of sample items
with which to populate the view.
appears below the view in the Design window. Click this button to set the
design-time view attributes. You can choose
from a variety of sample data templates and specify the number of sample items
with which to populate the view.
To try using sample data, add a
RecyclerView
to a new layout, click the design-time attributes button
below the view, and choose a selection from the carousel of sample data
templates.
Slices
Slices provide a new way to embed portions of your app's functionality in other user interface surfaces on Android. For example, Slices make it possible to show app functionality and content in Google Search suggestions.
Android Studio 3.2 has a built-in template to help you to extend your app with the new Slice Provider APIs, as well as new lint checks to ensure that you're following best practices when constructing the Slices.
To get started right-click a project folder and choose New > Other > Slice Provider.
To learn more, including how to test your Slice interactions, read the Slices getting started guide.
Kotlin 1.2.61
Android Studio 3.2 bundles Kotlin 1.2.61, and the new Android SDK integrates better with Kotlin. For more information, see the Android Developers blog.
IntelliJ IDEA 2018.1.6
The core Android Studio IDE has been updated with improvements from IntelliJ IDEA through the 2018.1.6 release.
Android profilers
Try the following new Android Profiler features in Android Studio 3.2.
Sessions
You can now save Profiler data as sessions to revisit and inspect later. The profiler keeps your session data until you restart the IDE.
When you record a method trace or capture a heap dump, the IDE adds that data (along with your app's network activity) as a separate entry to the current session, and you can easily switch back and forth between recordings to compare data.
System Trace
In the CPU Profiler, select the
new System Trace configuration to inspect your device's system CPU and
thread activity. This trace configuration is built on
systrace
and is useful for investigating system-level issues, such as UI jank.
While using this trace configuration, you can visually mark important code
routines in the profiler timeline by instrumenting your C/C++ code with the
native tracing API or your Java code with the
Trace class.
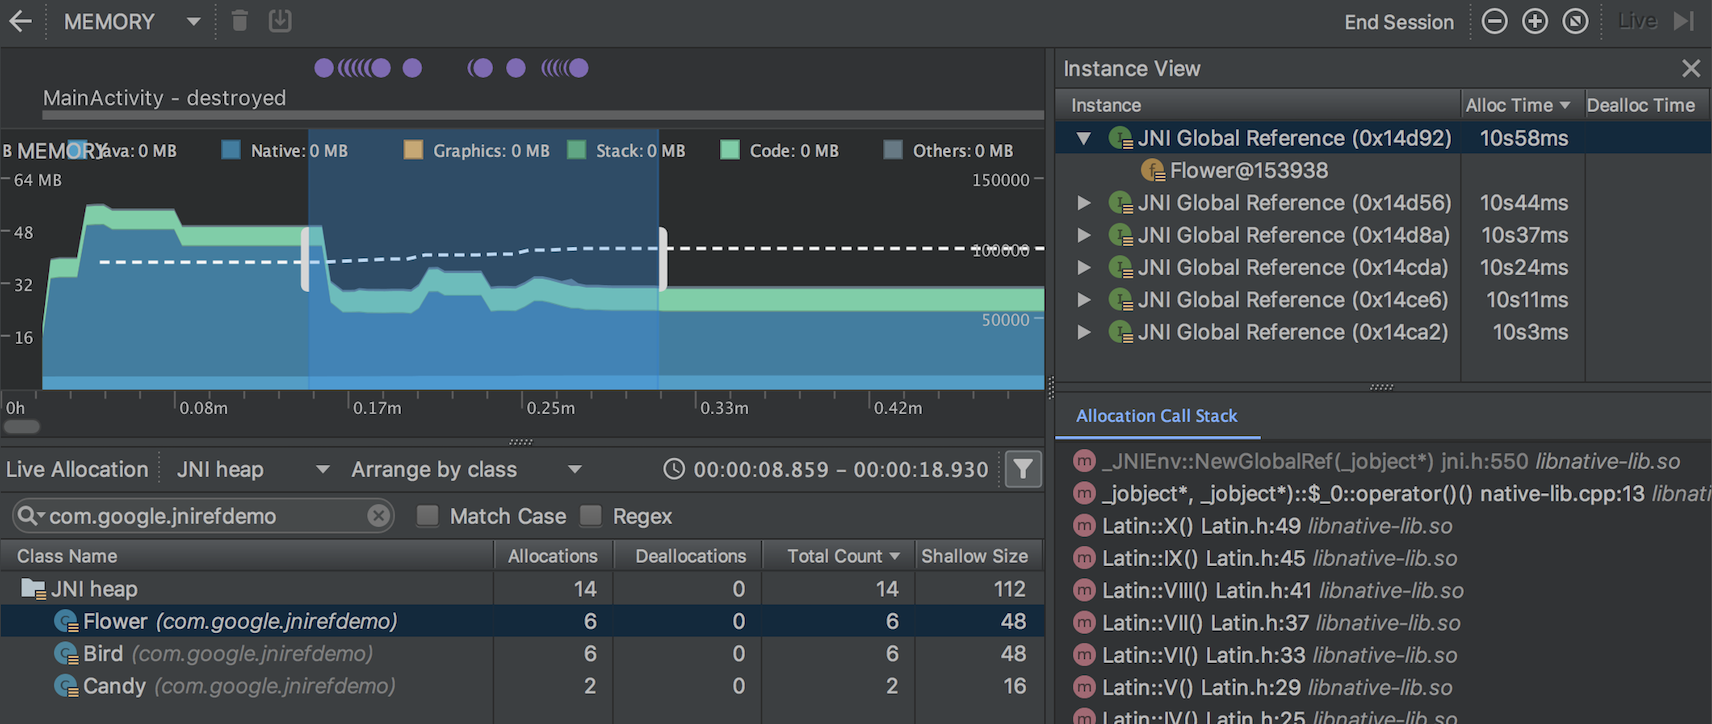
Inspect JNI references in the Memory Profiler
If you deploy your app to a device running Android 8.0 (API level 26) or higher, you can now inspect memory allocations for your app’s JNI code using the Memory Profiler.
While your app is running, select a portion of the timeline that you want to inspect and select JNI heap from the drop-down menu above the class list, as shown below. You can then inspect objects in the heap as you normally would and double-click objects in the Allocation Call Stack tab to see where the JNI references are allocated and released in your code.
Import, export, and inspect memory heap dump files
You can now import, export, and inspect .hprof memory heap dump files created
with the Memory Profiler.
Import your .hprof file by clicking Start new profiler session
 in the
profiler’s Sessions pane and then selecting Load from file. You can then
inspect its data in the Memory Profiler as you would any other heap dump.
in the
profiler’s Sessions pane and then selecting Load from file. You can then
inspect its data in the Memory Profiler as you would any other heap dump.
To save heap dump data to review later, use the Export Heap Dump button at
the right of the Heap Dump entry in the Sessions pane. In the
Export As dialog that appears, save the file with the .hprof filename
extension.
Record CPU activity during app startup
You can now record CPU activity during your app's startup, as follows:
- Select Run > Edit Configurations from the main menu.
- Under the Profiling tab of your desired run configuration, check the box next to Start recording a method trace on startup.
- Select a CPU recording configuration to use from the dropdown menu.
- Deploy your app to a device running Android 8.0 (API level 26) or higher by selecting Run > Profile.
Export CPU traces
After you record CPU activity with the CPU Profiler, you can export the data as
a .trace file to share with others or inspect later.
To export a trace after you’ve recorded CPU activity, do the following:
- Right-click on the recording you want to export from the CPU timeline.
- Select Export trace from the dropdown menu.
- Navigate to where you want to save the file and click Save.
Import and inspect CPU trace files
You can now import and inspect .trace files created with the
Debug API or
CPU Profiler. (Currently, you
can't import System Trace recordings.)
Import your trace file by clicking Start new profiler session
in the
profiler’s Sessions pane and then selecting
Load from file. You can then
inspect its data in the CPU Profiler similar to how you normally would, with the
following exceptions:
- CPU activity is not represented along the CPU timeline.
- The thread activity timeline indicates only where trace data is available for each thread and not actual thread states (such as running, waiting, or sleeping).
Record CPU activity using the Debug API
You can now start and stop recording CPU activity in the CPU Profiler by
instrumenting your app with the Debug API. After
you deploy your app to a device, the profiler automatically starts recording CPU
activity when your app calls
startMethodTracing(String tracePath),
and the profiler stops recording when your app calls
stopMethodTracing(). While
recording CPU activity that’s triggered using this API, the CPU Profiler shows
Debug API as the selected CPU recording configuration.
Energy Profiler
The Energy Profiler displays a visualization of the estimated energy usage of your app, as well as system events that affect energy usage, such as wakelocks, alarms, and jobs.
The Energy Profiler appears as a new row at the bottom of the Profiler window when you run your app on a connected device or Android Emulator running Android 8.0 (API 26) or higher.
Click the Energy row to maximize the Energy Profiler view. Place your mouse pointer over a bar in the timeline to see a breakdown of energy use by CPU, network, and location (GPS) resources, as well as relevant system events.
System events that affect energy usage are indicated in the System timeline below the Energy timeline. Details of system events within the specified time range are shown in the event pane when you select a time range in the Energy timeline.
To see the call stack and other details for a system event, such as a wakelock, select it in the event pane. To go to the code responsible for a system event, double-click the entry in the call stack.
Lint checking
Android Studio 3.2 includes many new and improved features for lint checking.
The new lint checks help you to find and identify common code problems, ranging from warnings about potential usability issues to high-priority errors regarding potential security vulnerabilities.
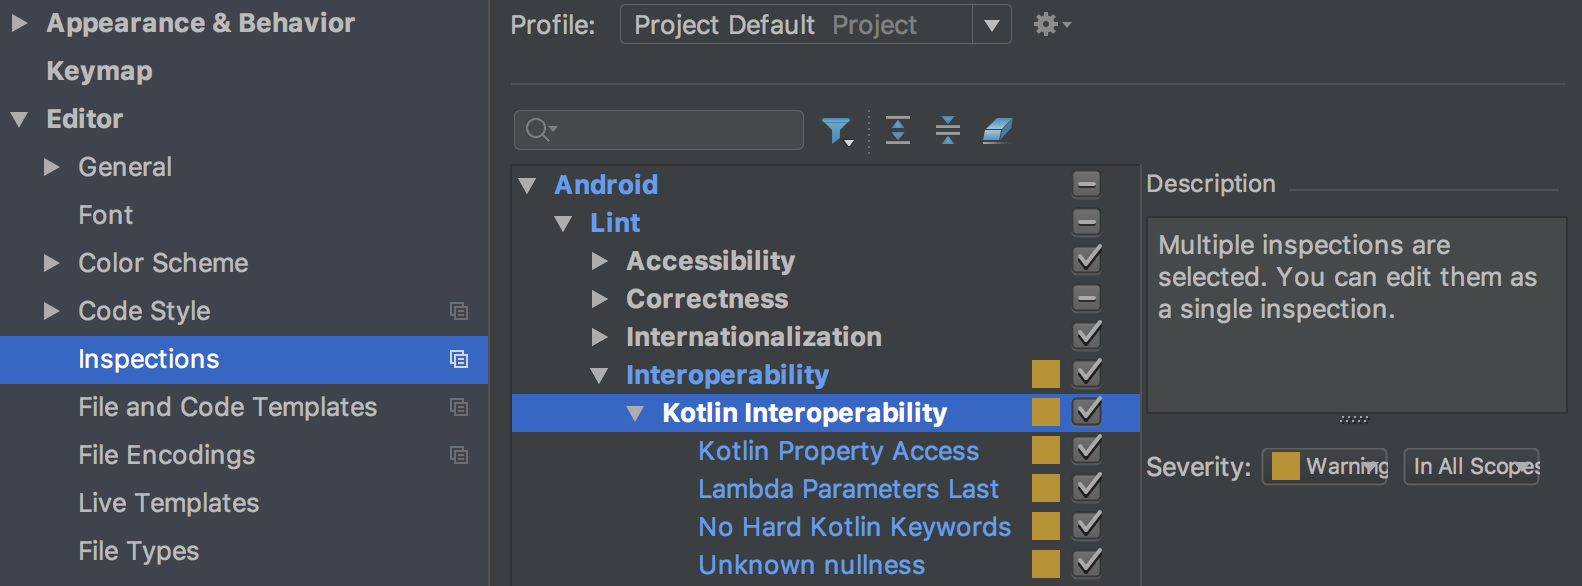
Lint checks for Java/Kotlin interoperability
To make sure that your Java code interoperates well with your Kotlin code, new lint checks enforce the best practices described in the Kotlin Interop Guide. Examples of these checks include looking for the presence of Nullability annotations, use of Kotlin hard keywords, and placing lambda parameters last.
To enable these checks, click File > Settings (Android Studio > Preferences on Mac) to open the Settings dialog, navigate to the Editor > Inspections > Android > Lint > Interoperability > Kotlin Interoperability section, and select the rules that you want to enable.
To enable these checks for command-line builds, add the following to your
build.gradle file:
        android {
            lintOptions {
                check 'Interoperability'
            }
        }
Lint checks for Slices
New lint checks for Slices help to ensure that you are constructing Slices correctly. For example, lint checks warn you if you have not assigned a primary action to a Slice.
New Gradle target
Use the new lintFix Gradle task to apply all of the safe
fixes suggested by the lint check directly to the source code. An example of a
lint check that suggests a safe fix to apply is SyntheticAccessor.
Metadata updates
Various metadata, such as the service cast check, have been updated for lint checks to work with Android 9 (API level 28).
Warning if running lint on a new variant
Lint now records which variant and version a baseline is recorded with, and lint warns you if you run it on a different variant than the one with which the baseline was created.
Improvements to existing lint checks
Android Studio 3.2 includes many improvements to existing lint checks. For example, the resource cycle checks now apply to additional resource types, and the translation detector can find missing translations on the fly, in the editor.
Issue IDs more discoverable
Issue IDs are now shown in more places now, including in the Inspection
Results window. This makes it easier for you to find the information that you
need to enable or disable specific checks through lintOptions in
build.gradle.
For more information, see Configure lint options with Gradle.
Data Binding V2
Data Binding V2 is now enabled by default and is compatible with V1. This means that, if you have library dependencies that you compiled with V1, you can use them with projects using Data Binding V2. However, note that projects using V1 cannot consume dependencies that were compiled with V2.
D8 desugaring
In Android Studio 3.1, we integrated the desugaring step into the D8 tool as an experimental feature, reducing overall build time. In Android Studio 3.2, desugaring with D8 is turned on by default.
New code shrinker
R8 is a new tool for code shrinking and obfuscation that replaces ProGuard. You
can start using the preview version of R8 by including the following in your
project’s gradle.properties file:
android.enableR8 = true
Changed default ABIs for multi-APKs
When building multiple APKs that
each target a different ABI, the plugin no longer generates APKs for the
following ABIs by default: mips, mips64, and armeabi.
If you want to build APKs that target these ABIs, you must use
NDK r16b or lower and specify the ABIs
in your build.gradle file, as shown below:
    splits {
        abi {
            include 'armeabi', 'mips', 'mips64'
            ...
        }
    }
    splits {
        abi {
            include("armeabi", "mips", "mips64")
            ...
        }
    }
Note: This behavior change is also included in Android Studio 3.1 RC1 and higher.
Improved editor features for CMake build files
If you use CMake to add C and C++ code to your project, Android Studio now includes improved editor features to help you to edit your CMake build scripts, such as the following:
- Syntax highlighting and code completion: The IDE now highlights and suggests code completion for common CMake commands. Additionally, you can navigate to a file by clicking it while pressing the Control key (Command on Mac).
- Code reformatting: You can now use IntelliJ’s code reformat option to apply code styles to your CMake build scripts.
- Safe refactoring: The IDE’s built-in refactoring tools now also check if you are renaming or deleting files that you reference in your CMake build scripts.
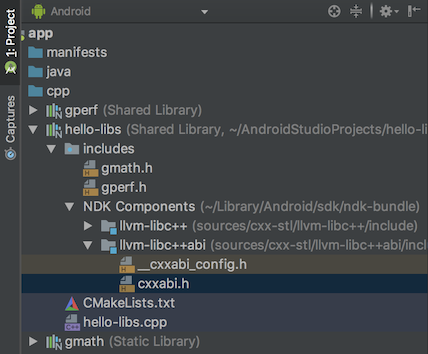
Navigate external header files
When using the Project window in previous versions of Android Studio, you could navigate and inspect only the header files that belong to libraries you build from a local project. With this release, you can now also view and inspect header files included with external C/C++ library dependencies that you import into your app project.
If you already include C/C++ code and libraries in your project, open the Project window on the left side of the IDE by selecting View > Tool Windows > Project from the main menu and select Android from the drop-down menu. In the cpp directory, all headers that are within the scope of your app project are organized under the include node for each of your local C/C++ library dependencies, as shown below.
Native multidex enabled by default
Previous versions of Android Studio enabled native multidex when deploying the
debug version of an app to a device running Android API level 21 or higher. Now,
whether you’re deploying to a device or building an APK for release, the Android
plugin for Gradle enables native multidex for all modules that set
minSdkVersion=21 or higher.
AAPT2 moved to Google's Maven repository
Beginning with Android Studio 3.2, the source for AAPT2 (Android Asset Packaging Tool 2) is Google's Maven repository.
To use AAPT2, make sure that you have a google() dependency in your
build.gradle file, as shown here:
    buildscript {
        repositories {
            google() // here
            jcenter()
        }
        dependencies {
            classpath 'com.android.tools.build:gradle:3.2.0'
        }
    }
    allprojects {
        repositories {
            google() // and here
            jcenter()
        }
    }
    buildscript {
        repositories {
            google() // here
            jcenter()
        }
        dependencies {
            classpath("com.android.tools.build:gradle:3.2.0")
        }
    }
    allprojects {
        repositories {
            google() // and here
            jcenter()
        }
    }
The new version of AAPT2 fixes many issues, including improved handling of non-ASCII characters on Windows.
Removal of configuration on demand
The Configure on demand preference has been removed from Android Studio.
Android Studio no longer passes the --configure-on-demand
argument to Gradle.
ADB Connection Assistant
The new ADB Connection Assistant provides step-by-step instructions to help you set up and use a device over the Android Debug Bridge (ADB) connection.
To start the assistant, choose Tools > Connection Assistant.
The ADB Connection Assistant provides instructions, in-context controls, and a list of connected devices in a series of pages in the Assistant panel.
Emulator improvements
You can now save and load snapshots of an AVD (Android virtual device) at any time in the Android Emulator, making it fast and easy to return an emulated device to a known state for testing. When you edit an AVD using the AVD Manager, you can specify which AVD snapshot to load when the AVD starts.
Controls for saving, loading, and managing AVD snapshots are now in the Snapshots tab in the emulator's Extended controls window.
For details, see Snapshots.
For additional information on what’s new and changed in the Emulator, see the Emulator release notes.