
The following are new features in Android Studio Flamingo.
Patch releases
The following is a list of the patch releases in Android Studio Flamingo.
Android Studio Flamingo | 2022.2.1 Patch 2 (May 2023)
This minor update includes these bug fixes.
Android Studio Flamingo | 2022.2.1 Patch 1 (May 2023)
This minor update includes these Android Gradle plugin bug fixes.
Themed app icons and dynamic color
With the introductions of dynamic color in Material 3 and themed app icons in Android 13, you can now create layouts or launcher icons that are tinted to inherit the coloring of the user's chosen wallpaper. You can use this feature starting with Android Studio Flamingo Beta 1.
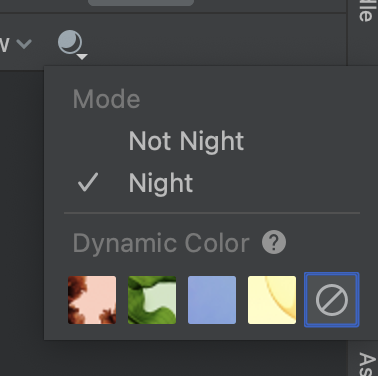
Themed app icons preview support
For launcher.xml files, you can now use the new System UI Mode selector on
the toolbar to switch wallpapers and see how your
themed app icons react to different users' chosen wallpaper.
![]()
Dynamic color preview
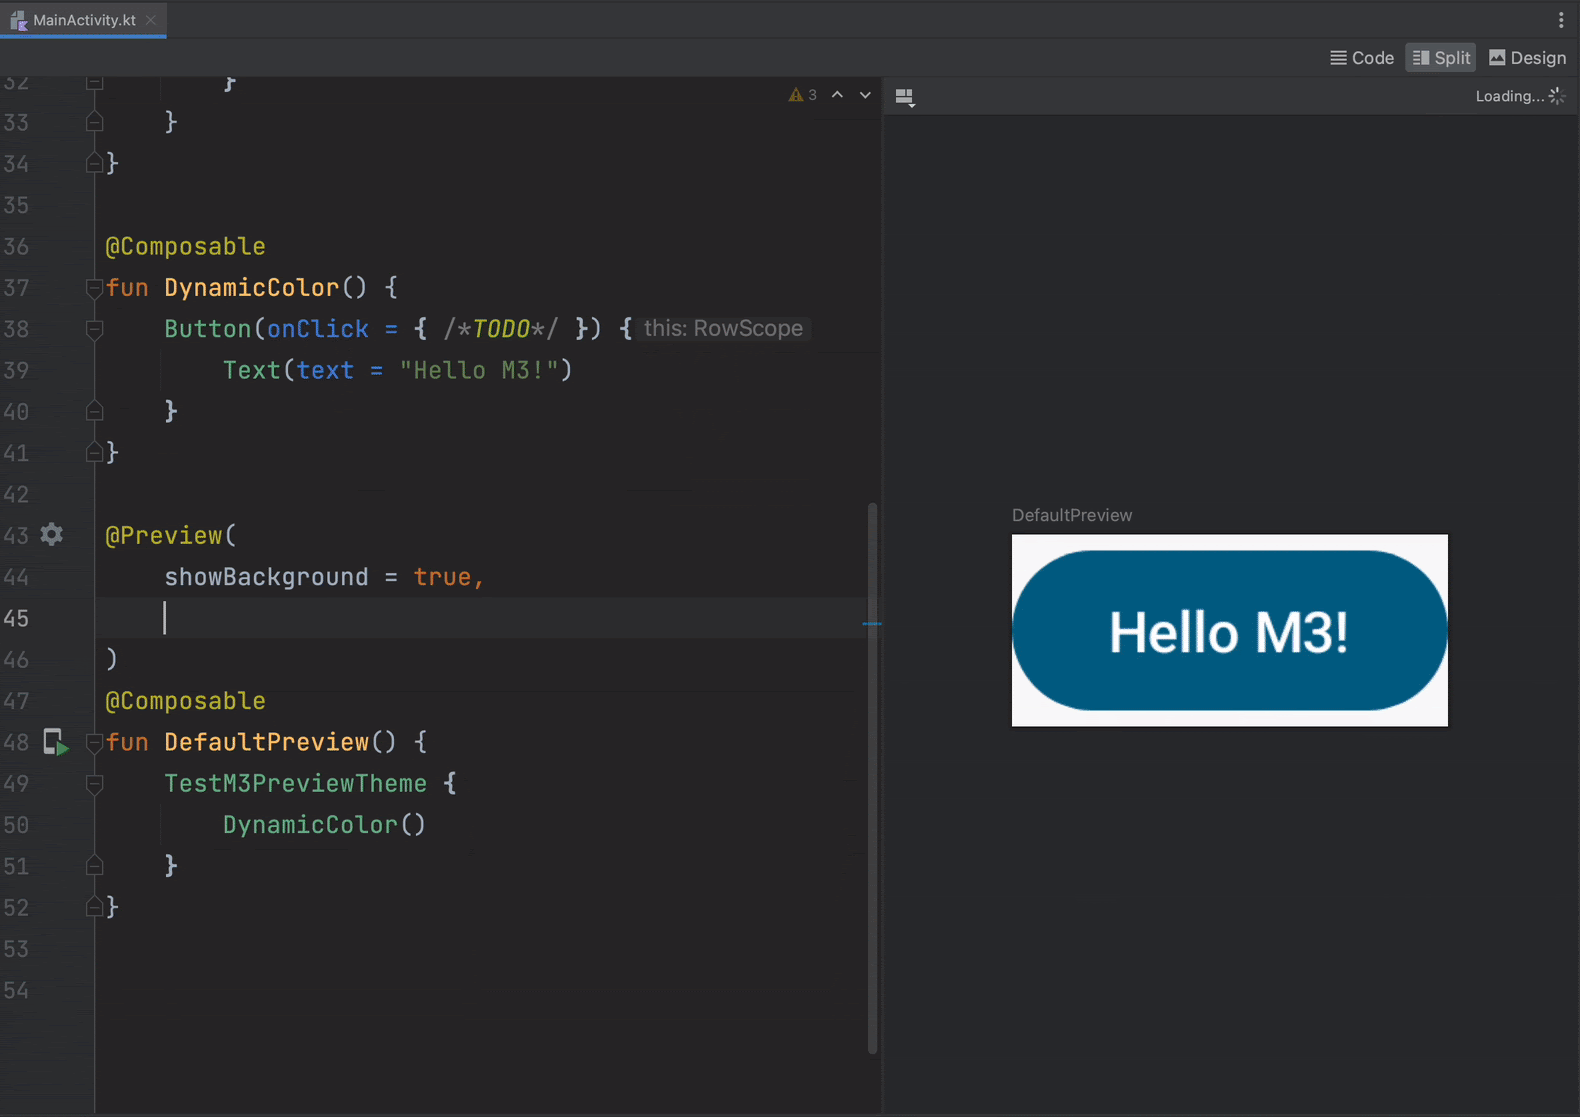
For Compose Preview: We've added a new attribute, wallpaper, to the
Composable Preview annotation. If
you've enabled
dynamic color
in your app, you can use this new attribute to switch wallpapers and see how
your UI reacts to different users' chosen wallpaper. To use this feature, you
must use Compose 1.4.0-alpha03 or higher.
For Android XML: If you've enabled dynamic color in your app, you can now use the new System UI Mode selector on the toolbar to switch wallpapers and see how your layouts react to different user's chosen wallpaper. Note that you must first select to change the theme to a Material dynamic color theme, then change the wallpaper.
Updates to Live Edit
Live Edit now has two modes: manual and automatic. In manual mode, your code
changes are applied every time you manually save using Ctrl + S (Command+
S for macOS). In automatic mode, when you update a composable function, your
changes are applied in your device or emulator as you make that change. To
choose the mode you want to run Live Edit in, go to File > Settings from
the menu bar (or Android Studio > Preferences on macOS), click on
Editor > Live Edit, and check the Push Edits Manually or
Push Edits Automatically box.
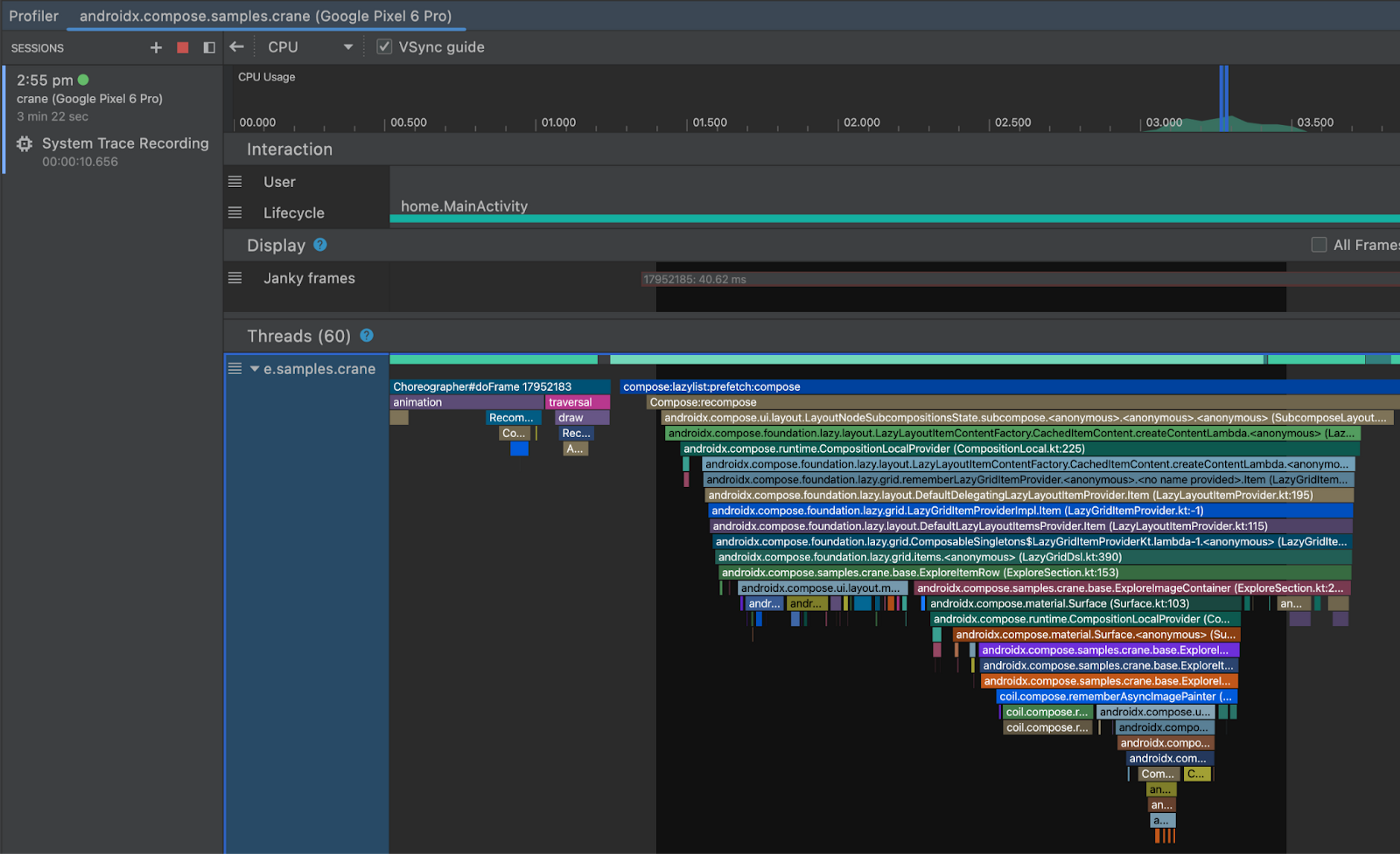
Compose Tracing
The System tracing utility is an Android tool that saves device activity to a trace file, which provides an overall picture of your app's system processes for a given period of time. Starting with Android Studio Flamingo, you can view your Compose functions in the System Trace profiler using Compose Tracing. Compose Tracing gives you the low intrusiveness from System tracing with method tracing levels of detail in composition, helping you understand which Compose functions are actually being recomposed.
To get started with recomposition tracing, you need to update to at least the following versions:
- Android Studio Flamingo Canary 5
- Compose UI: 1.3.0-beta01
- Compose Compiler: 1.3.0
- The device or emulator you run your trace on must be at least API level 30.
Additionally, you need to add the following dependency on Compose Runtime Tracing:
implementation("androidx.compose.runtime:runtime-tracing:1.0.0-alpha01")
To view recomposition tracing, open the Android Studio Profiler and select the CPU profiler. Navigate your app to the UI that you want to trace and then select System Trace and Record. While recording, use your app in order to cause recomposition. Once you stop recording and the trace processes, you can see the Compose functions in the recomposition trace directly in the Threads timeline. You can also see the Compose functions in the Flame Chart, Top Down, Bottom Up, and Events tabs from the Analysis pane.
This is an experimental feature in active development, and we welcome you to provide feedback. For more details, see Compose tracing.
Updates to project templates
Android Studio Flamingo Canary 6 includes new templates for creating a project or module. By default, templates use Compose Material 3 unless they are specified as a Views template. We recommend using the Compose Material 3 templates (for example, Empty Activity) as the best practice for creating an Android app. To learn more, see the Compose Material 3 reference.
To view the templates, go to open the New Project or Create New Module wizard by selecting File > New > New Project or New Module from the main menu.
Device mirroring
Minimize the number of interruptions when developing by streaming your device display directly to Android Studio. Device mirroring gives you the ability to interact with a physical device using the Running Devices window in Studio. To enable this feature, go to File > Settings > Tools > Device Mirroring and check the box next to Enable mirroring of physical Android devices. Once enabled, connect your device and either deploy your app or open the Running Devices window to begin streaming the device's display and interacting with it from the IDE.
To get started, ensure you are connected to a device. All devices that you are connected to are mirrored in tabs in the Running Devices window, which you can open by navigating to View > Tool Windows > Running Devices. When you deploy an app or test to a connected device, the Running Devices window appears automatically and shows the mirrored device.
Privacy notice
If device mirroring is enabled, Android Studio automatically starts device
mirroring for any connected and paired device. This might result in information
disclosure for devices connected with the adb tcpip command because the
mirroring information and commands are passed over a non-encrypted channel. In
addition, Android Studio uses a non-encrypted channel to communicate with the
adb server, so mirroring information can be intercepted by other users on your
host machine.
Network Inspector traffic interception
Starting with Android Studio Flamingo Canary 1, the Network Inspector shows all traffic data for the full timeline by default. You can select a range within the timeline to see only the traffic in that range.
You can also create and manage rules that help test how your app behaves when encountering different responses such as status codes, and response headers and bodies. The rules determine what responses to intercept and how to modify these responses before they reach the app. You can choose which rule to enable or disable by checking the Active box next to each rule. Rules are automatically saved every time you modify them.
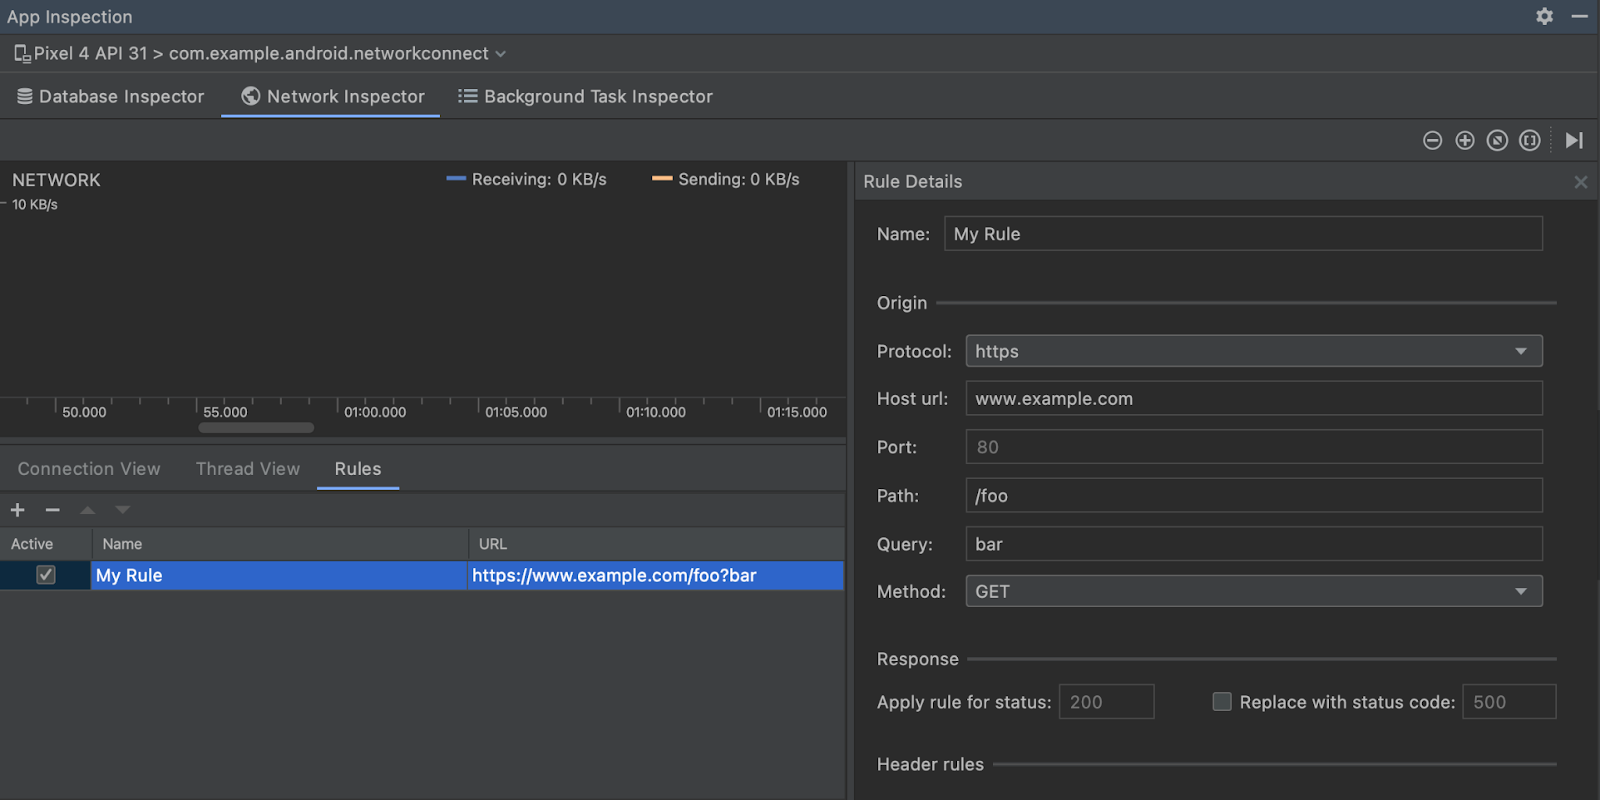
To get started, navigate to the Rules tab in the Network Inspector and click + to create a new rule. In the Rule Details panel, name your new rule and include information about the origin of the response you want to intercept under the Origin subsection. The URL in the Rules table should update based on the changes you made to the origin of the response. All fields in this subsection are optional.
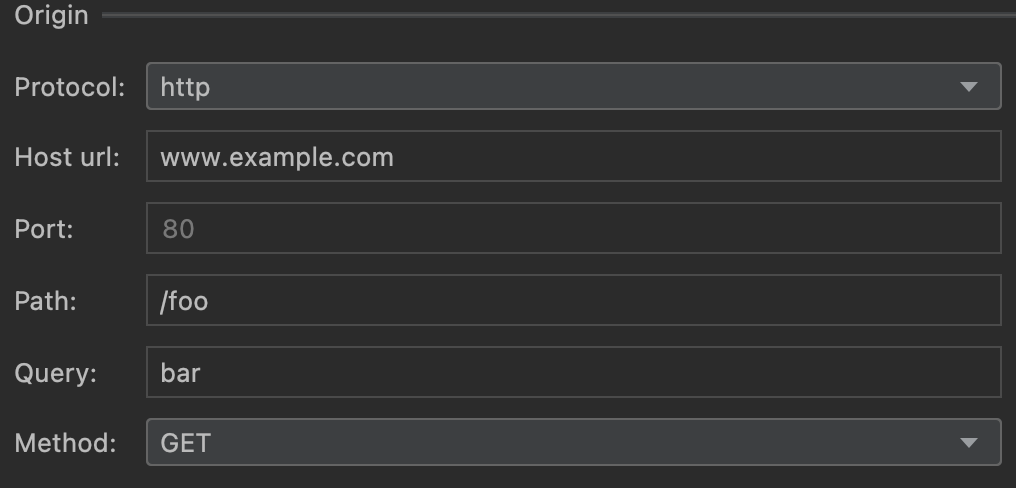
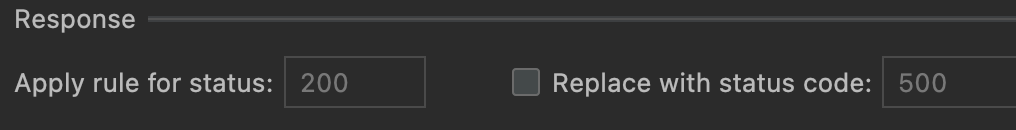
From the Response subsection, you can modify the response before it's sent to your app. For example, you can set the rule to execute on responses with a specific status code as well as modify that status code.
Modify headers
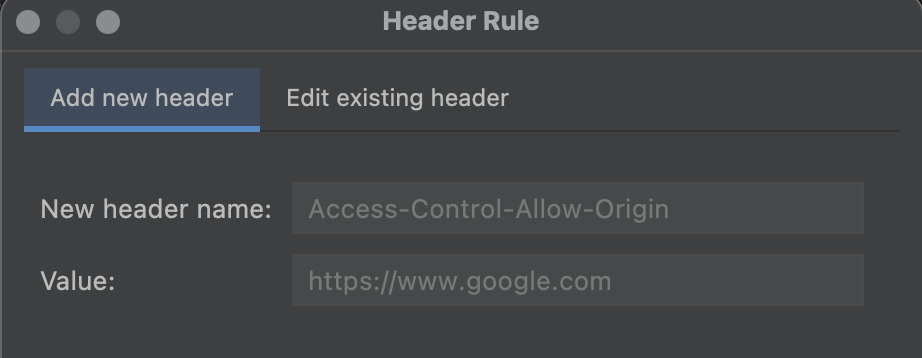
In the Header rules subsection, you can create multiple sub-rules that add
or modify headers in a response. When you create multiple header rules, use the
up and down arrows  at the top of the Rules table to change the order of the header rules. The
order affects the header of the modified response because the header rules are
applied in the order that they are listed.
at the top of the Rules table to change the order of the header rules. The
order affects the header of the modified response because the header rules are
applied in the order that they are listed.
To get started, click + in the Header rules section.
To add a header, enter a name and value for the header in the Add new header section.
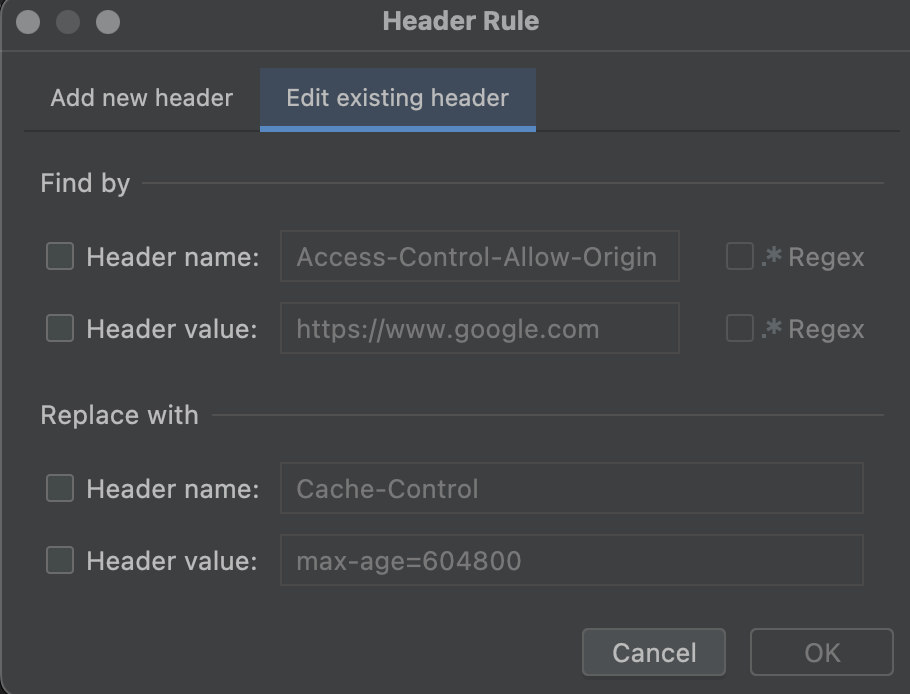
To modify a header, navigate to the Edit existing header tab and specify the header name or value that you want to find. Enter a header name or value that you want to replace it with.
Modify response body
You can also create sub-rules to modify the body of the response. You can choose to either Find and Replace a section of the body, in which the first instance in the body is replaced; or, you can choose to replace the entire content of the body by selecting Replace entire body.
Similar to Header rules, you can create multiple body rules that are applied in the order that they are listed in the table.
Auto-connect to foreground process in Layout Inspector
The Layout Inspector now automatically connects to apps on virtual or physical devices. Specifically, the Layout Inspector automatically connects to debuggable processes running in the foreground of a connected device. If you have feedback on this feature, please file a bug.
Updates to App Quality Insights
Android Studio Flamingo Canary 5 and higher introduce multiple new App Quality Insights features that help you focus on high priority issues and collaborate with your development team.
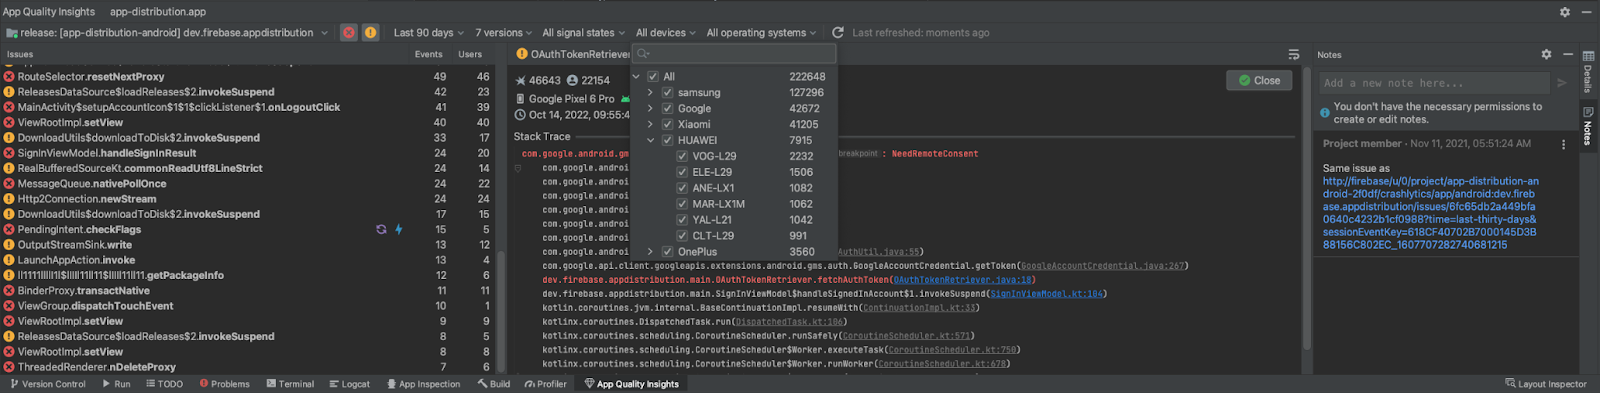
New filters and filter search
To help you identify the most important issues, you can now filter by the following attributes. Each filter is sorted by the number of events, so you can see where most events occur.
- Android platform version
- Device make and model
Crashlytics Signal: Signal icons also appear next to associated issues in the Issues panel so you can see counts and signals side by side. An issue is considered regressed when it's been closed in the past and has reoccurred in a new version of the app.
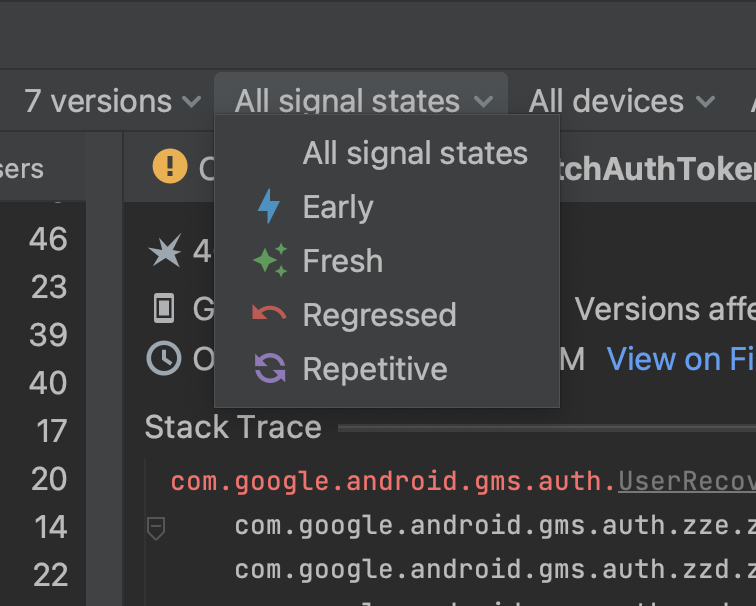
App version: This filter now includes a higher-level Play track filter that you can use to automatically select versions in the production, open, closed and/or internal testing tracks.
In addition, filters with lots of options are now searchable so you can customize your view faster, without scrolling through all the menu options.
Annotate and close issues directly from Android Studio
To make it easier for you to collaborate with teammates, you can now do the following directly in the App Quality Insights tool window:
Close issues. To close an issue, click the Close button in the main stack trace panel. Recently closed issues appear in the Issues panel with strikethrough. You can reopen issues that have been recently closed by clicking on the button again. However, once you refresh the App Quality Insights tool window, closed issues are no longer visible.
Read and attach notes to issues so that they are visible in the Firebase Console and your teammates. To write a note about an issue, select the issue and open the Notes panel. You must have write permission to the Crashlytics project in order to write notes. Issues with notes appear with a "notes" icon
 in the Issues panel.
If you're new to App Quality Insights and would like to learn more, see the earlier release note.
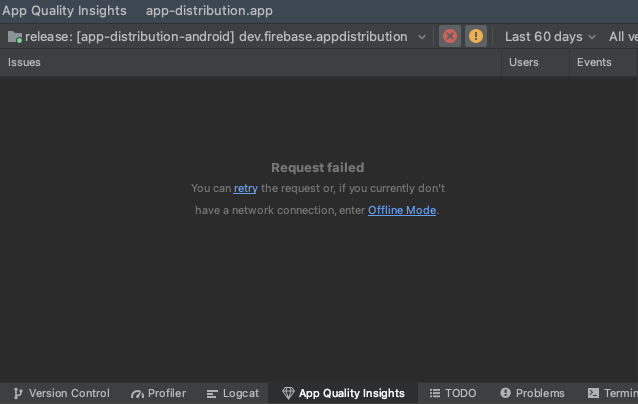
Investigate with limited functionality when offline
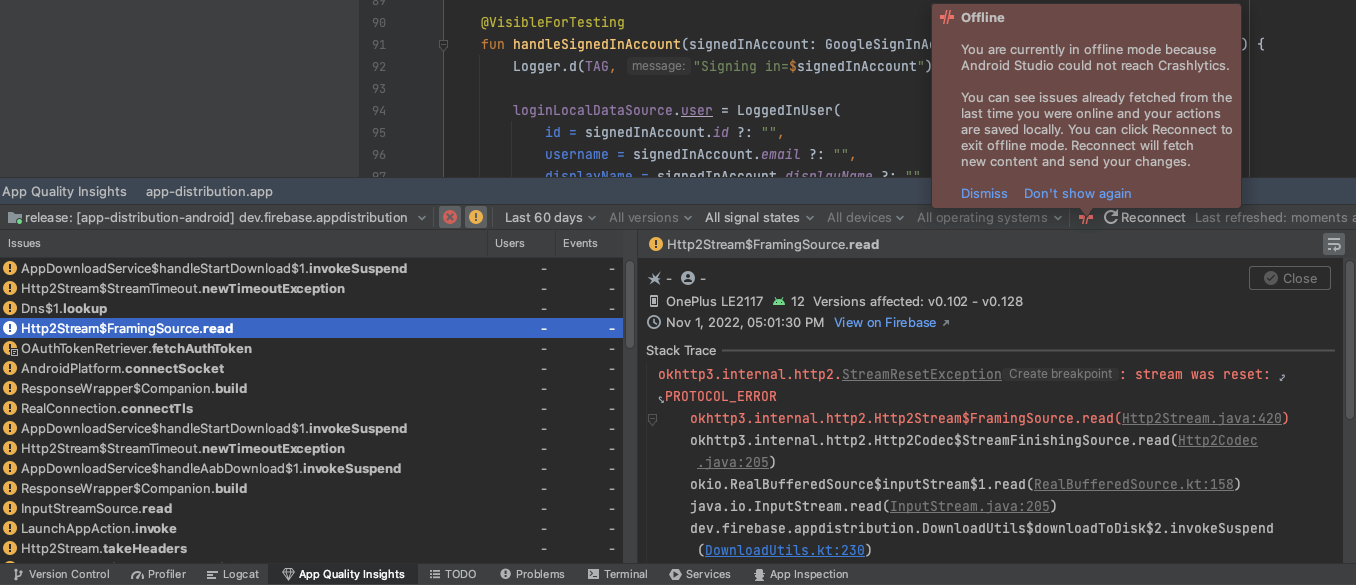
Starting with Android Studio Flamingo Canary 8, you can do some actions in the App Quality Insights tool window while offline. If you make a new request, such as by clicking Refresh, and Android Studio is unable to communicate with Crashlytics, the App Quality Insights window allows you to enter Offline Mode.
While in this mode, you can continue to investigate issues and the latest events from cached data. Certain functionality, such as changing some filter options or closing issues, is not available. To retry your connection to Crashlytics and return to an online state, click Reconnect.
One-click automated profileable build and run
Android Studio Flamingo and AGP 7.3 introduces one-click automated profileable
builds, which makes it easier to configure a
profileable app and profile it. This
feature requires a virtual or physical test device running API level 29 or
higher. To use the feature, click the arrow next to the Profile app icon
![]() and choose between two options:
and choose between two options:
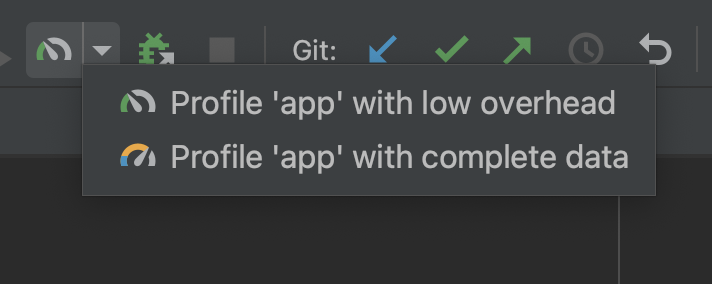
Profile 'app' with low overhead starts the CPU and Memory profilers. In the Memory profiler, only Record Native Allocations is enabled.
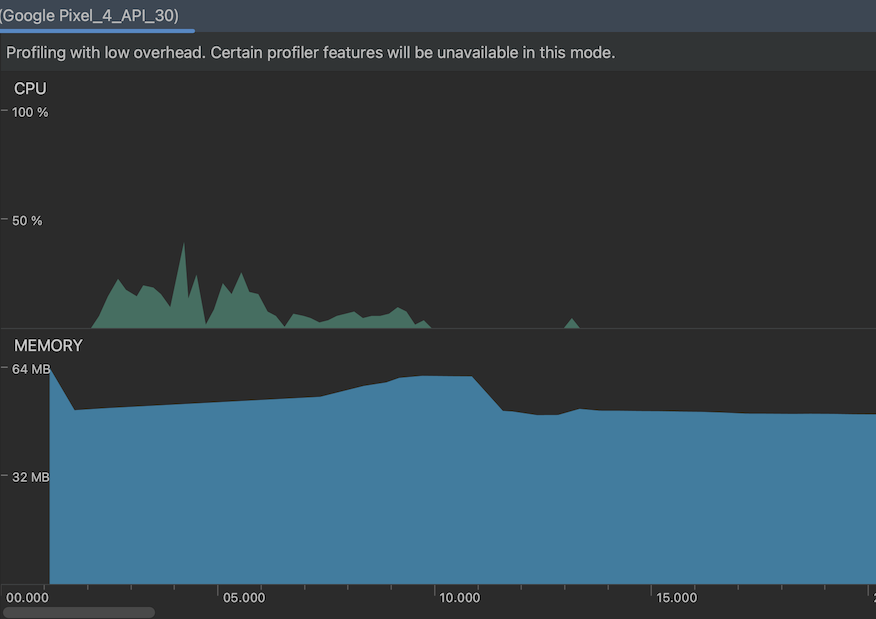
Profile 'app' with complete data starts the CPU, Memory, and Energy profilers.
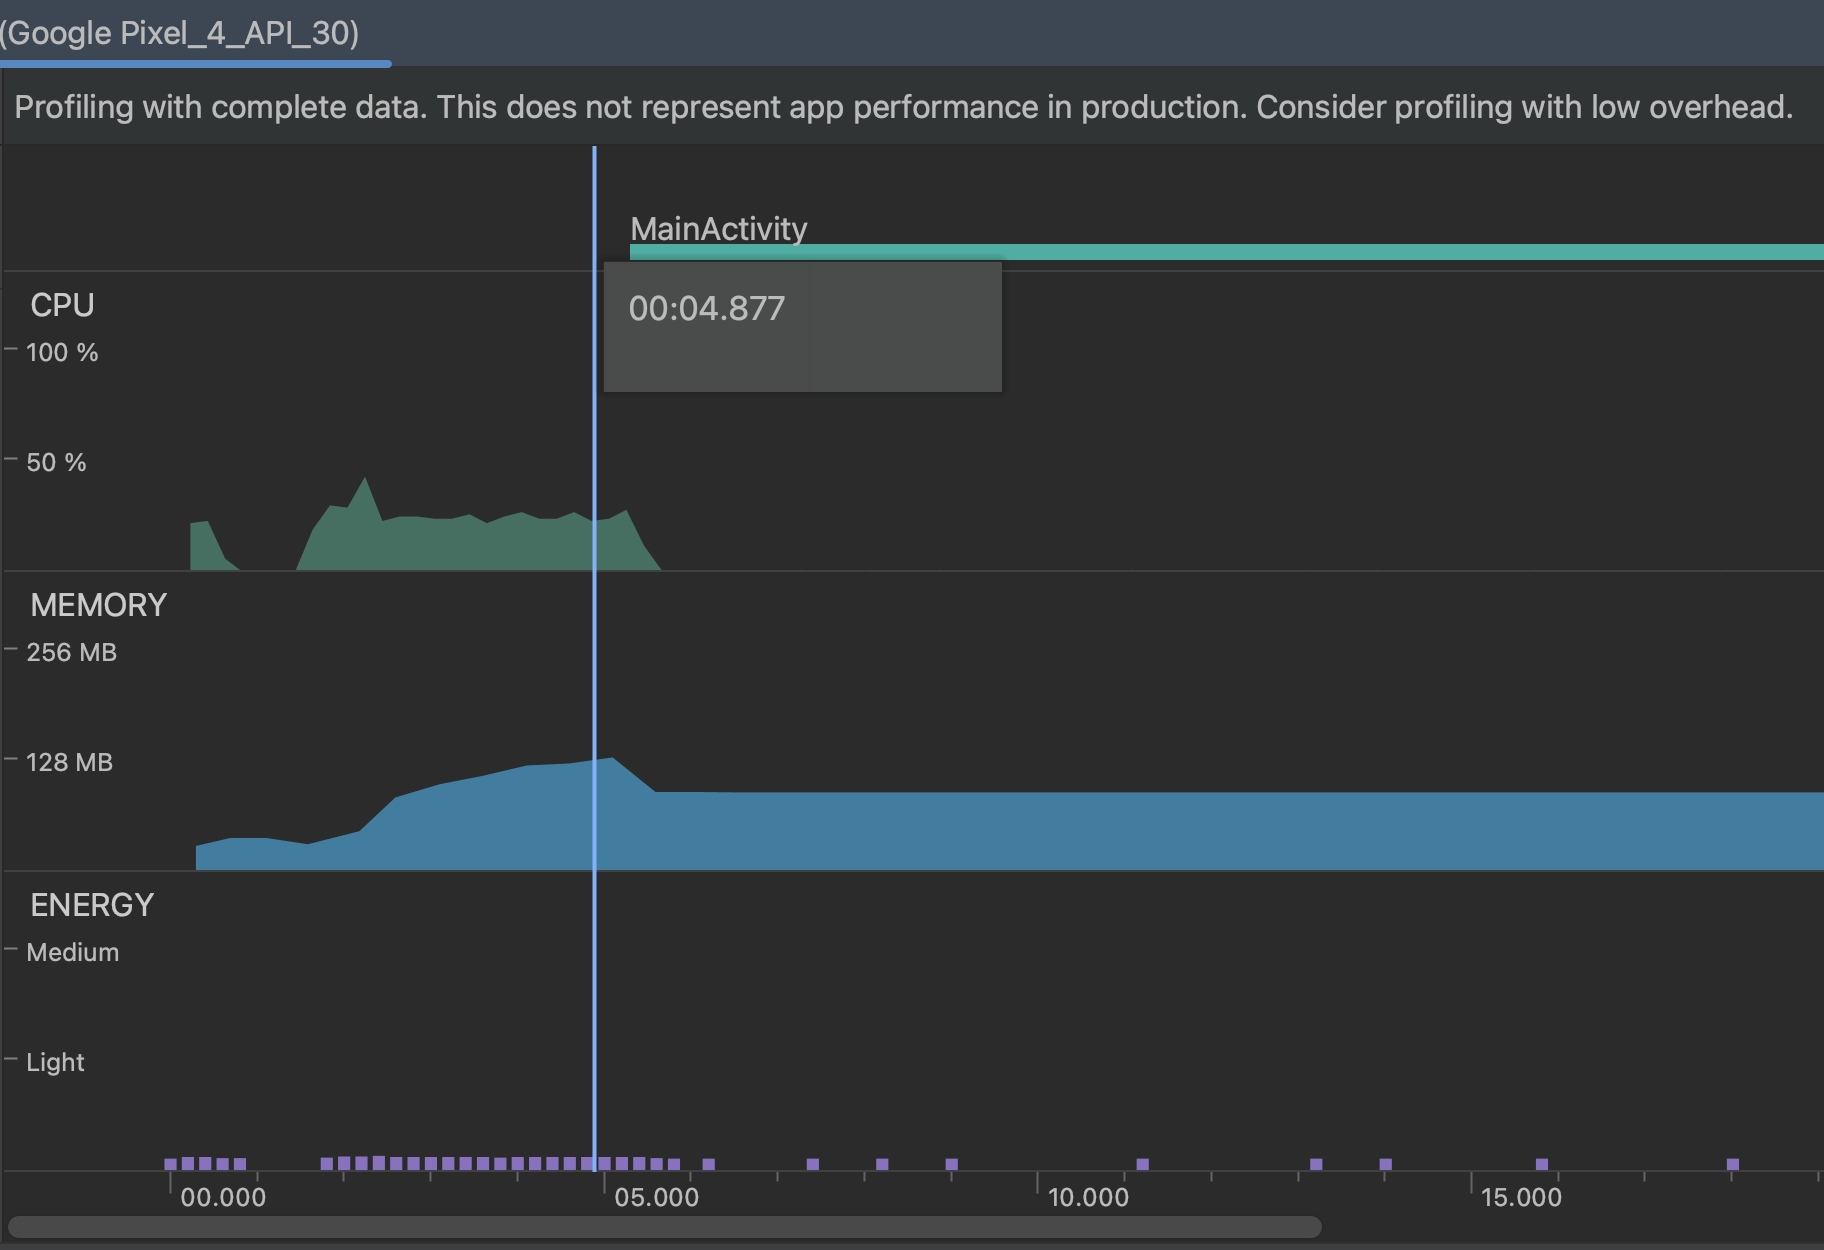
To learn more about testing your app with minimal performance costs, see Profileable applications.
Lint support for SDK extensions
Android Studio Flamingo provides lint support for SDK extensions. This feature allows you to update the lint tool's API check to correctly enforce API access in the presence of API backports and for new API surfaces like the Android Privacy Sandbox.
The lint tool's API check makes sure that your code only uses APIs available to
you as gated by minSdkVersion or by an SDK_INT check. With SDK extensions,
an API can exist in multiple SDKs. For example, an API introduced in Android U
can also be added to the Android R, S, and T backport extensions. Furthermore,
apps can specify multiple APIs as required using their manifest, and there are
new APIs for checking whether individual extensions are available. The lint tool
now handles the logic to check for overlap in what's required and what's known
to be present.
Finally, there are Studio IDE features associated with API checking. This feature can now handle API violations for the new API surfaces, perform necessary checks, and register quick fixes, one per available API surface.
IntelliJ IDEA 2022.2 platform update
Android Studio Flamingo Canary 1 includes the IntelliJ IDEA 2022.2 updates, which improve the IDE experience. For details on the changes, see the IntelliJ IDEA 2022.2 release notes.
Android Studio bundled with JDK 17
Starting from Android Studio Flamingo Canary 3, the Studio IDE is bundled with JDK 17. If Android Studio is configured to use the embedded JDK, new projects will use the latest stable version of the Android Gradle plugin and JDK 17. However, existing projects might break, and you might have to manually set the JDK to a compatible version.
To learn more, see Set the JDK version.