
The following are new features in Android Studio Electric Eel.
Updates to Logcat
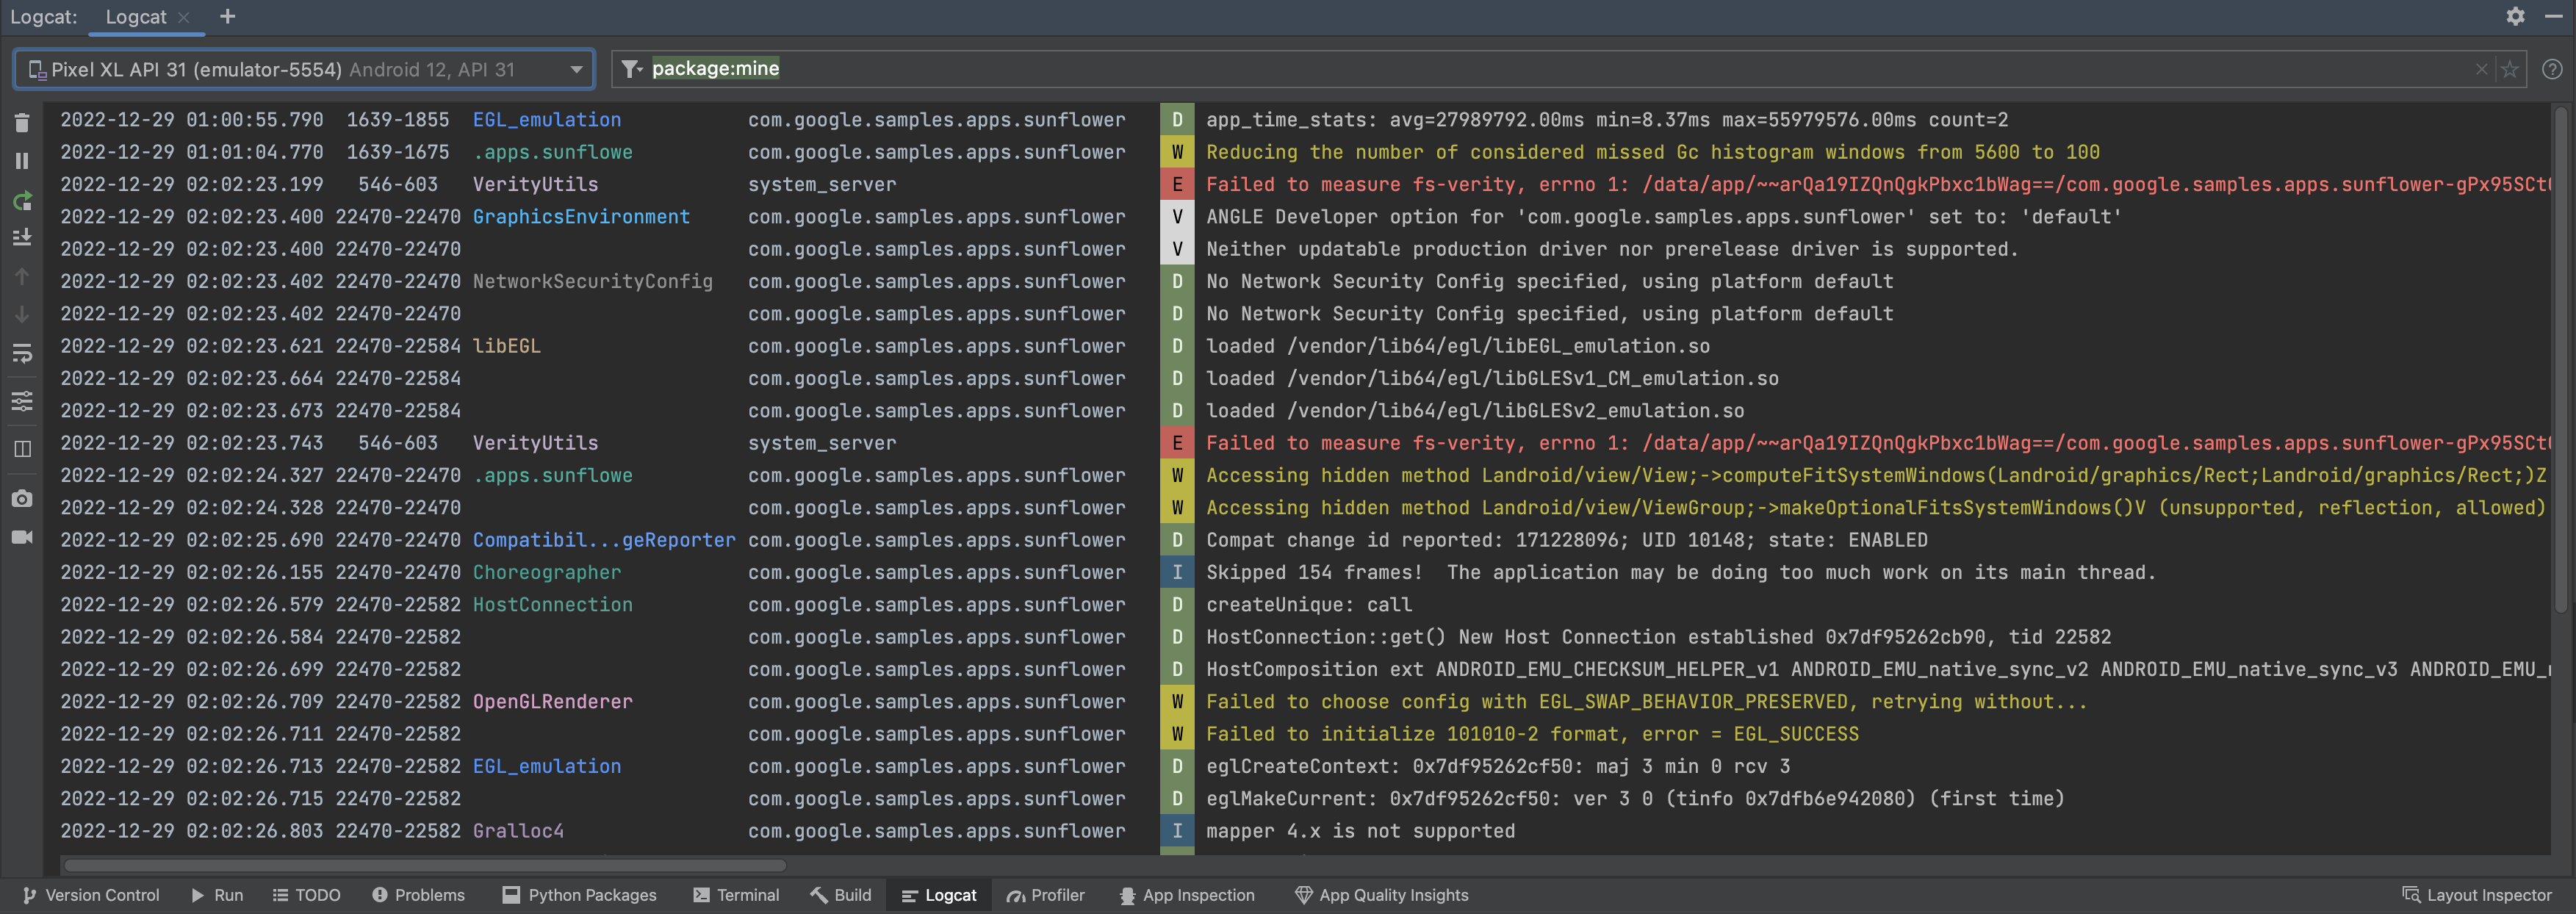
In Android Studio Electric Eel, the new version of Logcat is enabled by default to make it easier to parse, query, and keep track of logs. This represents the most significant update to the tool since its introduction, so read View logs with Logcat for more details on how to use the new functionality and query syntax.
App Quality Insights from Firebase Crashlytics
Starting with Android Studio Electric Eel, you can see and act on app crash data from Firebase Crashlytics directly in the IDE. This integration pulls stack trace data and crash statistics from Crashlytics into the new App Quality Insights tool window in the IDE, so you don't have to jump back and forth between your browser and the IDE. Development teams can benefit from key capabilities including the following:
- See lines in your code highlighted when they have related Crashlytics event data.
- See the stack trace for top crashes and click on the stack trace to jump to the relevant lines in your code.
- See summary statistics about top crash and non-fatal events, for example grouped by device manufacturer and Android version.
- Filter events by severity, time, and app version.
- Get a browser link that opens the Crashlytics dashboard page with more details about the event.
With the Android Studio and Crashlytics integration, you can write code and address top crash issues all in the same spot. This enriched development experience helps you stay informed about your app's performance and minimize disruptions for your users. If you encounter any issues with this feature, file a bug.
If you're not using Crashlytics yet and would like to learn more about its offerings, see Firebase Crashlytics.
Get started
To see Crashlytics data in Android Studio, you need to set up Firebase and Crashlytics in your app project. Here's how: open the Firebase Assistant in Android Studio by going to Tools > Firebase, click Crashlytics, and then follow the tutorial to add Firebase and Crashlytics to your project. You can read more about the Firebase Assistant workflow in Firebase's getting started guide for Android.
If you've already added Firebase and Crashlytics to your app, sign in to your
Developer account in the IDE by clicking on the avatar icon
![]() .
After you sign in, click on the App Quality Insights tool window. You should
see the Issues, Sample Stack Trace, and Details panels populate with
reports from Crashlytics.
.
After you sign in, click on the App Quality Insights tool window. You should
see the Issues, Sample Stack Trace, and Details panels populate with
reports from Crashlytics.
Navigate Crashlytics data in Android Studio
The App Quality Insights tool window has rich data that gives you insight into the events your users are encountering, and links to help you quickly navigate to the sources of those events.

- If your project includes multiple app modules, make sure the module you want to see event data for is selected from the module dropdown menu.
- Use the application ID dropdown menu to select the app ID you want to analyze. For example, while you might work on the debug version of your app in the IDE, you might want to see event data for your production version of your app that your users install.
- The Issues panel shows the top events that Crashlytics has data for, and is sorted by your most impactful crashes.
The Sample Stack Trace panel shows details about the latest occurrence of the event you click on in the Issues panel. You can see the event's stack trace and click on the stack trace to jump to the relevant lines in your code base.
There is also information about the device type affected, its Android version, and the time the event occurred, as well a link to the event in the Firebase Crashlytics dashboard. The dashboard is useful if you want to dive deeper and inspect additional stack traces, trends, and custom logs.
- The Details panel breaks down the crash counts by device type and Android version, so you can determine which user groups are most affected. It also shows which app version(s) experienced the crash and the number of users affected.
- Use the severity filters to select or deselect events that are Fatal
 or Non-Fatal
 .
.
- Use the time range and app version filters to hone in on certain subsets of events.
In addition to being able to navigate from stack trace to code, you can also jump from code to stack trace: Android Studio now highlights lines of code that are related to crashes so you can easily spot and debug them.
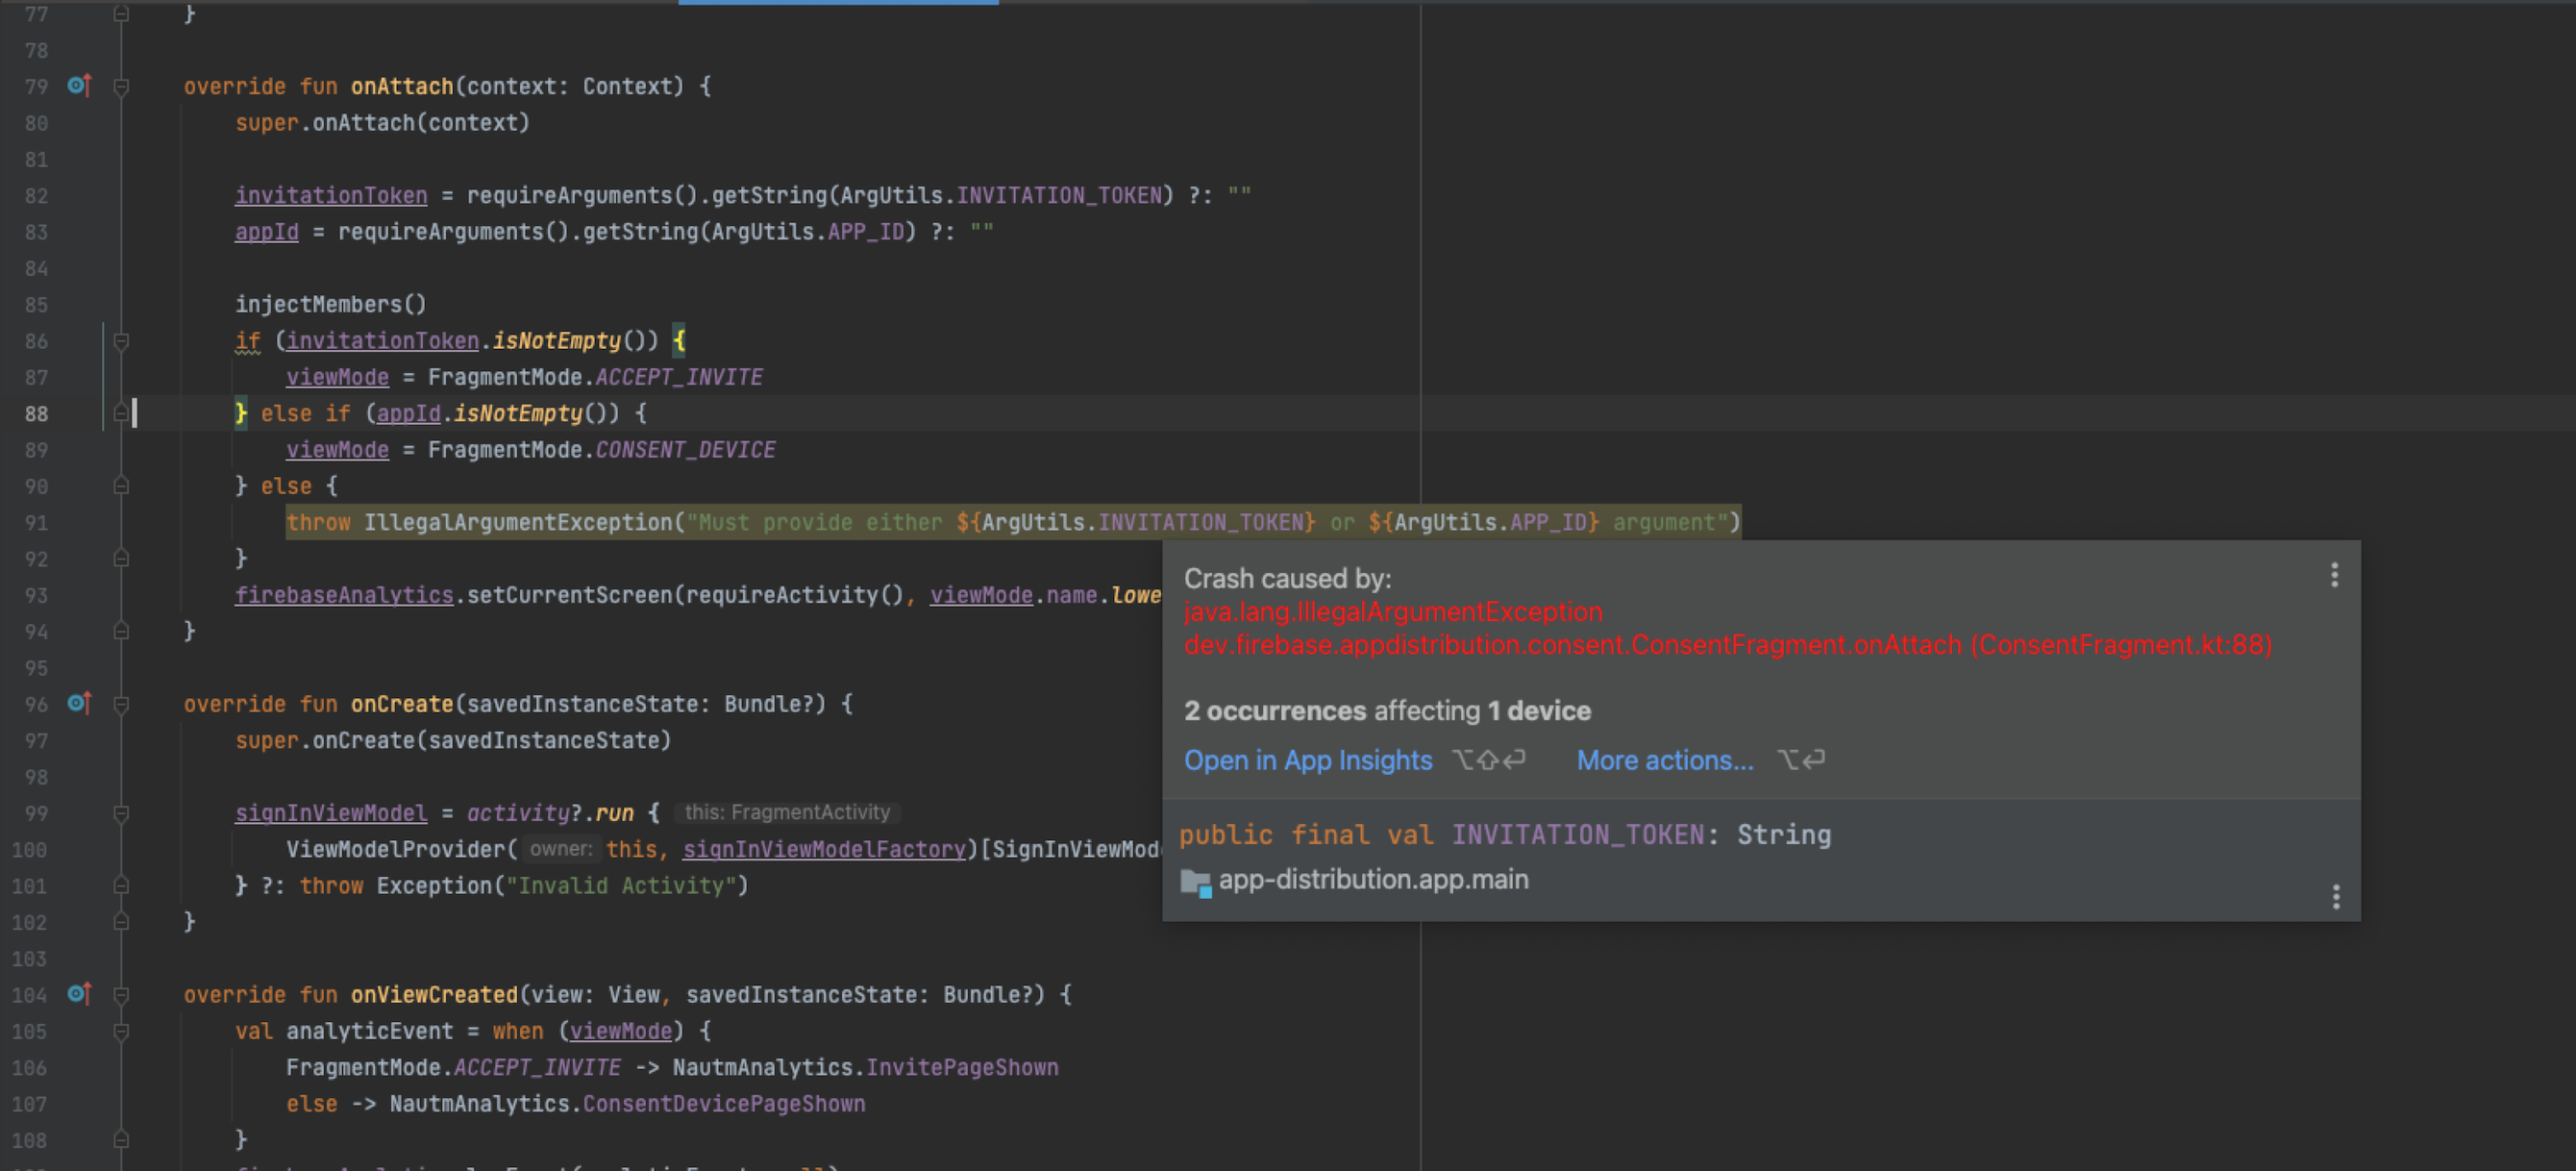
When you hover over a highlighted line of code, a pop-up appears that shows the event involved, its frequency, and the number of devices affected. You can click on Open in App Quality Insights to jump to the event details in the App Quality Insights tool window. To learn more, See Analyze issues from Firebase Crashlytics with App Quality Insights.
Live updates to your Compose Preview
Starting with Android Studio Electric Eel, you can see immediate updates to your Preview changes as you make them. For more information, see Preview your UI with composable previews.
Use Compose Preview with different devices
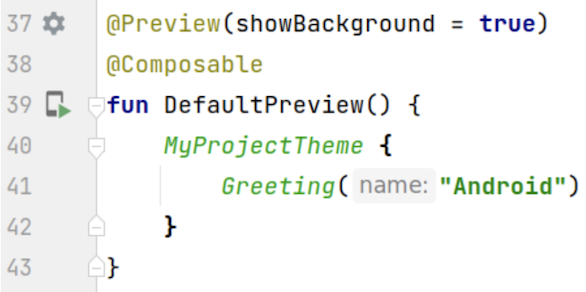
In Android Studio Electric Eel, you can edit the device parameter of the
Preview annotation to define configurations for your Composables in different
devices. For more details, see Use with different devices.

Layout Inspector recomposition rendering highlights
In Android Studio Electric Eel, your recompositions are highlighted to help you determine where in the UI your composables are recomposing. The highlighted portion shows a gradient overlay of the composable in the image section of the Layout Inspector, and gradually disappears so that you can get an idea of where in the UI the composable with the highest recompositions can be found. If one composable is recomposing at a higher rate than another composable, then the first composable receives a stronger gradient overlay color. For more details, see Compose recomposition counts in Layout Inspector.
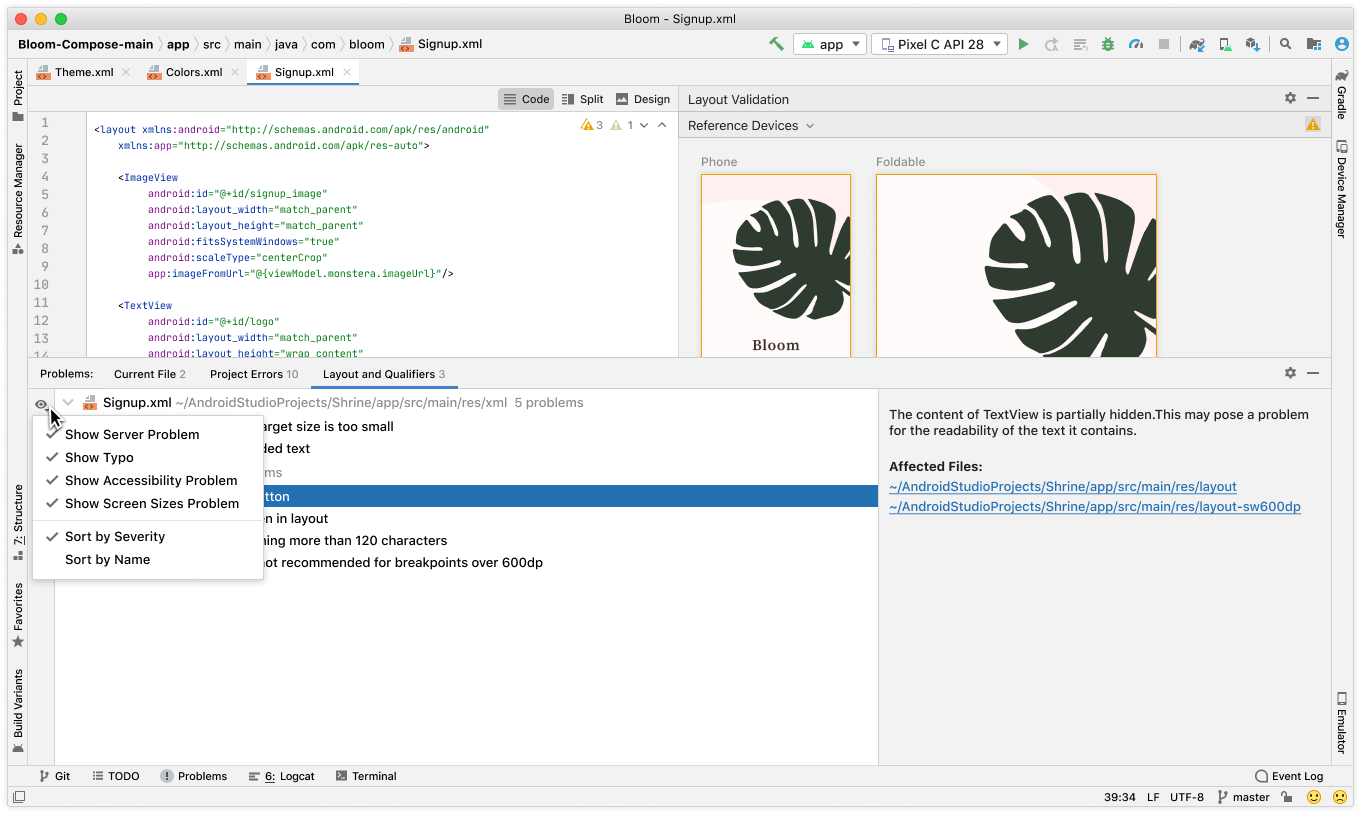
Visual linting for views
Android Studio now automatically runs your layout to check for visual lint issues across different screen sizes for layouts written in views. When you open Layout Validation, you can see all your layouts render in multiple device sizes. If there's an issue, it appears in the Problems panel, which is designed to show all issues within design tools.
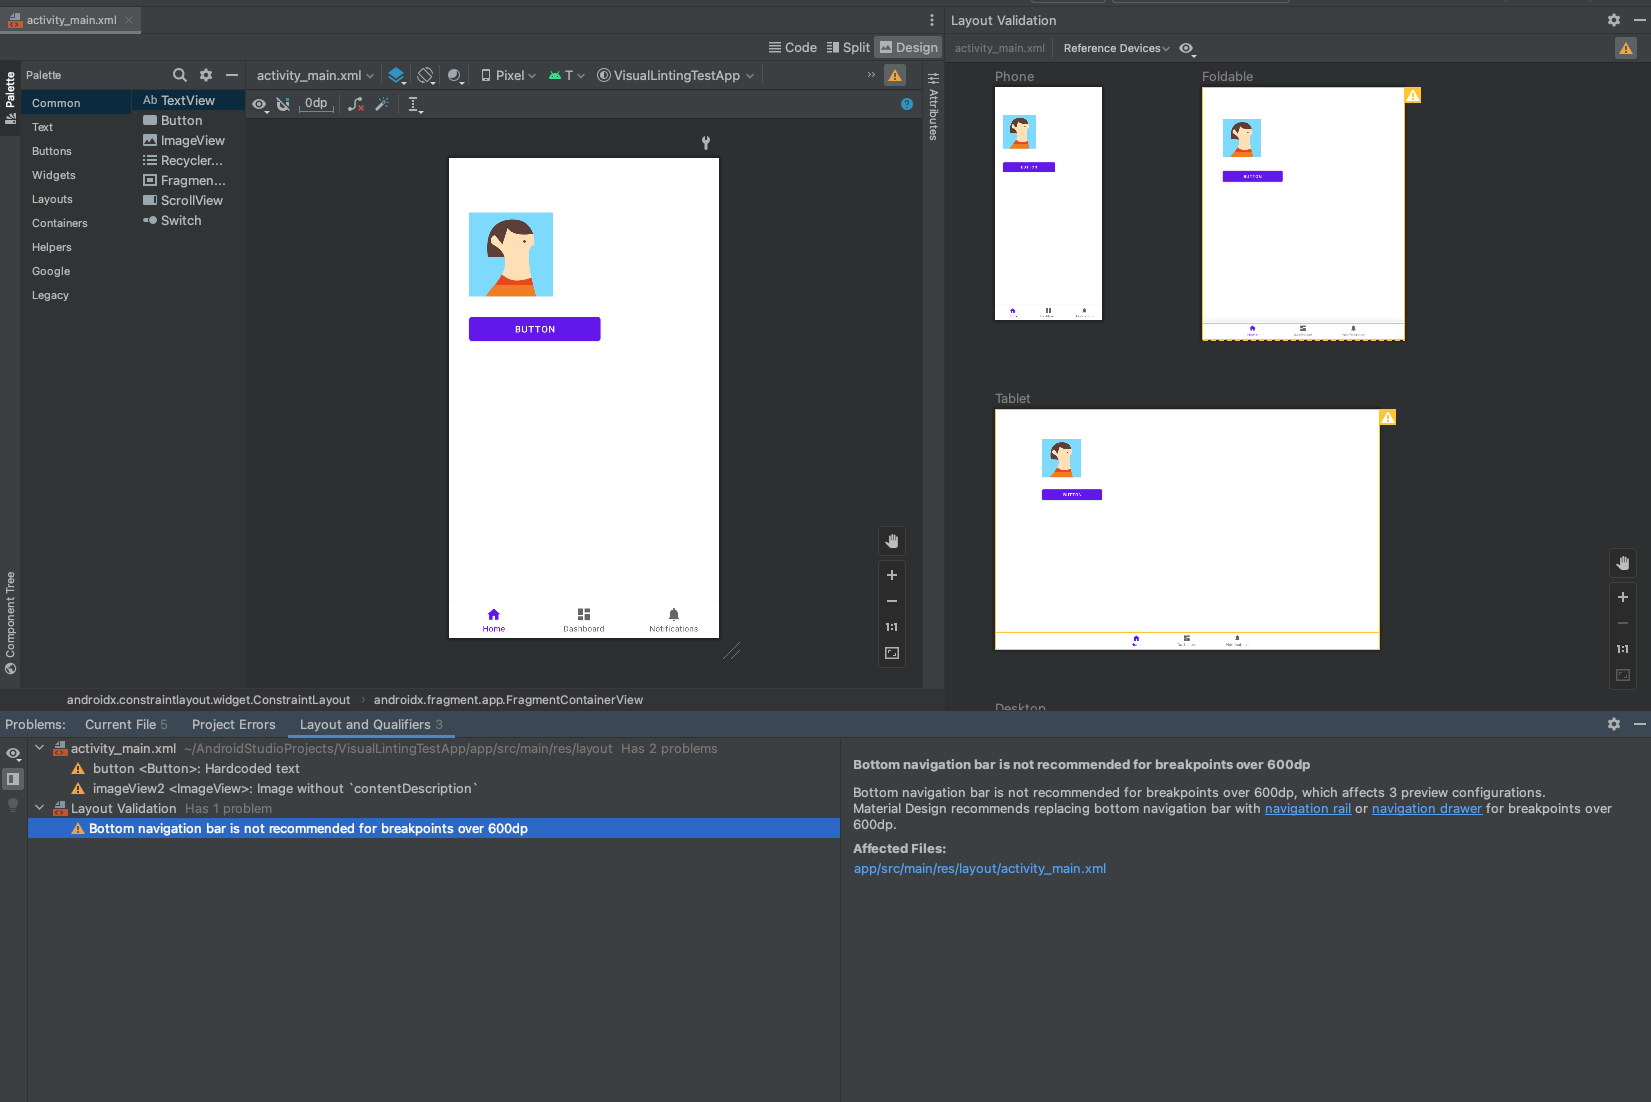
Universal Problems panel
You can now view all the issues for your design tools in a shared issue panel. To view the tool window, navigate to View > Tool Windows > Problems.
Resizable emulator
You can now test your app on multiple screen sizes and with a single resizable emulator. Testing on a single resizable emulator not only allows you to rapidly test changes across different interfaces, but also promotes a smoother development experience by saving the compute resources and memory that would be required to maintain separate virtual devices.
To use the resizable emulator, you need Android Emulator version 31.1.3 or higher. To upgrade versions, go to Tools > SDK Manager. To create a resizable Android Virtual Device (AVD), follow these steps:
- In the create device flow, select the Resizable (Experimental) phone hardware profile.
- Download the Android Tiramisu system image.
- Follow the prompts to create the AVD.
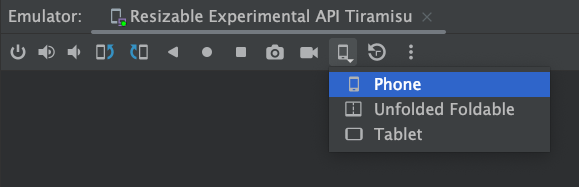
When you deploy your app to the resizable emulator, use the Display Mode dropdown in the emulator toolbar to quickly toggle between a set of common device types. The emulator screen resizes so you can easily test your app across a range of screen sizes and densities.
Desktop Android Virtual Device now available
You can now test how your app works on desktop devices such as Chromebooks by using a Desktop Android Virtual Device (AVD). Users often interact with apps differently on large screen devices, and the Desktop AVD enables you to see how your app behaves in this environment. Here are some of the unique functionalities you can test:
- App resizing: resize your app by dragging the window edges.
- Freeform window management: place your app in various places on the desktop screen, and minimize, maximize, and restore the app window.
- Notifications: check that the notifications render correctly when pulled up from the system tray on the desktop.
To learn more about Desktop AVDs and how to incorporate them in your testing workflow, see Desktop AVD in Android Studio on the ChromeOS developers blog.
Check download impact using Build Analyzer
Build Analyzer now provides a summary of time spent downloading dependencies and a detailed view of downloads per repository. You can use this information to determine whether unexpected dependency downloads are negatively impacting your build performance. This is especially important during incremental builds, which shouldn't consistently download artifacts.
Specifically, you can use this information to identify configuration issues, such as use of dynamic versions of dependencies that cause unexpected downloads. Also, if you see a high number of failed requests for a specific repository, it could indicate that the repository should be removed or moved lower in your repository configuration.
SDK insights
View dependency insights from the new Google Play SDK Index, a public portal with information about popular dependencies, or SDKs. If a specific version of a library has been marked as outdated by its author, a corresponding Lint warning appears when viewing that dependency definition. This enables you to discover and update dependency issues during development instead of later when you go to publish your app on the Play Console. You can learn more about this new tool on the Android Developer's Blog post here.
Patch releases
The following is a list of the patch releases in Android Studio Electric Eel.
Android Studio Electric Eel | 2022.1.1 Patch 2 (February 2023)
This minor update includes the following bug fixes:
| Fixed Issues | ||||
|---|---|---|---|---|
| Compose Preview |
|
|||
| Layout Editor |
|
|||
| Shrinker (R8) |
|
|||
Android Studio Electric Eel | 2022.1.1 Patch 1 (February 2023)
With the Patch 1 release, Android Studio Electric Eel now supports Kotlin 1.8. This minor update also includes the following bug fixes:
| Fixed Issues | ||
|---|---|---|
| Installer |
|
|
| Logcat |
|
|