
Android Studio 4.1 (August 2020)
Android Studio 4.1 is a major release that includes a variety of new features and improvements.
4.1.3 (March 2021)
This minor update includes various bug fixes. To see a list of notable bug fixes, read the related post on the Release Updates blog.
4.1.2 (January 2021)
<p>
  This minor update includes various bug fixes.
  To see a list of notable bug fixes, read the related post on the
  <a href="https://androidstudio.googleblog.com/2021/01/android-studio-412-available.html">
    Release Updates blog</a>.
</p>
<p><b>4.1.1 (November 2020)</b></p>

<p>
  This minor update includes various bug fixes.
  To see a list of notable bug fixes, read the related post on the
  <a href="https://androidstudio.googleblog.com/2020/11/android-studio-411-available.html">
    Release Updates blog</a>.
</p>
New Database Inspector
Inspect, query, and modify your databases in your running app using the new Database Inspector. To get started, deploy your app to a device running API Level 26 or higher, and select View > Tool Windows > Database Inspector from the menu bar.
To learn more, see Debug your database with the Database Inspector.
Run the Android Emulator directly in Android Studio
You can now run the Android Emulator directly in Android Studio. Use this feature to conserve screen real estate, to navigate quickly between the emulator and the editor window using hotkeys, and to organize your IDE and emulator workflow in a single application window.
To learn more, see the Android Emulator documentation.
Use TensorFlow Lite models
ML Model Binding makes it easy for you to directly import .tflite model
files and use them in your projects. Android Studio generates easy-to-use
classes so you can run your model with less code and better type safety.
Supported models
The current implementation of ML Model Binding supports image classification and style transfer models, provided they are enhanced with metadata. Over time, support will be expanded to other problem domains, like object detection, image segmentation, and text classification.
A wide range of pre-trained models with metadata are provided on TensorFlow Hub. You can also add metadata to a TensorFlow Lite model yourself, as is outlined in Adding metadata to TensorFlow Lite model.
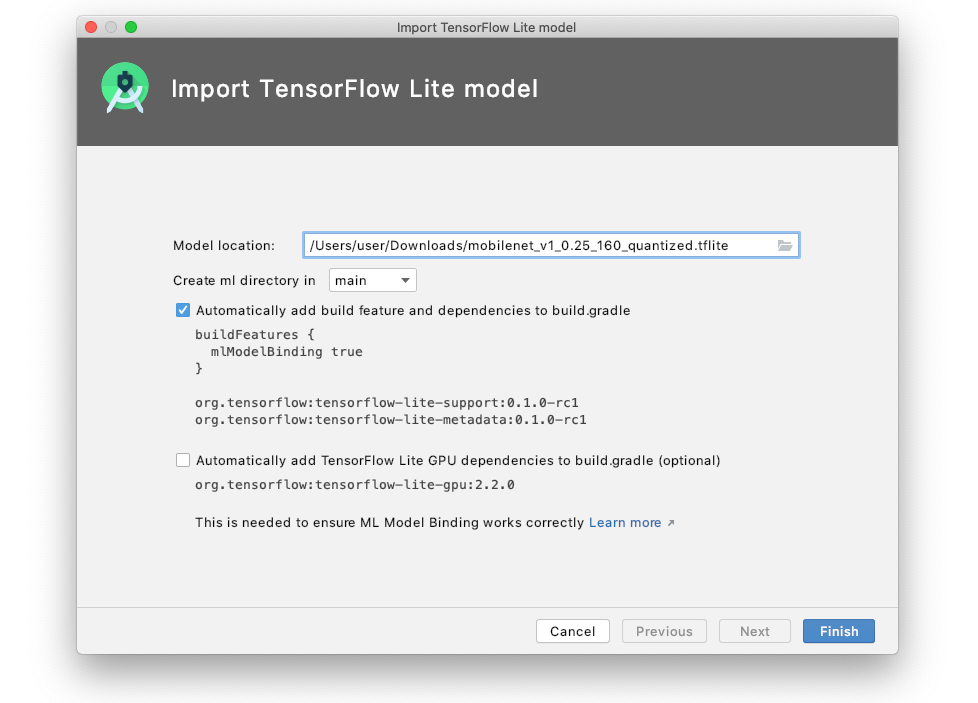
Import a model file
To import a supported model file, follow these steps:
- Open the TensorFlow Lite model import dialog in the File menu at File > New > Other > TensorFlow Lite Model.
- Select the
.tflitemodel file that you previously downloaded or created. - Click Finish.
This imports the model file into your project and places it in the ml/
folder; if the directory doesn't exist, Android Studio creates it for you.
View model metadata and usage
To see the details for an imported model and get instructions on how to use it in your app, double-click the model file in your project to open the model viewer page, which shows the following:
- Model: High-level description of the model
- Tensors: Description of input and output tensors
- Sample code: Example of how to interface with the model in your app
Here is an example using mobilenet_v1_0.25_160_quantized.tflite:
As the example demonstrates, Android Studio creates a class called
MobilenetV1025160Quantized for interacting with the model.
If the model does not have metadata, this screen will only provide minimal information.
Known issues and workarounds
- Support for TensorFlow Lite models for problem domains other than image classification and style transfer is currently limited. Although import should work fine, some model inputs and/or outputs are represented by TensorBuffers rather than friendly types. For models without any metadata, all model inputs and outputs will be TensorBuffers.
- Models with Input and Output data types different from
DataType.UINT8orDataType.FLOAT32are not supported.
This feature is still under development, so please provide feedback or report bugs.
Native Memory Profiler
The Android Studio Memory Profiler now includes a Native Memory Profiler for apps deployed to physical devices running Android 10 or later. With the Native Memory Profiler, you can record memory allocations and deallocations from native code and inspect cumulative statistics about native objects.

To learn more about the Native Memory Profiler, see Inspect your app's memory usage with Memory Profiler.
Known issues and workarounds
The Native Memory Profiler in Android Studio 4.1 does not work for Android 11 devices. Support for profiling Android 11 devices is currently available in the 4.2 preview release".
As of the initial 4.1 release, app startup profiling has been disabled. This option will be enabled in an upcoming release.
As a workaround, you can use the Perfetto standalone command-line profiler to capture startup profiles.
System Trace UI: Easier selection, new analysis tab, and more frame rendering data
The System Trace UI in the Android Studio profiler includes the following improvements:
-
Box selection: In the Threads section, you can now drag your mouse to perform a box selection of a rectangular area, which you can zoom into by clicking the Zoom to Selection
 button on the top right (or use the M keyboard shortcut). When you drag
and drop similar threads next to each other, you can select across multiple
threads to inspect all of them at once. For example, you may want to
perform analysis on multiple worker threads.
button on the top right (or use the M keyboard shortcut). When you drag
and drop similar threads next to each other, you can select across multiple
threads to inspect all of them at once. For example, you may want to
perform analysis on multiple worker threads.
-
Summary tab: The new Summary tab in the Analysis panel displays:
-
Aggregate statistics for all occurrences of a specific event, such as an occurrence count and min/max duration.
-
Trace event statistics for the selected occurrence.
-
Data about thread state distribution.
-
Longest-running occurrences of the selected trace event.
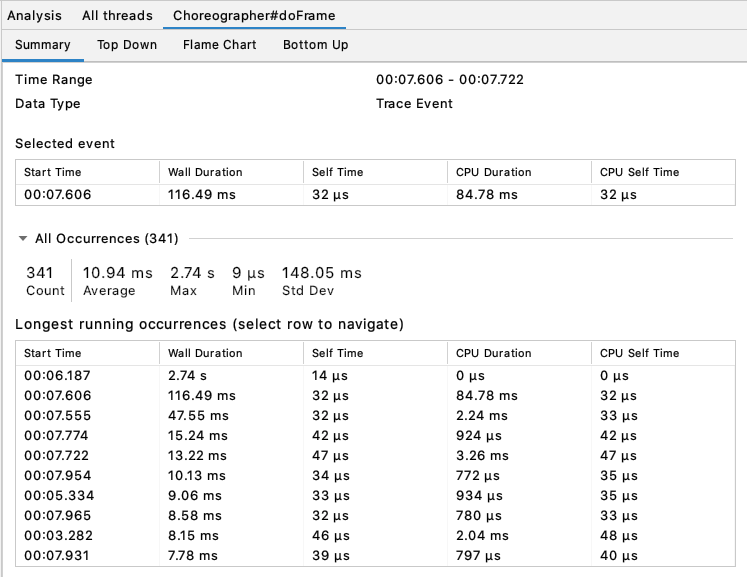
To navigate to another occurrence, select another row from the table.
-
-
Display data: In the Display section, new timelines for SurfaceFlinger and VSYNC help you investigate rendering issues in your app's UI.
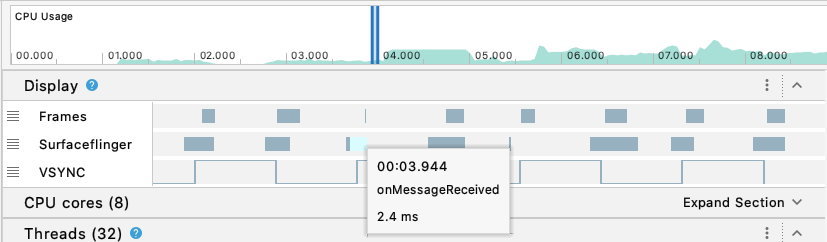
For basic usage instructions on how to record a system trace, see the Record traces section of Inspect CPU activity with CPU Profiler.
Standalone profilers now available
With the new standalone profilers, it's now possible to profile your app without running the full Android Studio IDE.
For instructions on using the standalone profilers, see Run standalone profilers.
Dagger navigation support
Android Studio makes it easier to navigate between your Dagger-related code by providing new gutter actions and extending support in the Find Usages window.
-
New gutter actions: For projects that use Dagger, the IDE provides gutter actions that help you navigate between your Dagger-annotated code. For example, clicking on the
 gutter action next to a method that consumes a given type navigates you to
the provider of that type. Conversely, clicking on the
gutter action next to a method that consumes a given type navigates you to
the provider of that type. Conversely, clicking on the  gutter action navigates you to where a type is used as a dependency.
 -
Find Usages node: When you invoke Find Usages on a provider of a given type, the Find window now includes a Dependency consumer(s node that lists consumers of that type. Conversely, invoking this action on a consumer of a Dagger-injected dependency, the Find window shows you the provider of that dependency.
Material Design Components: Updated themes and styles in new project templates
Android Studio templates in the Create New Project dialog now use Material Design Components (MDC) and conform to updated guidance for themes and styles by default. Updates include:
-
MDC: Projects depend on
com.google.android.material:materialinbuild.gradle. Base app themes useTheme.MaterialComponents.*parents and override updated MDC color and “on” attributes. -
Color resources: Color resources in
colors.xmluse literal names (for example,purple_500instead ofcolorPrimary). -
Theme resources: Theme resources are in
themes.xml(instead ofstyles.xml) and useTheme.<var>names.<var> -
Dark theme: Base application themes use
DayNightparents and are split betweenres/valuesandres/values-night. -
Theme attributes: Color resources are referenced as theme attributes (for example,
?attr/colorPrimary) in layouts and styles to avoid hard-coded colors.
IntelliJ IDEA 2020.1
The core Android Studio IDE has been updated with improvements from IntelliJ IDEA through the 2020.1 release, including a new Commit window that enables version control operations and a new Zen mode that can be toggled by selecting View > Appearance > Enter Distraction Free Mode.
To learn more about the improvements in version 2020.1, see IDEA 2020.1.
IDE configuration directory changes
The locations of user configuration directories have been changed to the following:
Windows
Syntax: %APPDATA%\Google<product><version>
Example: C:\Users\YourUserName\AppData\Roaming\Google\AndroidStudio4.1
macOS
Syntax: ~/Library/Application Support/Google/<product><version>
Example: ~/Library/Application Support/Google/AndroidStudio4.1
Linux
Syntax: ~/.config/Google/<product><version>
Example: ~/.config/Google/AndroidStudio4.1
These new directory locations are consistent with recent updates to IntelliJ IDEA, the IDE on which Android Studio is based.
If Studio doesn't restart after an upgrade, you may need to delete the configuration directory from a previous Studio version. See the known issues page for more information.
Kotlin 1.3.72
Android Studio 4.1 bundles Kotlin 1.3.72, which includes a number of fixes to improve Kotlin highlighting, inspections, and code completion. Check out the 1.3.72 Kotlin changelog for details.
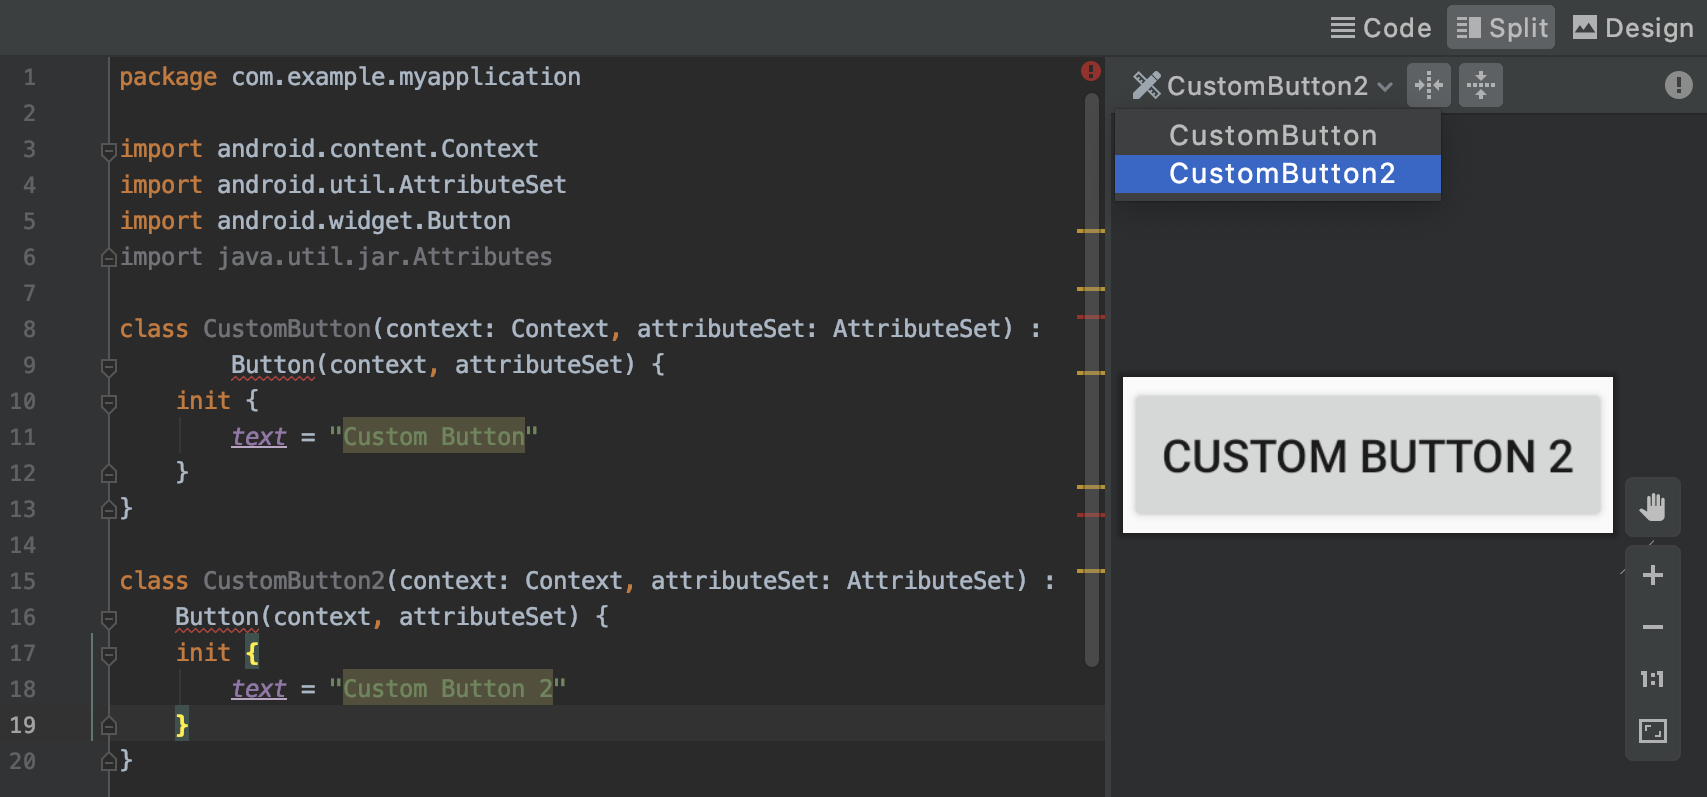
Custom view preview
When creating a custom view (for example, by extending the
View or
Button class),
Android Studio now shows you a preview of your custom view. Use the dropdown
menu in the toolbar to switch between multiple custom views, or click the
buttons to wrap vertically or horizontally to the content.
Note: If you don’t see your changes in the preview, select Build > Make Project from the menu bar.
Symbolication for native crash reports
When a crash or ANR occurs in native code, the system produces a stack trace, which is a snapshot of the sequence of nested functions called in your program up to the moment it crashed. These snapshots can help you to identify and fix any problems in the source, but they must first be symbolicated to translate the machine addresses back into human-readable function names.
If your app or game is developed using native code, like C++, you can now upload debug symbols files to the Play Console for each version of your app. The Play Console uses these debug symbols files to symbolicate your app's stack traces, making it easier to analyze crashes and ANRs. To learn how to upload debug symbols files, see Native crash support.
Apply Changes
To help you be more productive as you iterate on your app, we've made the following enhancements to Apply Changes for devices running Android 11 Developer Preview 3 or higher:
Faster deploy speeds
We've invested heavily in optimizing your iteration speed by developing a method
to deploy and persist changes on a device without installing the application.
After an initial deploy, subsequent deploys to Android 11 devices
using either Apply Code Changes
 or Apply Changes and Restart Activity
 are now significantly faster.
To learn more about the difference between these two actions, see Apply Changes.
Support for additional code changes
For devices running Android 11 Developer Preview 3 or higher, you
can now add methods and then deploy those changes to your running app by
clicking either Apply Code Changes
or Apply Changes and Restart Activity
.