An app is considered to have poor performance if it responds slowly, shows choppy animations, freezes, or consumes too much power. Fixing performance problems involves identifying areas in which your app makes inefficient use of resources such as the CPU, memory, graphics, network, or the device battery.
To find and fix these problems, use the profiling and benchmarking tools and techniques described in this topic. To learn techniques for measuring performance and examples of how to use these techniques to resolve specific problems, see Measuring performance.
Android Studio offers several profiling tools to help find and visualize potential problems:
- CPU profiler helps track down runtime performance issues.
- Memory profiler helps track memory allocations.
- Energy profiler tracks energy usage, which can contribute to battery drain.
These tools are compatible with Android 5.0 (API level 21) and higher. For more information about the tools, see the other pages in this section of the user guide.
The Jetpack Benchmark libraries allow your application to measure various important operations:
- Macrobenchmark: Measure important performance use cases, including application startup and redrawing that is triggered by actions such as UI animations or scrolling.
- Microbenchmark: Measure CPU cost of specific functions.
To learn more about these libraries, see the Benchmark your app page.
Profileable applications
Profileable is a manifest
configuration introduced in Android Q. It can specify whether the user
of the device can profile this application through tools such as Android Studio, Simpleperf, and
Perfetto.
Prior to profileable, most developers could only profile
debuggable apps on Android, which added significant performance costs
as a side effect. These performance costs could invalidate profiling results, especially if they
were related to timing. Table 1 summarizes the differences between debuggable and profileable
apps.
| Feature | Debuggable | Profileable |
|---|---|---|
| Memory Profiler | Full |
Yes: No:
|
| CPU Profiler | Full |
Yes:
No:
|
| Network Profiler | Yes | No |
| Energy Profiler | Yes | No |
| Power Profiler | Yes | Yes |
| Event Monitor | Yes | No |
Profileable has been introduced so that developers can choose to allow their apps to expose
information to profiling tools, while incurring very little performance costs. A profileable APK
is essentially a release APK with a line of <profileable android:shell="true"/>
added within the <application> section of the manifest file.
Build and run a profileable app automatically
You can configure, build, and run a profileable app with one click. This feature requires a
virtual or physical test device that runs API level 29 or higher and has Google Play. To use the
feature, click the arrow next to the Profile app icon
![]() and choose between two options:
and choose between two options:
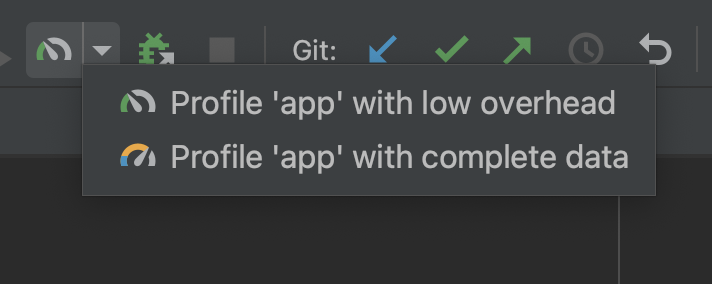
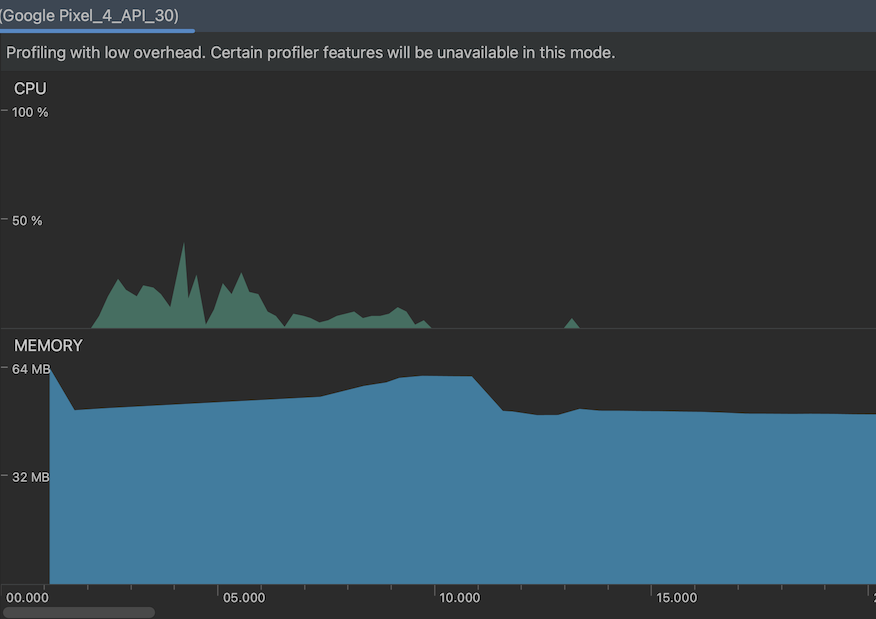
Profile 'app' with low overhead starts the CPU and Memory profilers. In the Memory profiler, only Record Native Allocations is enabled.
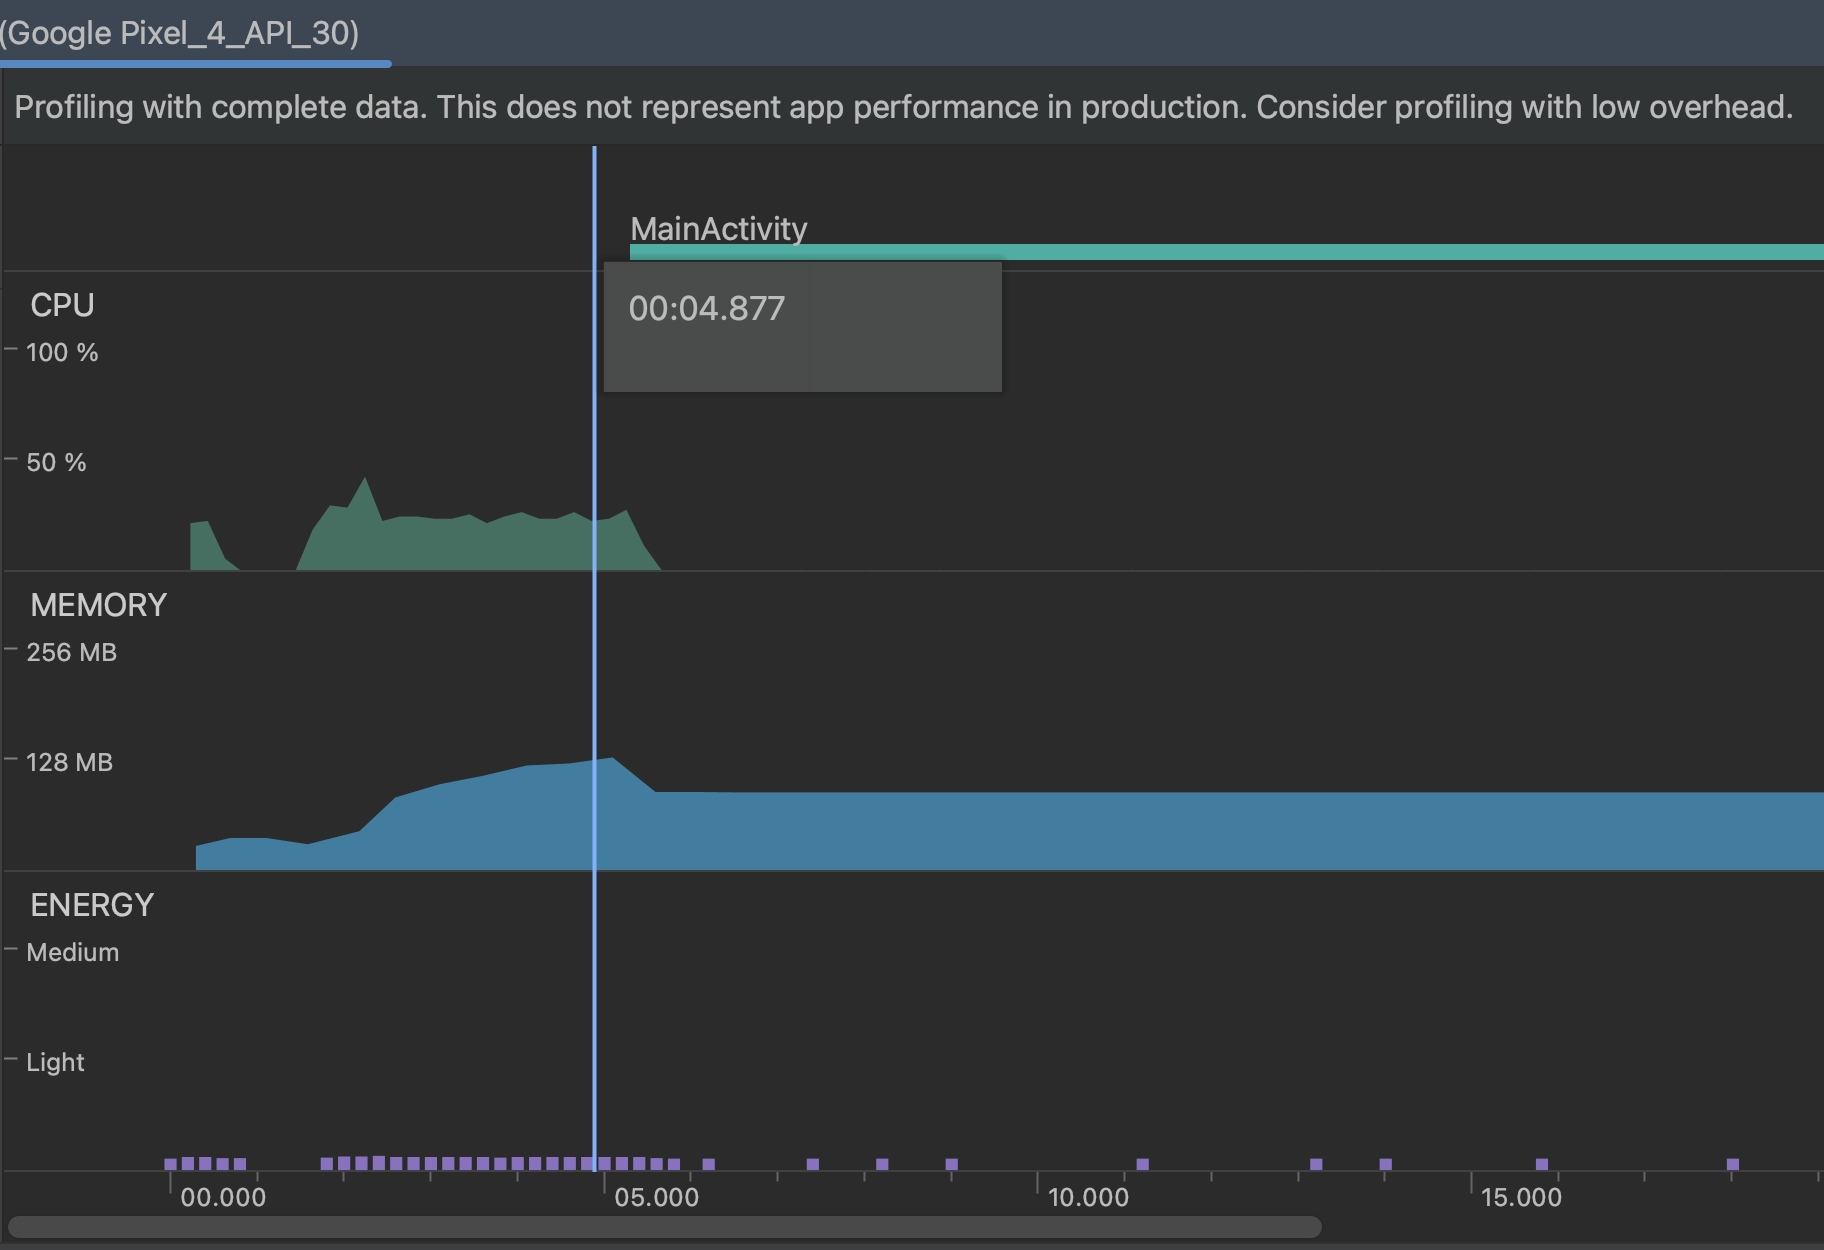
Profile 'app' with complete data starts the CPU, Memory, and Energy profilers.
Build and run a profileable app manually
To build a profileable application manually, you need to first build a release application and then update its manifest file, which turns the release application into a profileable application. After you configure the profileable application, launch the profiler and select a profileable process to analyze.
Build a release app
To build a release application for profiling purposes, do the following:
-
Sign your application with the debug key by adding the following lines to your application's
build.gradlefile. If you already have a working release build variant, you can skip to the next step.buildTypes { release { signingConfig signingConfigs.debug } } -
In Android Studio, select Build > Select Build Variant... and choose the release variant.
Change release to profileable
-
Convert your release application from above into a profileable application by opening the
AndroidManifest.xmlfile and adding the following within<application>. For more details, see Building your application for release.<profileable android:shell="true"/> -
Depending on the SDK version, you may need to add the following lines to the application's
build.gradlefile.aaptOptions { additionalParameters =["--warn-manifest-validation"] }
Profile a profileable app
To profile a profileable app, do the following:
-
From the development emulator or device, start the app.
-
In Android Studio, launch the profiler by selecting View > Tool Windows > Profiler.
-
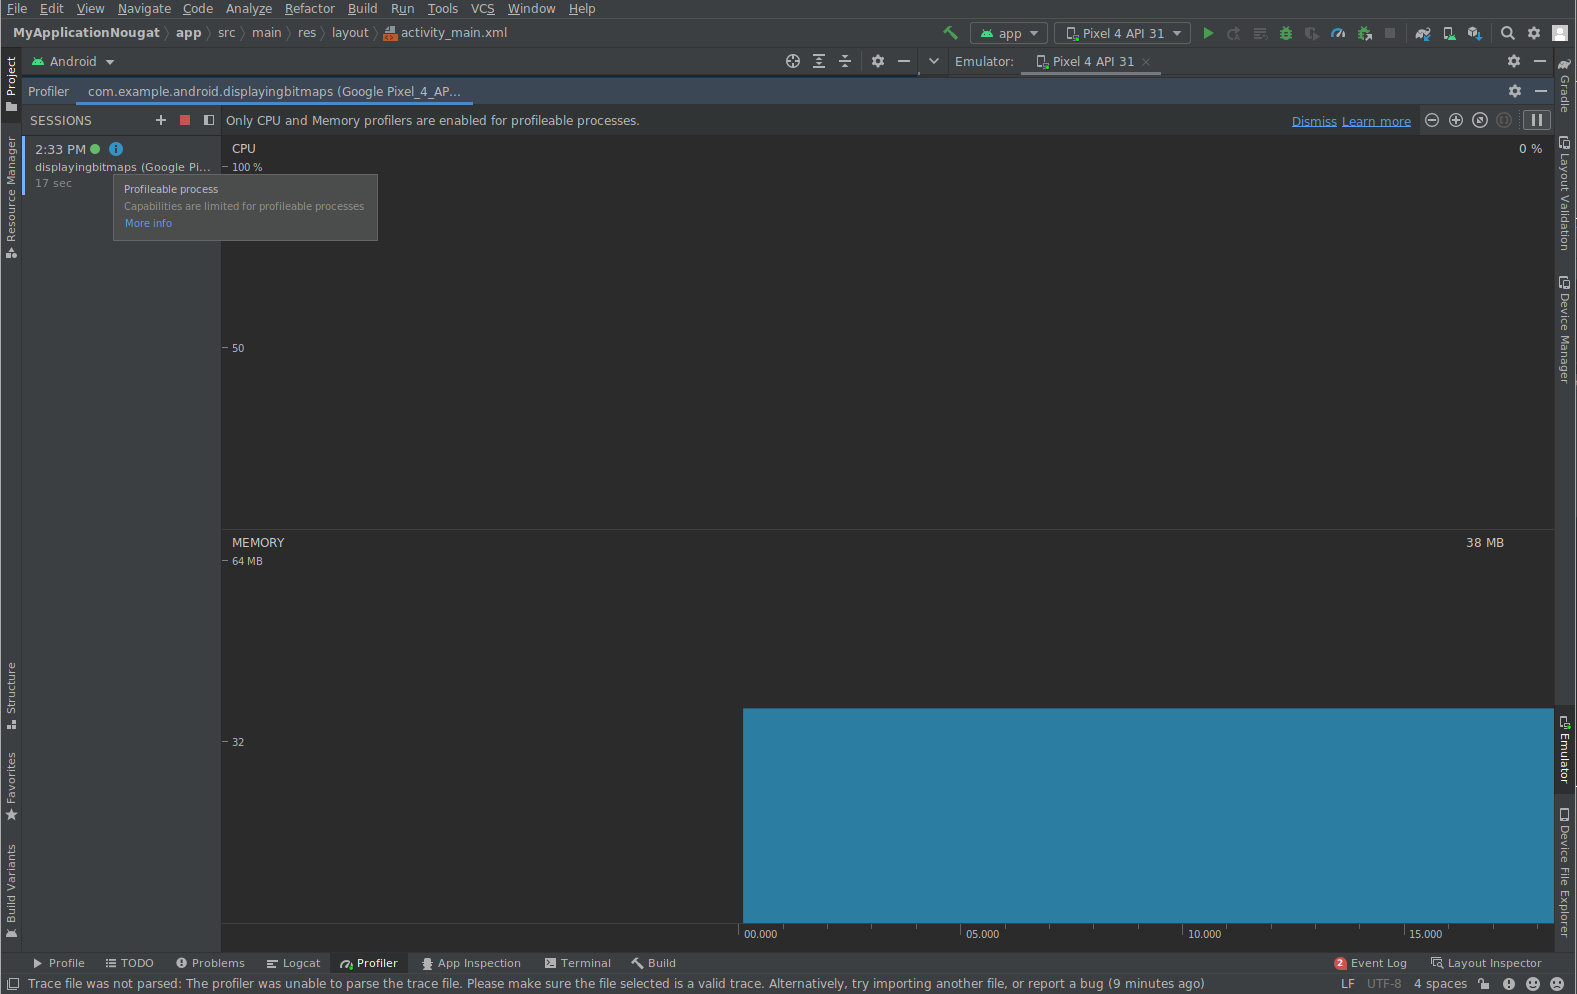
After the application has launched, click the
 button in the profiler to see the dropdown menu. Select your device, then select the
application's entry under Other profileable processes.
-
The profiler should attach to the application. Only the CPU and Memory Profilers are available, with limited capabilites for the Memory Profiler.
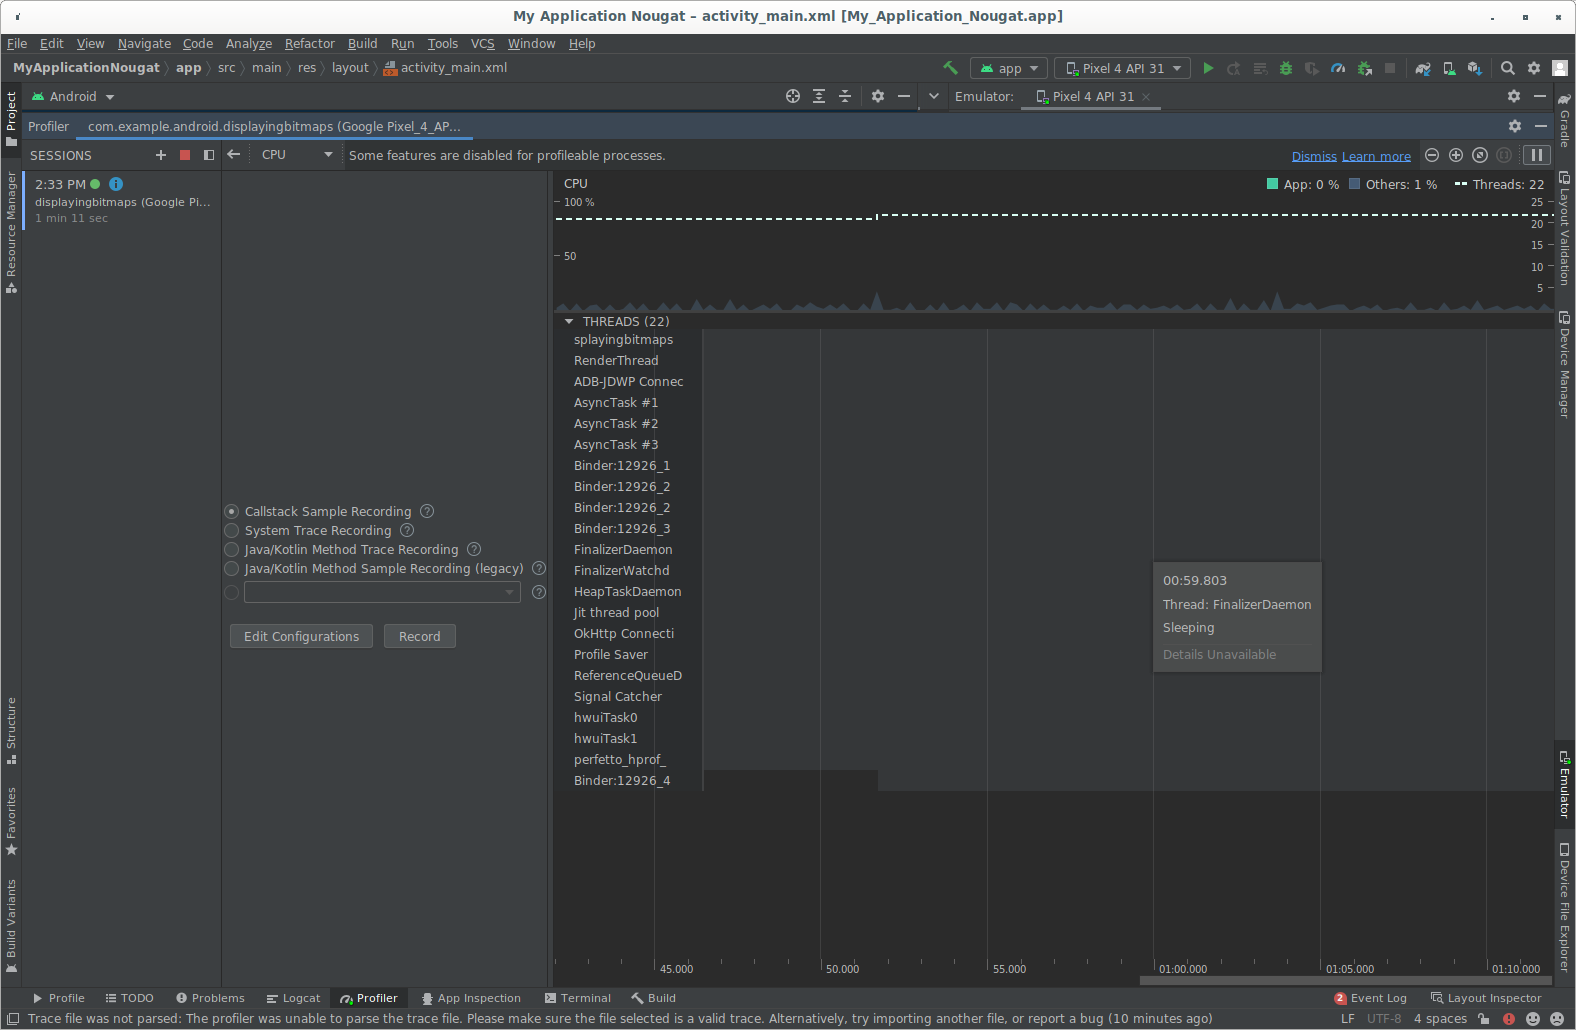
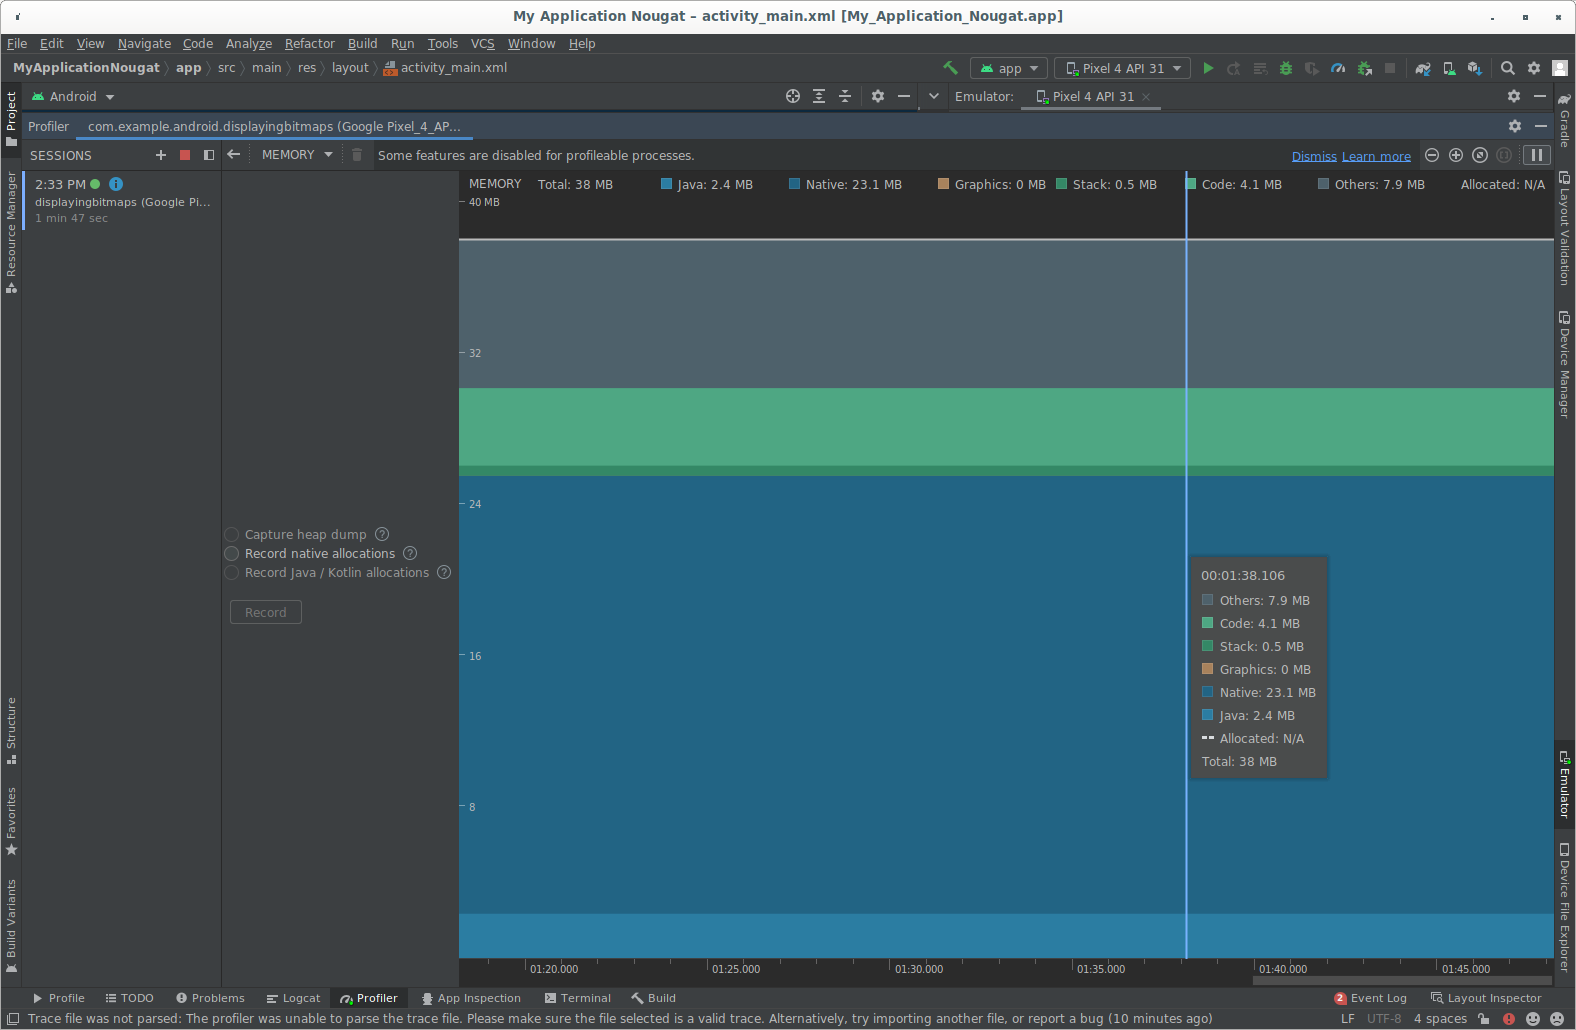
Sessions
You can save Profiler data as sessions, which are retained until you quit Android Studio. By recording profiling information in multiple sessions and switching between them, you can compare resource usage in various scenarios.
- To start a new session, click the Start a new profiling session
 button
and select an app process from the dropdown menu that appears.
 - When you record a trace or capture a heap dump, Android Studio adds that data (along with your app's network activity) as a separate entry to the current session.
- To stop adding data to the current session, click Stop the current
profiling session
 .
. - To import a trace exported from a previous run of Android Studio, click
Start new profiler session
 and choose Load from file.
Enable additional support for older devices (API level < 26)
To show you additional profiling data when running a device with Android 7.1 or lower, Android Studio must inject monitoring logic into your compiled app. These additional profiling data include the following:
- The event timeline on all profiler windows
- The number of allocated objects in Memory Profiler
- Garbage collection events in Memory Profiler
- Details about all transmitted files in Network Profiler
To enable additional support for older devices, follow these steps:
- Select Run > Edit Configurations.
- Select your app module in the left pane.
- Click the Profiling tab, and then check Enable additional support for older devices (API level < 26).
- Build and run your app again.
Enabling additional support for older devices makes the build process slower, so you should enable it only when you want to start profiling your app.
Run standalone profilers
The standalone Android Studio Profilers let you profile your app without running the full Android Studio IDE.
To run the standalone profilers, do the following:
- Make sure the profiler is not currently running inside of Android Studio.
Go to the installation directory and navigate to the
bindirectory:Windows/Linux:
studio-installation-folder/binmacOS: The use of standalone profilers is not supported on macOS.
- Depending on your OS, run
profiler.exeorprofiler.sh. The Android Studio splash screen appears. After the splash screen disappears, a profiler window opens.
