
Android includes some on-device developer options that help you visualize where your app might be running into issues rendering its UI, such as performing more rendering work than necessary, or executing long thread and GPU operations. This page describes how to debug GPU overdraw and profile GPU rendering.
To learn more about on-device developer options, including how to enable them, read Configure on-device developer options.
Profile GPU rendering speed
The Profile GPU Rendering tool displays, as a scrolling histogram, a visual representation of how much time it takes to render the frames of a UI window relative to a benchmark of 16.67ms per frame.
On less powerful GPUs, available fill-rate (the speed at which the GPU can fill the frame buffer) can be quite low. As the number of pixels required to draw a frame increases, the GPU might take longer to process new commands, causing the rest of the system to wait until the GPU can catch up.
The profiling tool helps you identify when the GPU gets overwhelmed trying to draw pixels or is burdened by heavy overdraw.
Enable the profiler
Before you begin, make sure you're using a device running Android 4.1 (API level 16) or higher, and you enable developer options. To start profiling device GPU rendering while using your app, proceed as follows:
- On your device, go to Settings and tap Developer Options.
- In the Monitoring section, select Profile GPU Rendering or Profile HWUI rendering, depending on the version of Android running on the device.
- In the Profile GPU Rendering dialog, choose On screen as bars to overlay the graphs on the screen of your device.
- Open the app that you want to profile.
Inspect the output
In the enlarged image of the Profile GPU Rendering graph shown in figure 1, you can see the colored section, as displayed on Android 6.0 (API level 23).
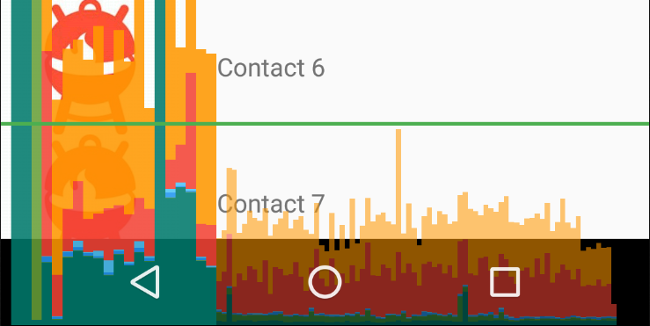
Figure 1. Enlarged Profile GPU Rendering graph.
The following are a few things to note about the output:
- For each visible application, the tool displays a graph.
- Each vertical bar along the horizontal axis represents a frame, and the height of each vertical bar represents the amount of time the frame took to render (in milliseconds).
- The horizontal green line represents 16.67 milliseconds. To achieve 60 frames per second, the vertical bar for each frame needs to stay below this line. Any time a bar surpasses this line, there may be pauses in the animations.
- The tool highlights frames that exceed the 16.67 millisecond threshold by making the corresponding bar wider and less transparent.
- Each bar has colored components that map to a stage in the rendering pipeline. The number of components varies depending on the API level of the device.
The following table provides descriptions of each segment of a vertical bar in the profiler output when using a device running Android 6.0 and higher.
| Component of Bar | Rendering Stage | Description |
|---|---|---|
| Swap Buffers | Represents the time the CPU is waiting for the GPU to finish its work. If this bar gets tall, it means the app is doing too much work on the GPU. | |
| Command Issue | Represents the time spent by Android's 2D renderer issuing commands to OpenGL to draw and redraw display lists. The height of this bar is directly proportional to the sum of the time it takes each display list to execute—more display lists equals a taller red bar. | |
| Sync & Upload | Represents the time it takes to upload bitmap information to the GPU. A large segment indicates that the app is taking considerable time loading large amounts of graphics. | |
| Draw |
Represents the time used to record drawing commands, such as drawLine. In Compose, this phase can sometimes include measure and layout operations. If this bar is tall, capture a system trace and inspect it using Perfetto for a detailed breakdown.
|
|
| Measure / Layout | Represents the amount of time spent on positioning and determining the size of UI components during the layout phase, which includes executing measurement and placement modifiers. A large segment indicates complex calculations within these modifiers or an excessively deep layout tree requiring frequent recalculation. | |
| Input Handling & Animation |
Represents the amount of time it took to evaluate animation API calls or to handle pointer input and its callbacks. If this segment
is large, it could indicate that a customized animation or input callback is
spending too much time processing. State calculation and data mapping while scrolling through a LazyColumn or LazyRow
also typically occur during this segment and are a more common source of
slowdowns in this segment.
|
|
| Misc Time / VSync Delay | Represents the time that the app spends executing operations in between two consecutive frames. It might be an indicator of too much processing happening in the UI thread that could be offloaded to a different thread. |
Table 1. Component bars in Android 6.0 and higher.
For more information about how to interpret information provided by the profiling tool, read Analyzing with Profile GPU Rendering.