
The following are new features in Android Studio Dolphin.
New in Compose
The following are new features and improvements to Jetpack Compose in Android Studio.
Compose Animation Coordination
If your animations are described in a composable preview, you can now use Animation Preview to inspect and coordinate all of them at once. You can also freeze a specific animation.
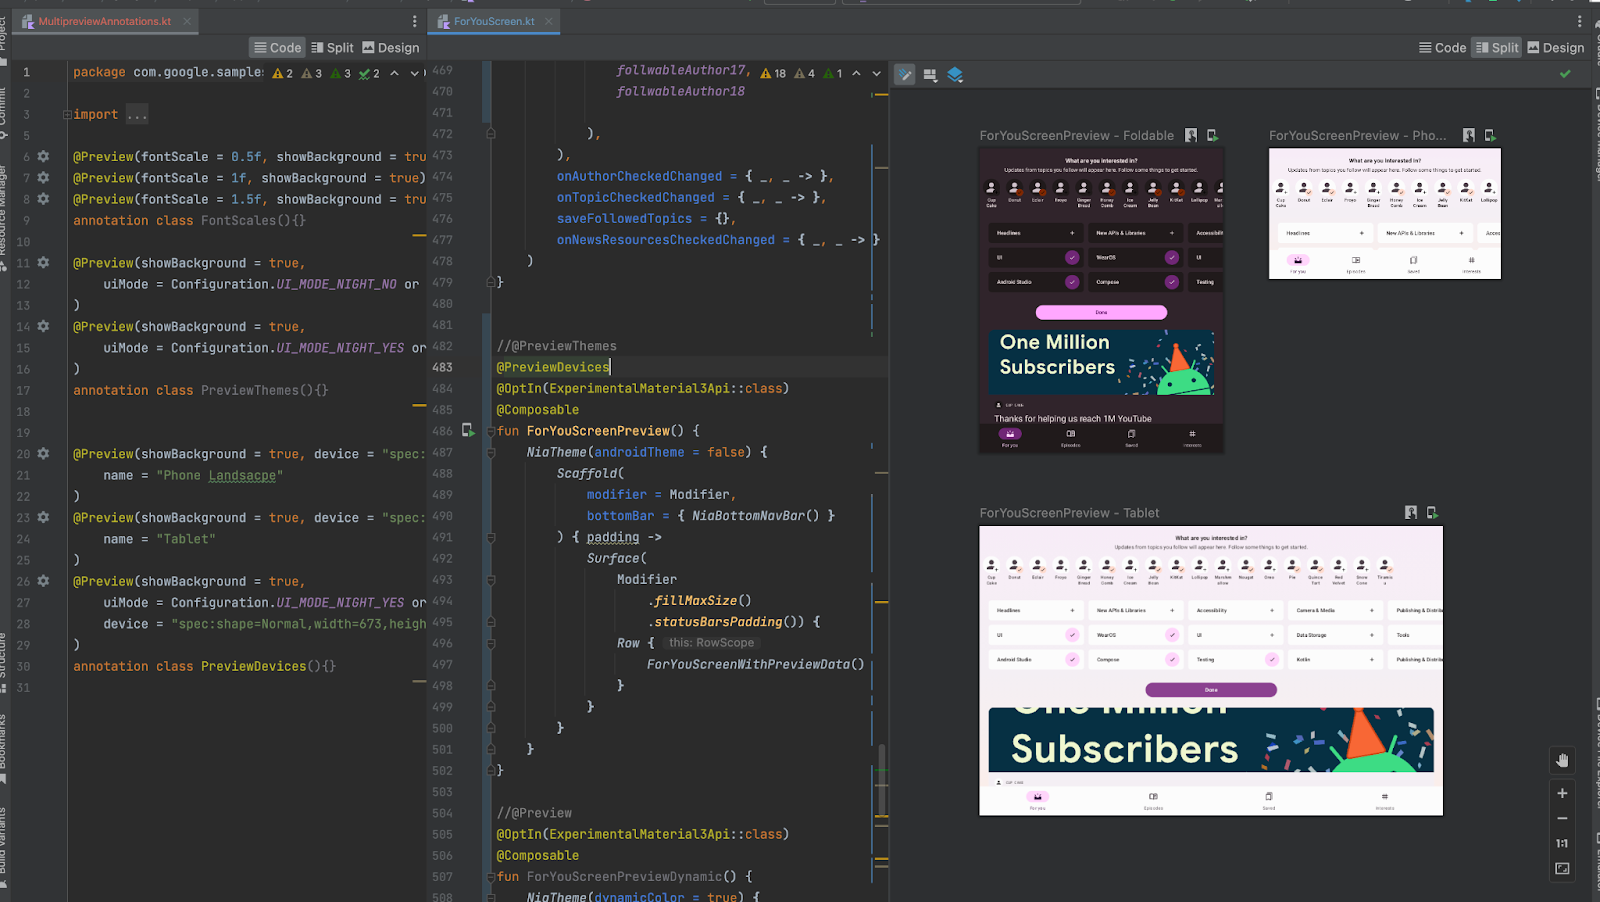
Compose Multipreview Annotations
You can now define an annotation class that includes multiple Preview definitions and use that new annotation to generate those previews at once. Use this new annotation to preview multiple devices, fonts, and themes at the same time—without repeating those definitions for every single composable.
Compose Recomposition Counts in Layout Inspector
When debugging your Compose layouts, knowing when composables do or do not recompose is important in understanding whether your UI is implemented properly. For example, if it's recomposing too many times, your app might be doing more work than is necessary. On the other hand, components that do not recompose when you expect them to can lead to unexpected behaviors.
The Layout Inspector now allows you to see when discrete composables in your
layout hierarchy have either recomposed or skipped. This information is shown
live, while you interact with your app. To get started, make sure your app is
using Compose 1.2.0-alpha03 or higher. Then deploy your app as you normally
would.
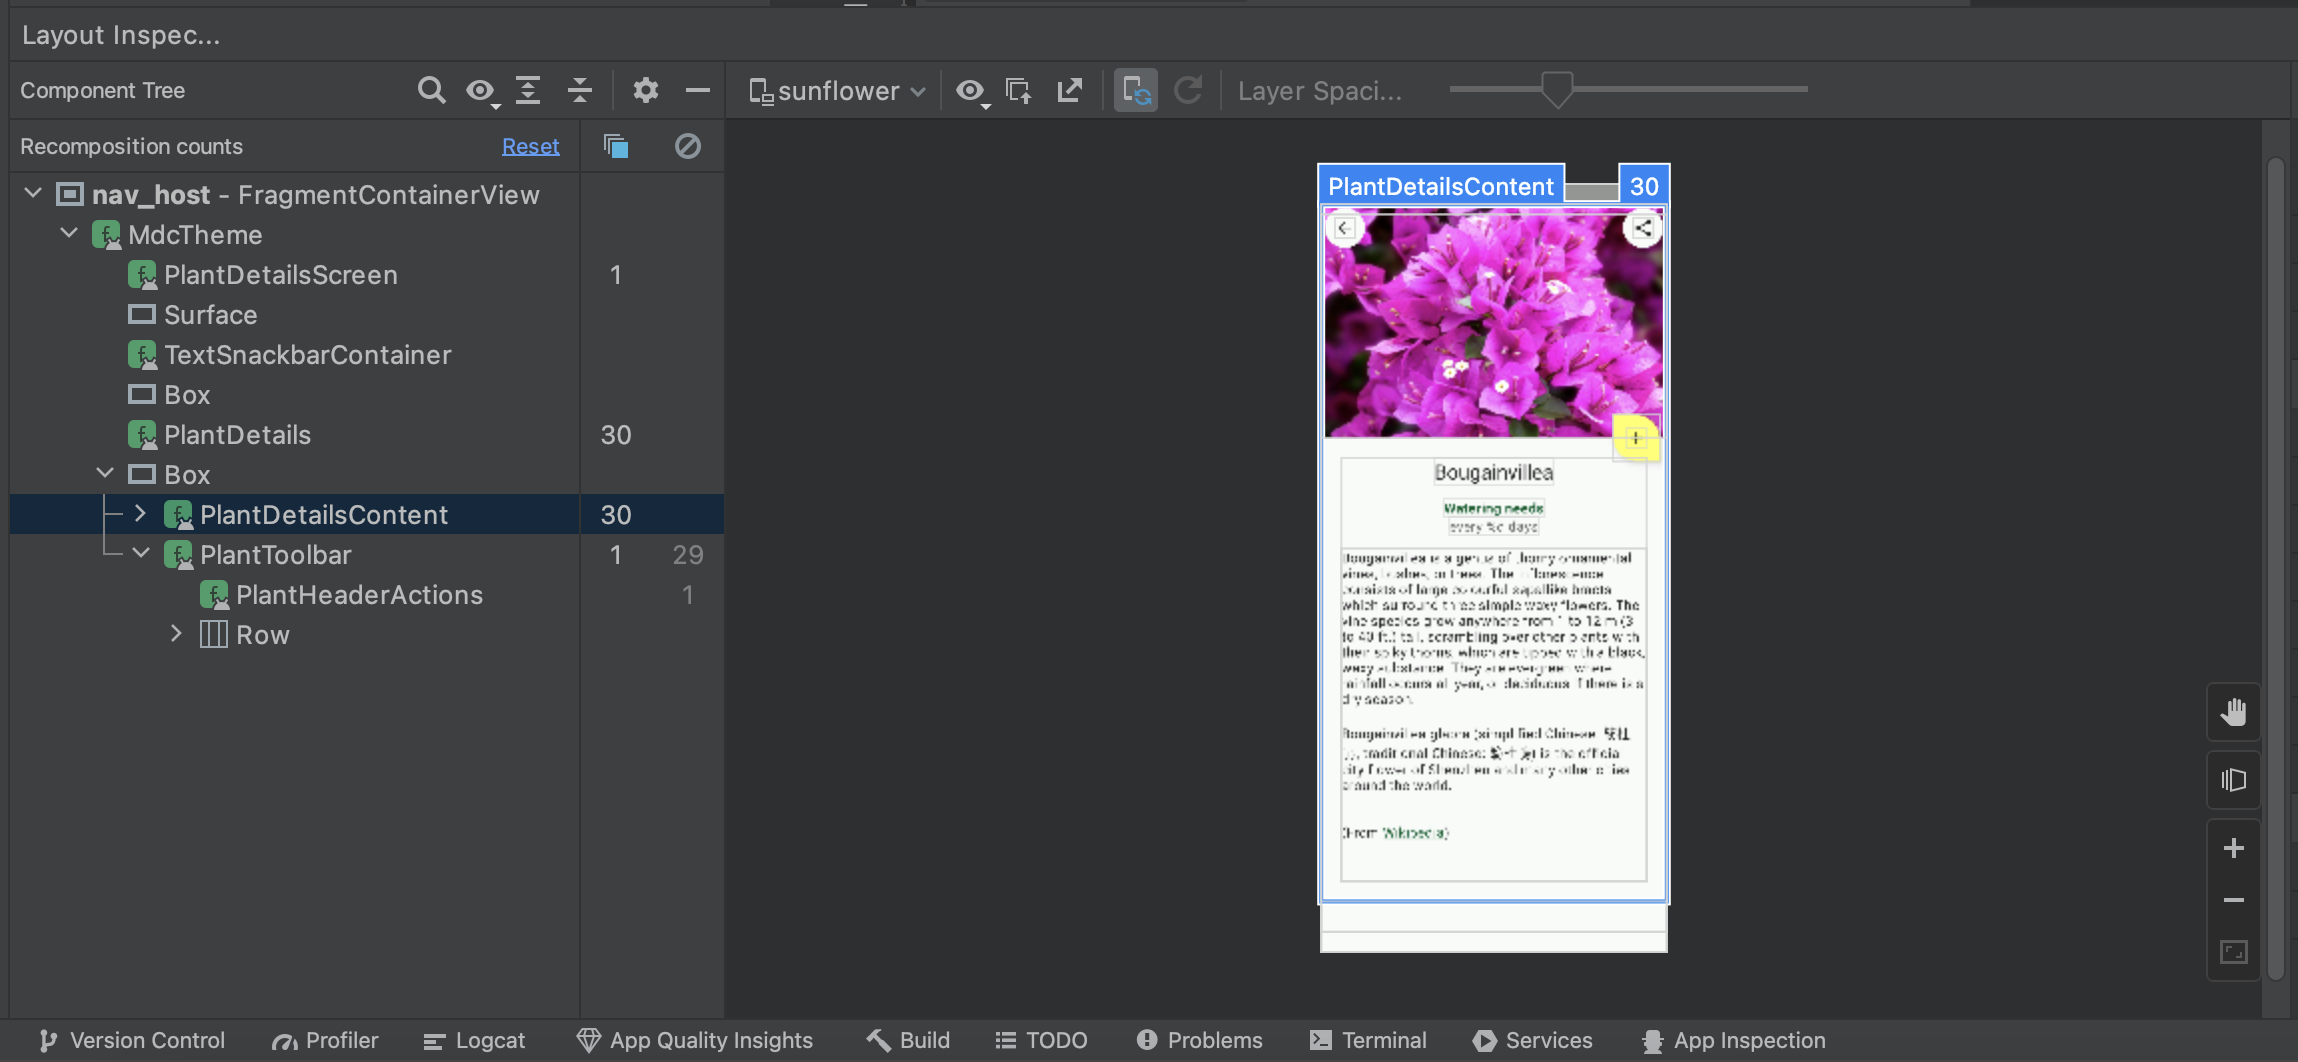
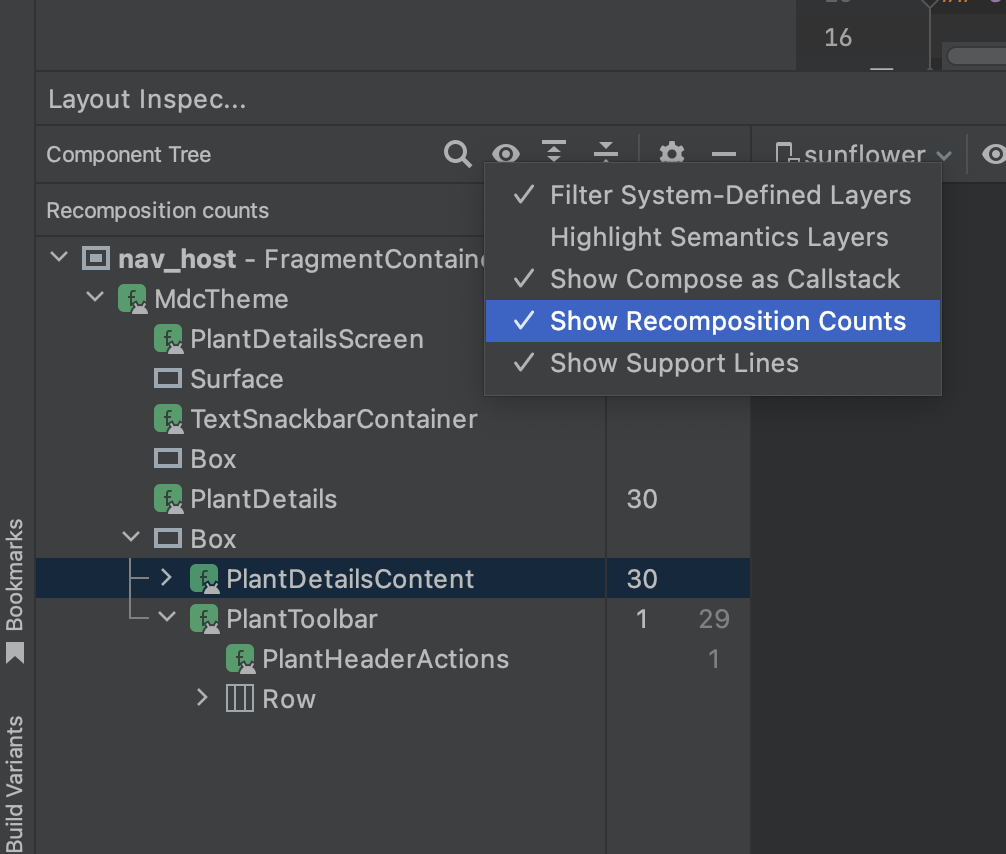
Open the Layout Inspector window and connect to your app process. In the Component Tree, you should see two new columns appear next to the layout hierarchy. The first column show the number of compositions for each node. The second columns displays the number of skips for each node. You can also see similar information in the Attributes pane when you select a composable from the Component Tree or the Layout Display.
If you want to reset the count, click Reset near the top of the Component Tree panel. Resetting the count can help you understand recompositions or skips during a specific interaction with your app.
Updated Wear OS emulator pairing assistant
Starting with Android Studio Dolphin Canary 3, the Wear OS emulator pairing assistant has improved features that make it easier to manage and connect Wear emulators. You can now do the following:
- See Wear devices in the Device Manager.
- Pair multiple Wear devices with a single virtual or physical phone.
- Automatically reconnect previously paired devices when they’re launched. Android Studio now remembers and re-pairs the last pair set up.
To use these new features, make sure your phone emulators are API level 30 or higher and have the Google Play Store installed. Also, make sure your Wear emulators are API level 28 or higher. To upgrade to the latest system images for your emulated devices, go to Tools > SDK Manager.
For more information, see Use the Wear OS emulator pairing assistant.
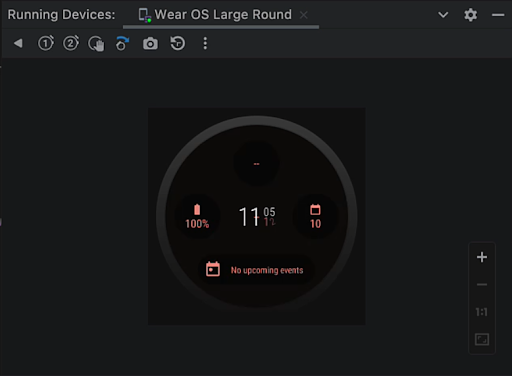
Updated Wear OS emulator toolbar
Starting with Android Studio Dolphin Canary 2, for Wear emulators with API level 28 or higher, the emulator toolbar now has buttons that simulate the physical buttons and common actions on the device. The new buttons are: Button 1 and Button 2 (Button 2 is only available on API level 30 or higher), the Palm button, and the Tilt button. Here are some of the actions you can do using the new buttons on your Wear emulator:
- To set your device to ambient mode, click the Palm button.
- To return your device to the last screen it was on before ambient mode, click the Tilt button.
For more information, see Perform common actions in the emulator.
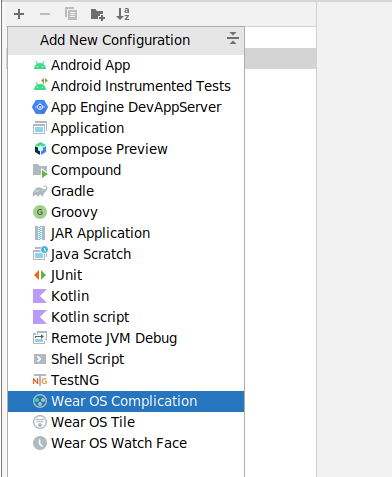
New Wear OS run configurations
New run configurations have been added to quickly run and debug surfaces specific to Wear OS like watch faces, Tiles, and complications. You can create these new configurations from the Run/Debug Configurations dialog when running your application.
For more information, see Wear OS run/debug configurations.
New Logcat
Logcat has been updated to make it easier to parse, query, and track logs.
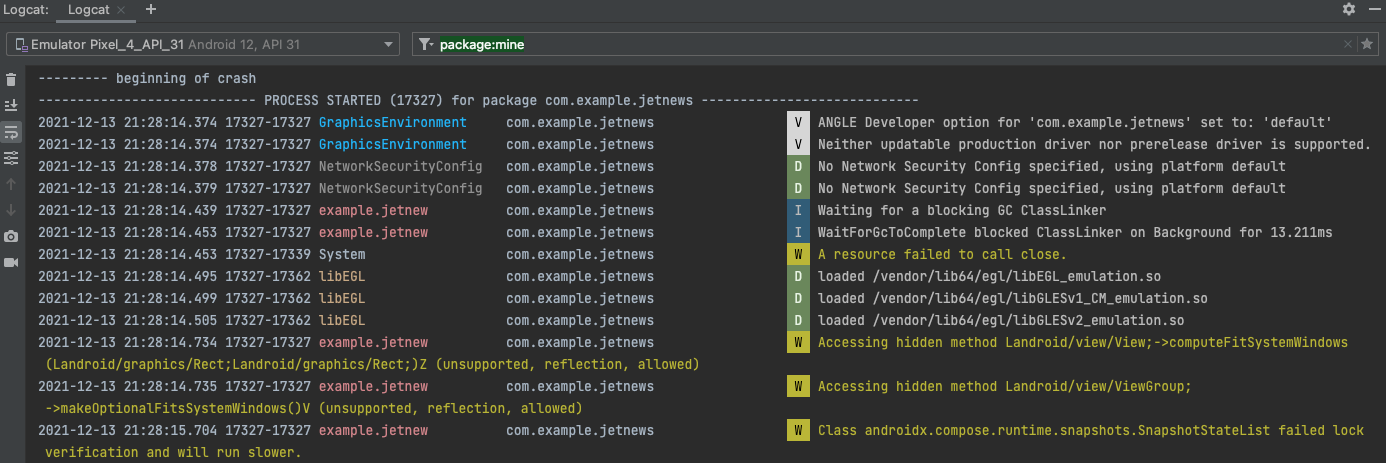
New formatter
Logcat now formats logs to make it easier to scan useful information, such as tags and messages, and identify different types of logs, such as warnings and errors.
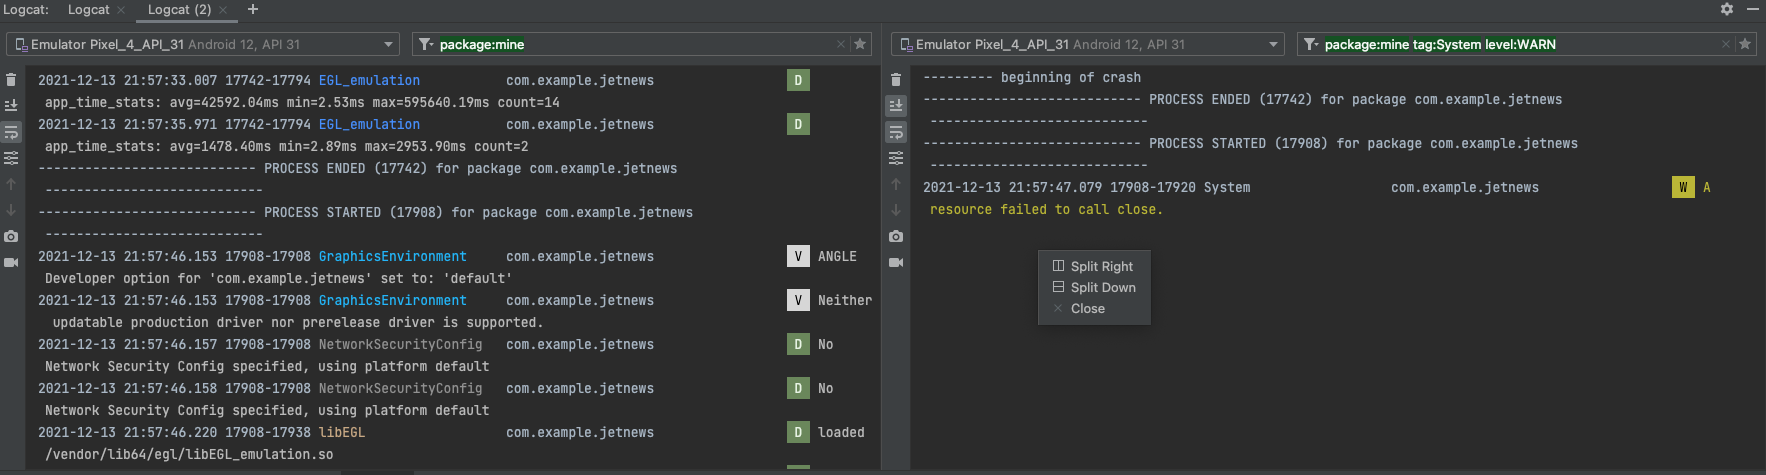
Create multiple Logcat windows
You can now create multiple tabs within Logcat, so that you can easily switch between different devices or queries. Right-clicking a tab allows you to rename it, and you can click and drag to rearrange the tabs.
Additionally, to help you more easily compare between two sets of logs, you can now split the view within a tab by right-clicking in the log view and selecting either Split Right or Split Down. To close a split, right-click and select Close. Each split allows you to set its own device connection, view options, and query.
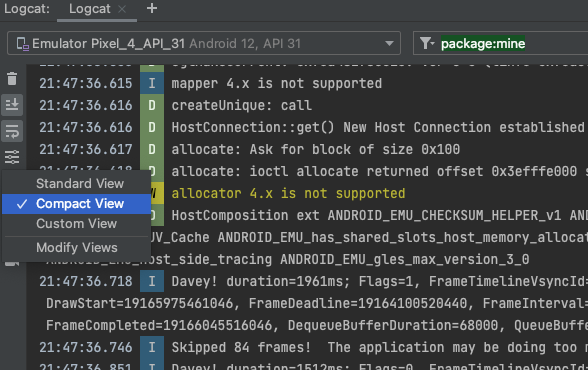
Switch between view presets
Logcat now allows you to quickly switch between different view
modes—Standard, Compact, and Custom—by clicking
 .
Each view mode provides a different
default setting for showing you more or less information, such as timestamps,
tags, and process IDs (PID). You can also customize each of these default view modes, as
well as a custom view mode, by selecting Modify View.
.
Each view mode provides a different
default setting for showing you more or less information, such as timestamps,
tags, and process IDs (PID). You can also customize each of these default view modes, as
well as a custom view mode, by selecting Modify View.
New key-value search
In the previous version of Logcat, you had the option to either use string search (with support for regular expressions) or create a new filter by populating various fields using the Logcat UI. The first option made search more complex and the second option made sharing and setting up queries more difficult. We’ve now simplified the experience by introducing key-value searches right from the main query field.
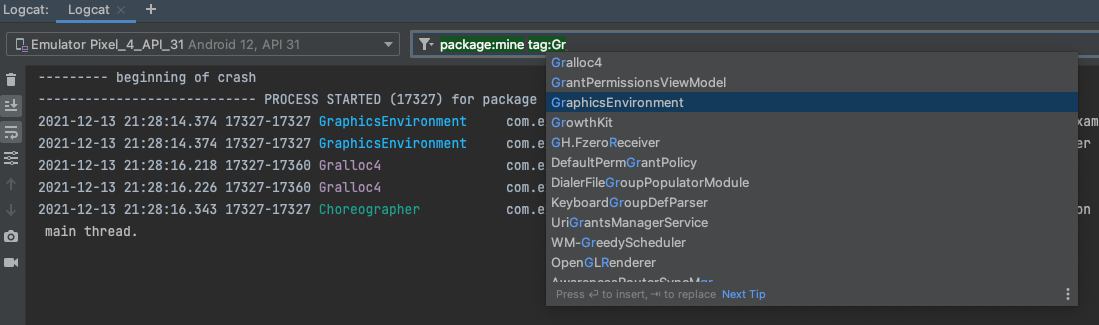
This new query system provides the accuracy of what you want to query, without relying on regular expressions, with the ability to recall past queries from history, and share those queries with others. Additionally, you still have the option to use RegEx and also exclude logs based on key-values. Here are some examples of how to use the new query system, but you can also simply start typing in the query field to see suggestions:
- PIDs for the local app project:
package:mine - Specific values:
package:<package-ID>tag:<tag>level:[VERBOSE | INFO | ASSERT |DEBUG | WARN | ERROR ]
- Exclude a specific value by preceding the key with
-:-tag:<exclude-tag>
- Use regular expressions with a given key by placing a
~after the key:tag~:<regular-expression-tag>- Combine with the exclude tag:
-tag~:<exclude-regular-expression-tag>
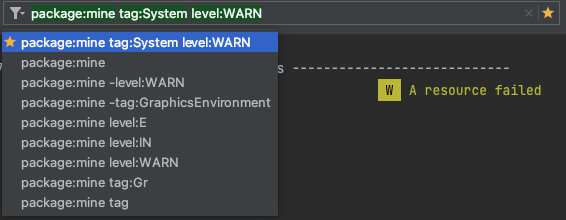
You can also see a history of queries by clicking
 in the query field and selecting them from the drop down. To favorite a query so
that it stays at the top of the list across all your studio projects, click the
in the query field and selecting them from the drop down. To favorite a query so
that it stays at the top of the list across all your studio projects, click the
 at the end of the query field..
Track logs across app crashes/restarts
The new Logcat now makes it easier to track logs from your app across app
crashes and restarts, so that you don’t miss important logs across these events.
When a Logcat notices that your app process has stopped and restarted you’ll see
a message in the output—such as PROCESS ENDED and PROCESS STARTED—as shown
below:
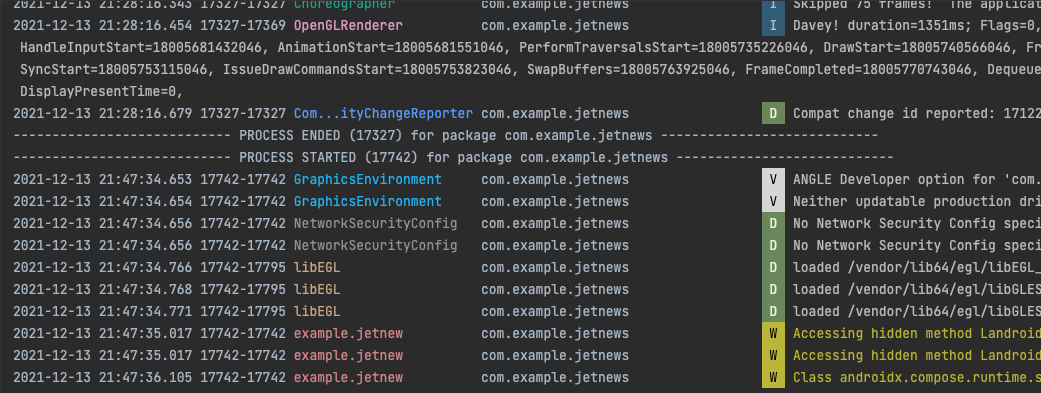
And, restarting Logcat preserves your session configuration, such as tab splits, filters, and view options, so that you can continue your session easily.
Gradle Managed Devices
In order to improve consistency, performance, and reliability when using Android Virtual Devices for your automated instrumented tests, we’re introducing Gradle Managed Devices. This feature, available for API levels 27 and higher, allows you to configure virtual test devices in your project's Gradle files. The build system uses the configurations to fully manage—that is, create, deploy, and tear down—those devices when executing your automated tests.
This feature grants Gradle visibility into not only the tests you’re running, but also the lifecycle of the devices, thus improving the quality of your testing experience in the following ways:
- Handles device-related issues in order to ensure your tests are executed
- Utilizes emulator snapshots to improve device startup time and memory usage, and restore devices to a clean state between tests
- Caches test results and reruns only tests that are likely to provide different results
- Provides a consistent environment for running your tests between local and remote test runs
Additionally, Gradle Managed Devices introduce a new type of Emulator device, called Automated Test Devices (ATD), that are optimized to improve performance when running your instrumentation tests. Combined with support for test sharding, you can experiment with splitting your test suite across multiple ATD instances in order to reduce overall test execution time. To learn more about Gradle Managed Devices and its associated features, see Scale your tests with Gradle Managed Devices.
R8 support using mapping files based on DEX instruction offsets
When optimizing line information, R8 can now encode the information in shared debug information objects with line tables based on instruction offsets. This substantially reduces the overhead of line information. The effect is that lines in methods are no longer consecutive but might jump at intervals depending on the size of the instructions. Note that some tooling does not consider this shared encoding.
In addition, Android VMs starting from O (API Level 26) support printing instruction offsets in stack traces if the method has no line number information. When compiling with minSdk 26 or higher, and with no source file information, R8 strips the line number information completely.
Stateless lambdas are no longer desugared as singletons
Stateless lambdas are no longer allocated as singletons when desugaring. The representation as singletons adds code size overhead due to the added field and class initializer, as well as startup overhead, due to static class initialization. Stateless lambdas are now allocated at use sites the same way stateful lambdas (lambdas with captures) are.
R8 avoids verification slowdown on Android runtimes
To eliminate performance issues on Android runtimes (Dalvik and ART), R8 (not D8) now introduces library stubs and outline calls to library methods for library classes and methods that might not exist at runtime. Doing so eliminates many verification issues and improves runtime performance. This feature is always enabled.
Support for JDK-11 APIs with Java 8+ API desugaring
When using the coreLibraryDesugaring dependency there is now support for an
implementation library based on JDK-11. See thedesugar_jdk_libs
change log
for more information.
Patch releases
The following is a list of the Patch releases in Android Studio Dolphin.
Android Studio Dolphin | 2021.3.1 Patch 1 (October 2022)
With the Patch 1 release, Android Studio Dolphin now supports the Kotlin plugin 1.7.20. This minor update also includes the following bug fixes:
| Fixed Issues | |||||||||||||
|---|---|---|---|---|---|---|---|---|---|---|---|---|---|
| Android Gradle Plugin |
|
||||||||||||
| Dexer (D8) |
|
||||||||||||
| Import/Sync |
|
||||||||||||
| Resources |
|
||||||||||||
| Shrinker (R8) |
|
||||||||||||