
Android Studio provides a debugger that lets you do the following and more:
- Select a device to debug your app on.
- Set breakpoints in your Java, Kotlin, and C/C++ code.
- Examine variables and evaluate expressions at runtime.
This page includes instructions for basic debugger operations. For more documentation, also see the IntelliJ IDEA debugging docs.
Enable debugging
Before you can begin debugging, do the following:
- Enable debugging on your device.
- If you're using the emulator, debugging is enabled by default. But for a connected device, you need to enable debugging in the device developer options.
- Run a debuggable build variant.
Use a build variant that includes
debuggable true(isDebuggable = truein Kotlin scripts) in the build configuration.Usually, you can select the default "debug" variant that's included in every Android Studio project, even though it's not visible in the
build.gradlefile. However, if you define new build types that should be debuggable, you must adddebuggable trueto the build type:- Set breakpoints in your app's code.
- In the toolbar, select a device to debug your app on from the target device menu.
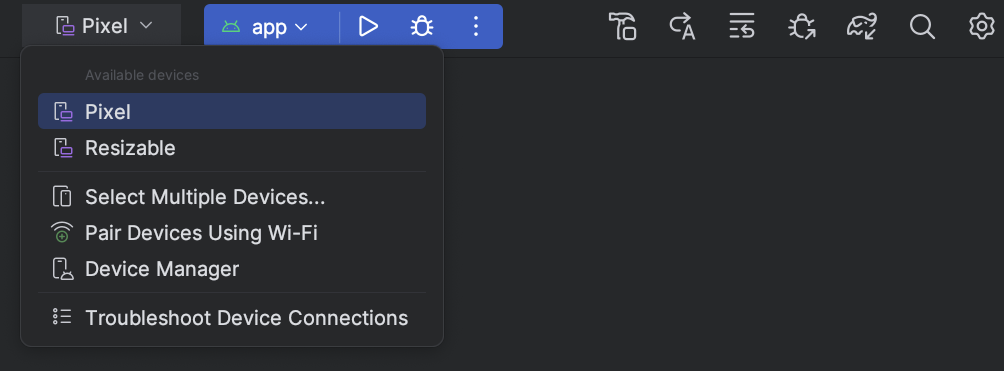
Figure 1. Target device menu. If you don't have any devices configured, then you need to either connect a device via USB, connect a device via Wi-Fi, or create an AVD to use the Android Emulator.
- In the toolbar, click Debug
 .
.
If your app is already running on the device, a dialog is displayed asking if you want to switch from Run to Debug. The device will need to restart in order to begin debugging. To keep the same instance of the app running, click Cancel Debug and instead attach the debugger to a running app. Otherwise, Android Studio builds an APK, signs it with a debug key, installs it on your selected device, and runs it.
If you add C and C++ code to your project, Android Studio also runs the LLDB debugger in the Debug window to debug your native code.
- If the Debug window isn't open, select View > Tool Windows > Debug,
or click Debug in the tool window bar.
- Click Attach debugger to Android process
 .
.
- In the Choose Process dialog, select the process you want to
attach the debugger to.
- If you're using an emulator or a rooted device, you can check Show all processes to see all processes. On a rooted device, this will show all processes running on the device. However, on an un-rooted device, this will only show debuggable processes.
- From the Use Android Debugger Settings from menu, you can select an existing run/debug configuration. For C and C++ code, this lets you reuse the LLDB startup commands, LLDB post-attach commands, and symbol directories in an existing configuration.
- If you don't have an existing run/debug configuration, select Create New. This selection enables the Debug Type menu, where you can select a different debug type. By default, Android Studio uses the Detect Automatically debug type to select the best debugger option for you based on whether your project includes Java or C/C++ code.
- Click OK.
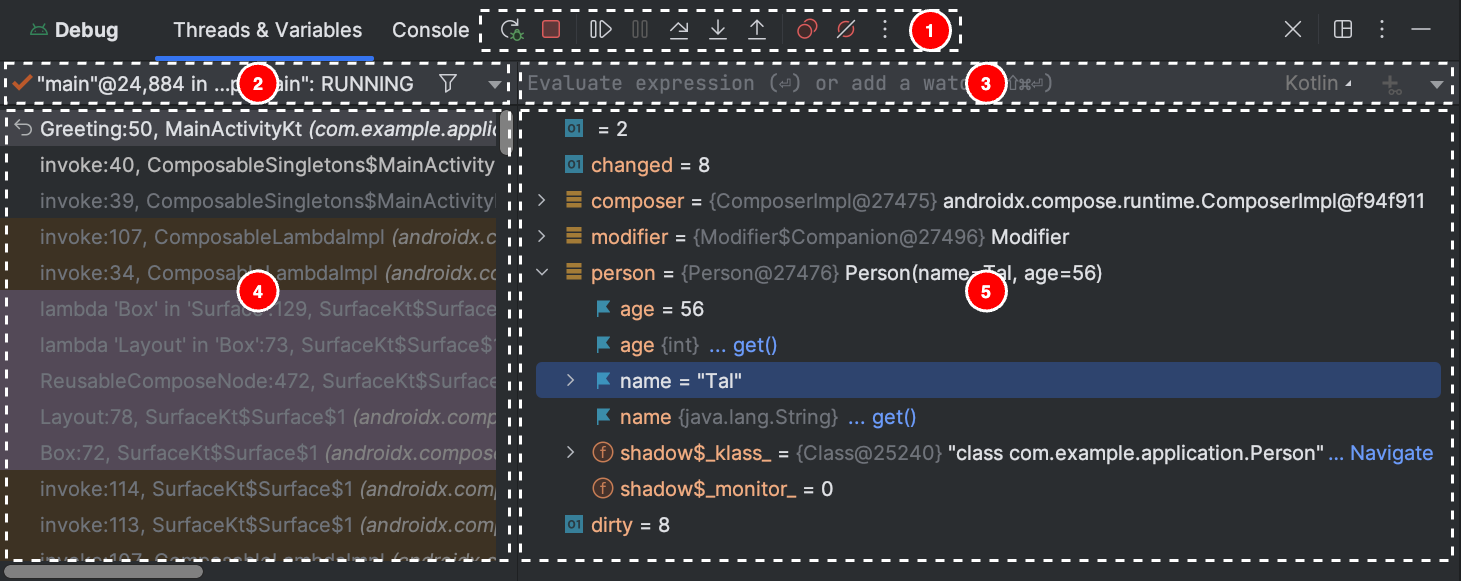
The Debug window appears.
- Execution and navigation toolbar See Work with breakpoints
- Thread selector
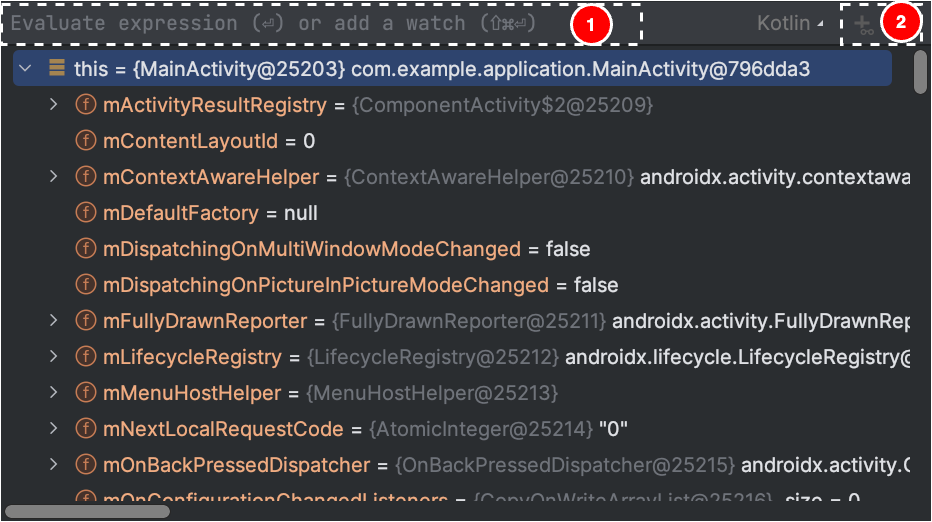
- Evaluation and watch expression entry. See Inspect variables.
- Stack display
- Variables pane. See Inspect variables.
- Detect Automatically
- Select this debug type if you want Android Studio to automatically choose the best option for the code you are debugging. For example, if you have any C or C++ code in your project, Android Studio automatically uses the Dual debug type. Otherwise, Android Studio uses the Java-Only debug type.
- Java Only
- Select this debug type if you want to debug only code written in Java or Kotlin. The Java-Only debugger ignores any breakpoints or watches you set in your native code.
- Native Only (available only with C/C++ code)
-
Select this debug type if you want to use only LLDB to debug your code. When using this
debug type, the Java debugger session view is not available. By default,
LLDB inspects only your native code and ignores breakpoints in your Java
code. If you want to also debug your Java code, switch to either
the Detect Automatically or Dual debug type.
Native debugging only works on devices that meet the following requirements:
The device supports
run-as.To check whether the device supports
run-as, run the following command on the ADB shell that is connected to your device:run-as your-package-name pwd
Replace
your-package-namewith your app's package name. If the device supportsrun-as, the command should return without any errors.The device has
ptraceenabled.To check whether
ptraceis enabled, run the following command on the ADB shell that is connected to your device:sysctl kernel.yama.ptrace_scope
If
ptraceis enabled, the command will print the value0or an anunknown keyerror. Ifptraceis not enabled, it will print a value other than0.
- Dual (Java + Native) - available only with C/C++ code
-
Select this debug type if you want to switch between debugging both Java and native code.
Android Studio attaches both the Java debugger and LLDB to your app
process so you can inspect
breakpoints in both your Java and native code without restarting your app
or changing your debug configuration.
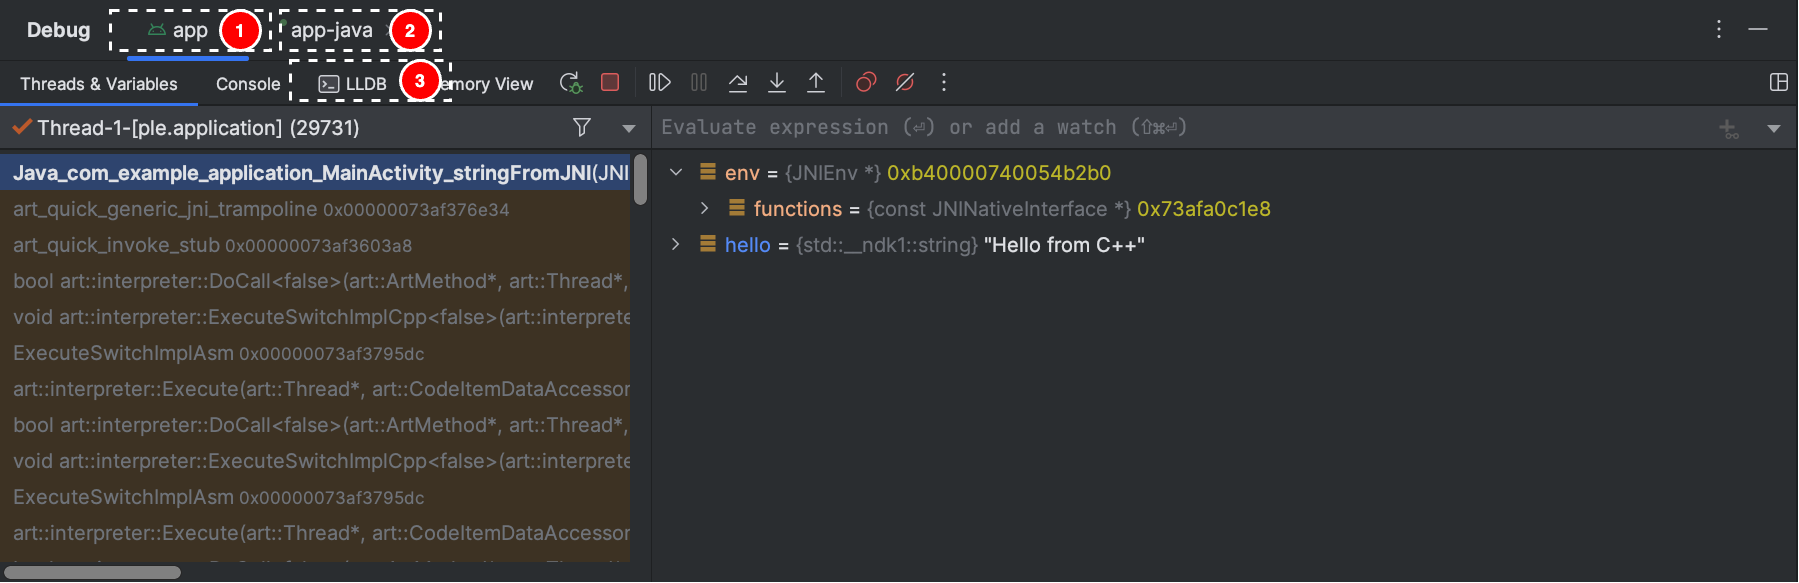
In figure 2, notice the two tabs to the right of the Debug window title. Because the app has both Java and C++ code, one tab is for debugging the native code and the other for debugging Java code, as indicated by -java.
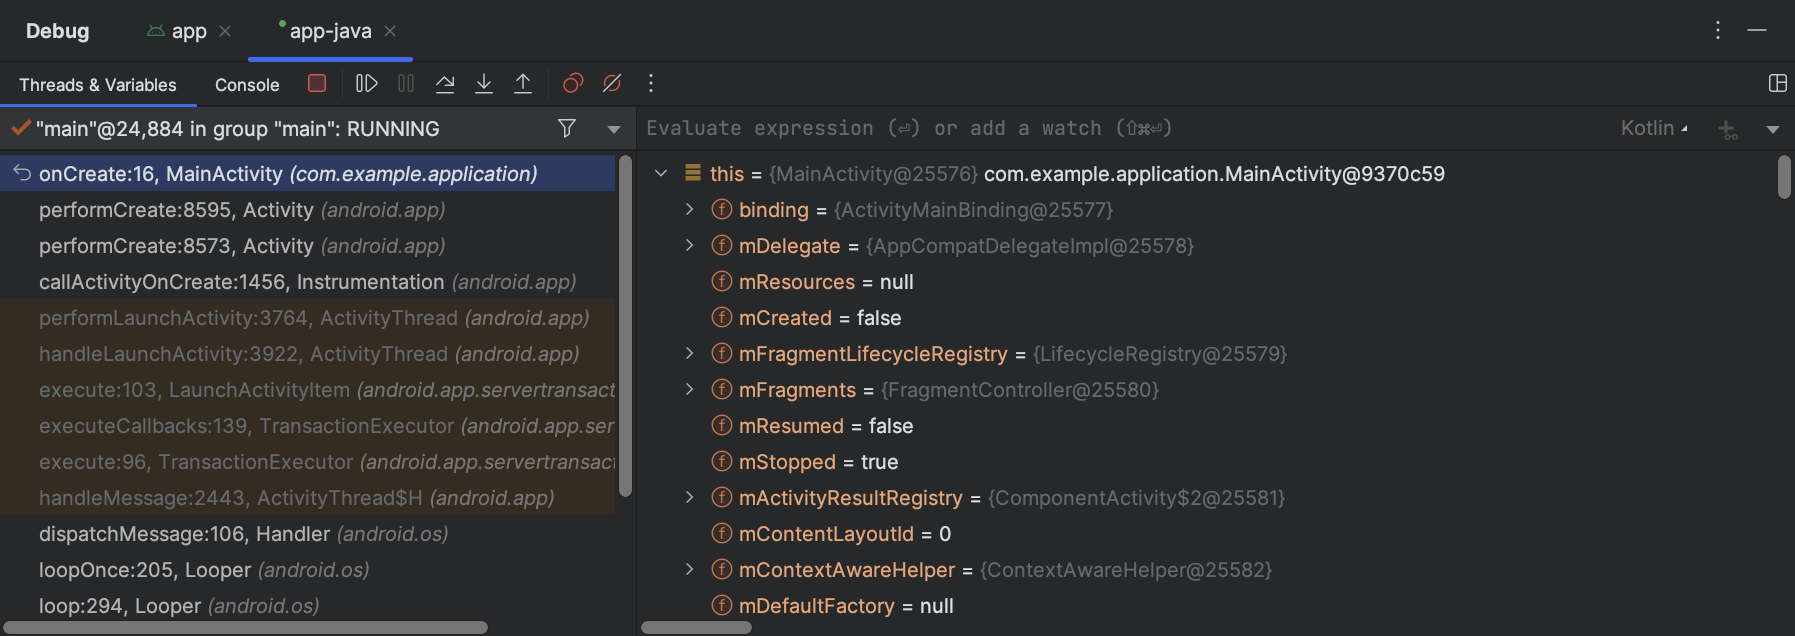
Figure 3. Tab for debugging native code and tab for debugging Java code. - Line breakpoint
- The most common type is a line breakpoint that pauses the execution of your app at a specified line of code. While paused, you can examine variables, evaluate expressions, and then continue execution line by line to determine the causes of runtime errors.
- Method breakpoint
- A method breakpoint pauses the execution of your app when it enters or exits a specific method. While paused, you can examine variables, evaluate expressions, and then continue execution line by line to determine the causes of runtime errors. When you set a breakpoint on a composable function, the debugger lists the parameters of the composable and their state to help identify what changes might have caused the recomposition.
- Field breakpoint
- A field breakpoint pauses the execution of your app when it reads from or writes to a specific field.
- Exception breakpoint
- An exception breakpoint pauses the execution of your app when an exception is thrown.
- Locate the line of code where you want to pause execution.
- Click the left gutter along that line of code or place the caret on the line and press Control+F8 (on macOS, Command+F8).
- If your app is already running, click Attach debugger to Android process
. Otherwise, to start debugging, click Debug
.
-
To examine the object tree for a variable, expand it in the Variables view. If the Variables view is not visible, click Layout Settings
 and ensure that
variables is checked.
and ensure that
variables is checked.
-
To advance to the next line in the code without entering a method, click Step Over
 .
. -
To advance to the first line inside a method call, click Step Into
 .
. -
To advance to the next line outside the current method, click Step Out
 .
. -
To continue running the app normally, click Resume Program
 .
. - Android Studio switches to the
<your-module> tab when LLDB debugger encounters a
breakpoint in your C/C++ code. The Frames, Variables, and
Watches panes are also available and work exactly as they would if you
were debugging Java code.
Although the Threads pane is not available in the LLDB session view, you can access your app processes using the list in the Frames pane. Learn more about these panes in the sections about how to debug window frames and inspect variables.
Note: While inspecting a breakpoint in your native code, the Android system suspends the virtual machine that runs your app’s Java bytecode. This means that you are unable to interact with the Java debugger or retrieve any state information from your Java debugger session while inspecting a breakpoint in your native code.
- Android Studio switches to the <your-module>-java tab when the Java debugger encounters a breakpoint in your Java or Kotlin code.
- While debugging with LLDB, you can use the LLDB terminal in the LLDB session view to pass command-line options to LLDB. If you have certain commands that you would like LLDB to execute each time you start debugging your app, either just before or just after the debugger attaches to your app process, you can add those commands to your debug configuration.
- Enter the expression to watch or display
- Click Add to watches or press Enter to evaluate the expression once.
- Your target physical device or emulator uses an x86 or x86_64 CPU. If
your device uses an ARM CPU, then you must align the boundary of your
variable's address in memory to either 4 bytes, for 32-bit processors, or 8
bytes, for 64-bit processors. To align a variable in your native code, specify
__attribute__((aligned(num_bytes)))in the variable deceleration, as shown below:// For a 64-bit ARM processor int my_counter __attribute__((aligned(8)));
- You have assigned three or fewer watchpoints already. Android Studio only supports up to four watchpoints on x86 or x86_64 target devices. Other devices may support fewer watchpoints.
- While your app is suspended on a breakpoint, navigate to the Variables pane in your LLDB session view.
-
Right-click a variable that occupies the block of memory you want to track and select Add Watchpoint.
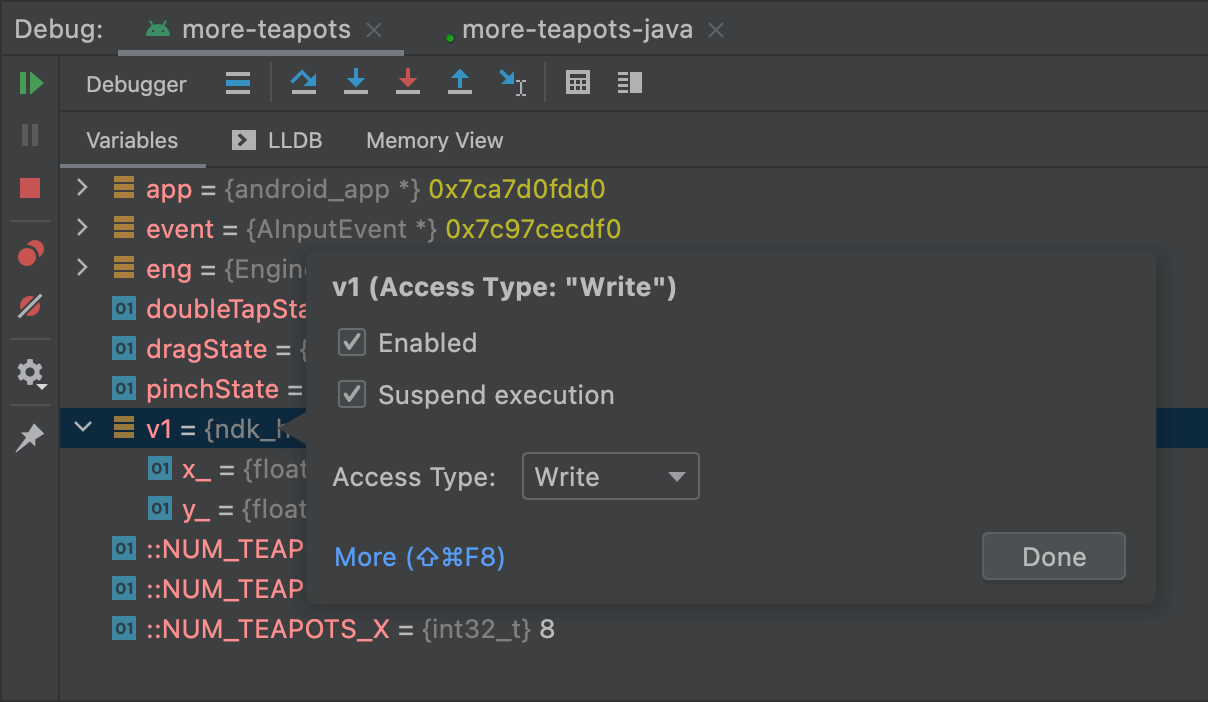
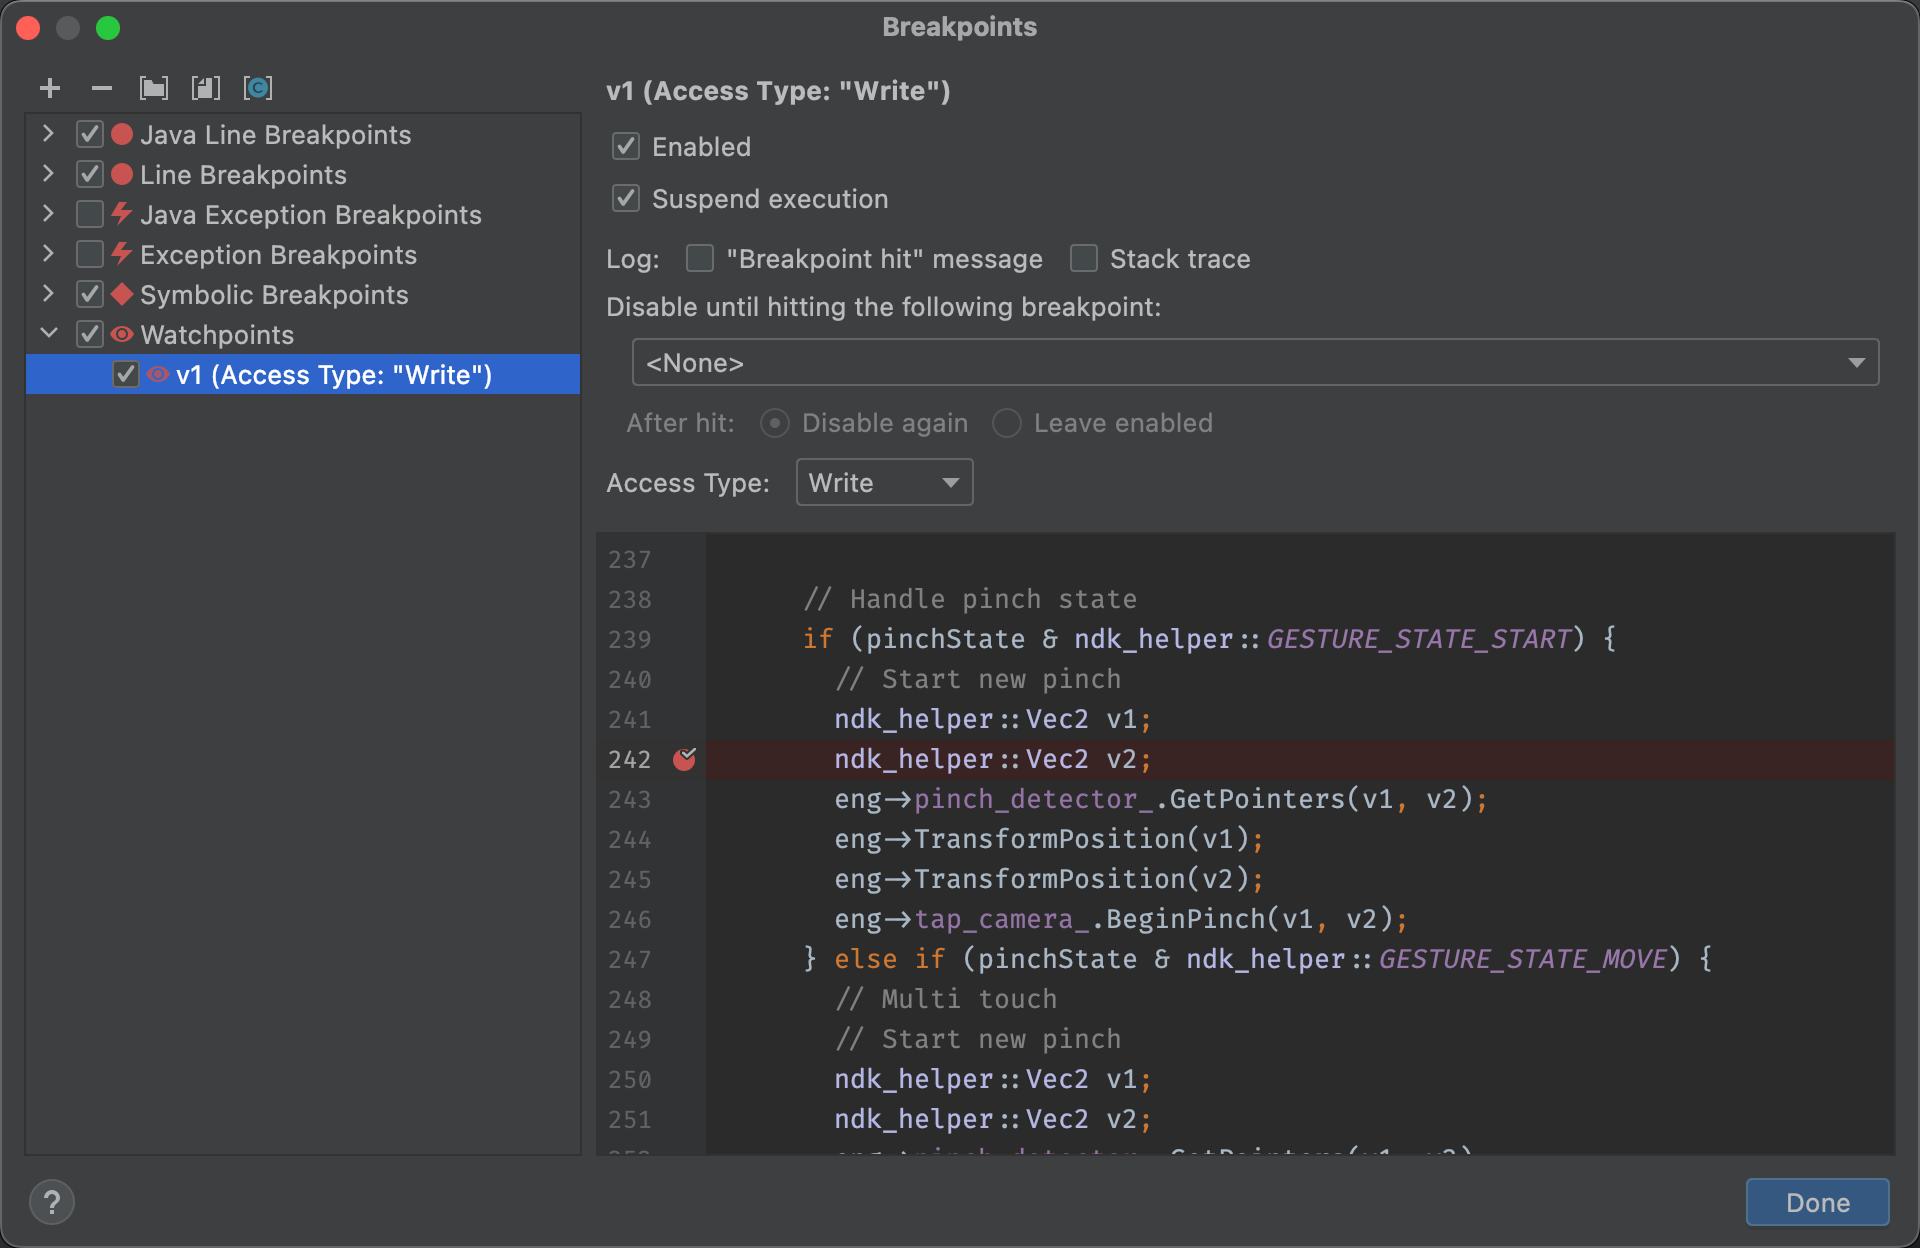
Figure 9. Add a watchpoint to a variable in memory. A dialog to configure your watchpoint appears, as shown in figure 9.
Configure your watchpoint with the following options:
- Enabled: Deselect this option if you want to tell Android Studio to ignore the watchpoint until you change the setting. Android Studio saves your watchpoint so you can access it later.
- Suspend: By default, the Android system suspends your app process when it accesses a block of memory you assign to a watchpoint. Deselect this option if you don’t want this behavior. This reveals additional options you can use to customize behavior when the system interacts with your watchpoint: Log message to console and Remove when hit.
- Access Type: Select whether your app should trigger your watchpoint when it tries to Read or Write to the block of memory the system allocates to the variable. To trigger your watchpoint on either a read or a write, select Any.
- Click Done.
- In the Variables list, right-click anywhere on a resource line to display the list.
- In the list, select View as and select the format you want to use.
The available formats depend on the data type of the resource you selected. You might see one or more of the following options:
- Class: Display the class definition.
- toString: Display string format.
- Object: Display the object (an instance of a class) definition.
- Array: Display in an array format.
- Timestamp: Display date and time as follows: yyyy-mm-dd hh:mm:ss.
- Auto: Android Studio chooses the best format based on the data type.
- Binary: Display a binary value using zeroes and ones.
- MeasureSpec: The value passed from the parent to the selected child.
See
MeasureSpec. - Hex: Display as a hexadecimal value.
- Primitive: Display as a numeric value using a primitive data type.
- Integer: Display as a numeric value of type
Integer.
- Right-click the resource value.
- Select View as.
- Select Create.
- The Java Data Type Renderers dialog displays. Follow the instructions at Java Data type renderers.
Groovy
android {
    buildTypes {
        customDebugType {
            debuggable true
            ...
        }
    }
}
Kotlin
android {
    buildTypes {
        create("customDebugType") {
            isDebuggable = true
            ...
        }
    }
}
This property also applies to modules with C/C++ code.
Note: The
jniDebuggable property is no longer used.
If your app depends on a library module that you also want to debug, that library must also
be packaged with debuggable true so it retains its debug symbols.
To ensure that the debuggable variants of your app project receive the debuggable variant of
a library module, publish non-default versions of your library.
Start debugging
You can start a debugging session as follows:
Attach the debugger to a running app
If your app is already running on your device, you can start debugging without restarting your app as follows:
The Processes tab in the Device Explorer (View > Tool Windows > Device Explorer)
also has a list of debuggable processes. From there you can select a process and perform a kill
 ,
force-stop
,
force-stop
 ,
or attach the debugger to a given process
,
or attach the debugger to a given process
 .
.
The debug window
The debug window is divided into
Note: The Android Studio debugger and garbage collector are
loosely integrated. The Android virtual machine guarantees that any object
the debugger is aware of is not garbage collected until after the debugger
disconnects. This can result in a buildup of objects while the
debugger is connected. For example, if the debugger sees a running thread,
the associated Thread
object is not garbage collected until the debugger disconnects, even if the thread has terminated.
Change the debugger type
Because different debugger tools are required to debug Java/Kotlin code and C/C++ code, the Android Studio debugger lets you select which debugger type to use. By default, Android Studio decides which debugger to use based on which languages it detects in your project using the Detect Automatically debugger type.
To manually select the debugger in the debug configuration, click Run > Edit Configurations. You can also select the debugger in the dialog that appears when you click Run > Attach debugger to Android process.
The debug types available include the following:
Note: While debugging native code that is optimized by the
compiler, you may get the following warning message:This function was
compiled with optimizations enabled. Some debugger features may not be
available. When using optimization flags, the compiler makes changes to your
compiled code to make it run more efficiently. This can cause the debugger to
report unexpected or incorrect information because it’s difficult for the
debugger to map the optimized compiled code back to the original source code.
For this reason, you should disable compiler optimizations while debugging
your native code.
Use the system log
The system log shows system messages while you debug your app. These messages include information from apps running on the device. If you want to use the system log to debug your app, make sure your code writes log messages and prints the stack trace for exceptions while your app is in the development phase.
Write log messages in your code
To write log messages in your code, use the
Log class. Log messages help
you understand the execution flow by collecting the system debug output while
you interact with your app. Log messages can also tell you what part of your
app failed. For more information about logging, see
Write and view logs with Logcat.
The following example shows how you might add log messages to determine whether previous state information is available when your activity starts:
Kotlin
import android.util.Log
...
class MyActivity : Activity() {
    ...
    override fun onCreate(savedInstanceState: Bundle?) {
        ...
        if (savedInstanceState != null) {
            Log.d(TAG, "onCreate() Restoring previous state")
            /* restore state */
        } else {
            Log.d(TAG, "onCreate() No saved state available")
            /* initialize app */
        }
        ...
    }
  ...
  companion object {
    private val TAG: String = MyActivity::class.java.simpleName
    ...
  }
}
Java
import android.util.Log;
...
public class MyActivity extends Activity {
    private static final String TAG = MyActivity.class.getSimpleName();
    ...
    @Override
    public void onCreate(Bundle savedInstanceState) {
       ...
       if (savedInstanceState != null) {
            Log.d(TAG, "onCreate() Restoring previous state");
            /* restore state */
        } else {
            Log.d(TAG, "onCreate() No saved state available");
            /* initialize app */
        }
        ...
    }
}
During development, your code can also catch exceptions and write the stack trace to the system log:
Kotlin
fun someOtherMethod() {
    try {
        ...
    } catch (e : SomeException) {
        Log.d(TAG, "someOtherMethod()", e)
    }
}
Java
void someOtherMethod() {
    try {
        ...
    } catch (SomeException e) {
        Log.d(TAG, "someOtherMethod()", e);
    }
}
Note: Remove debug log messages and stack trace print calls from
your code when you are ready to publish your app. To do so, set a DEBUG
flag and place debug log messages inside conditional statements.
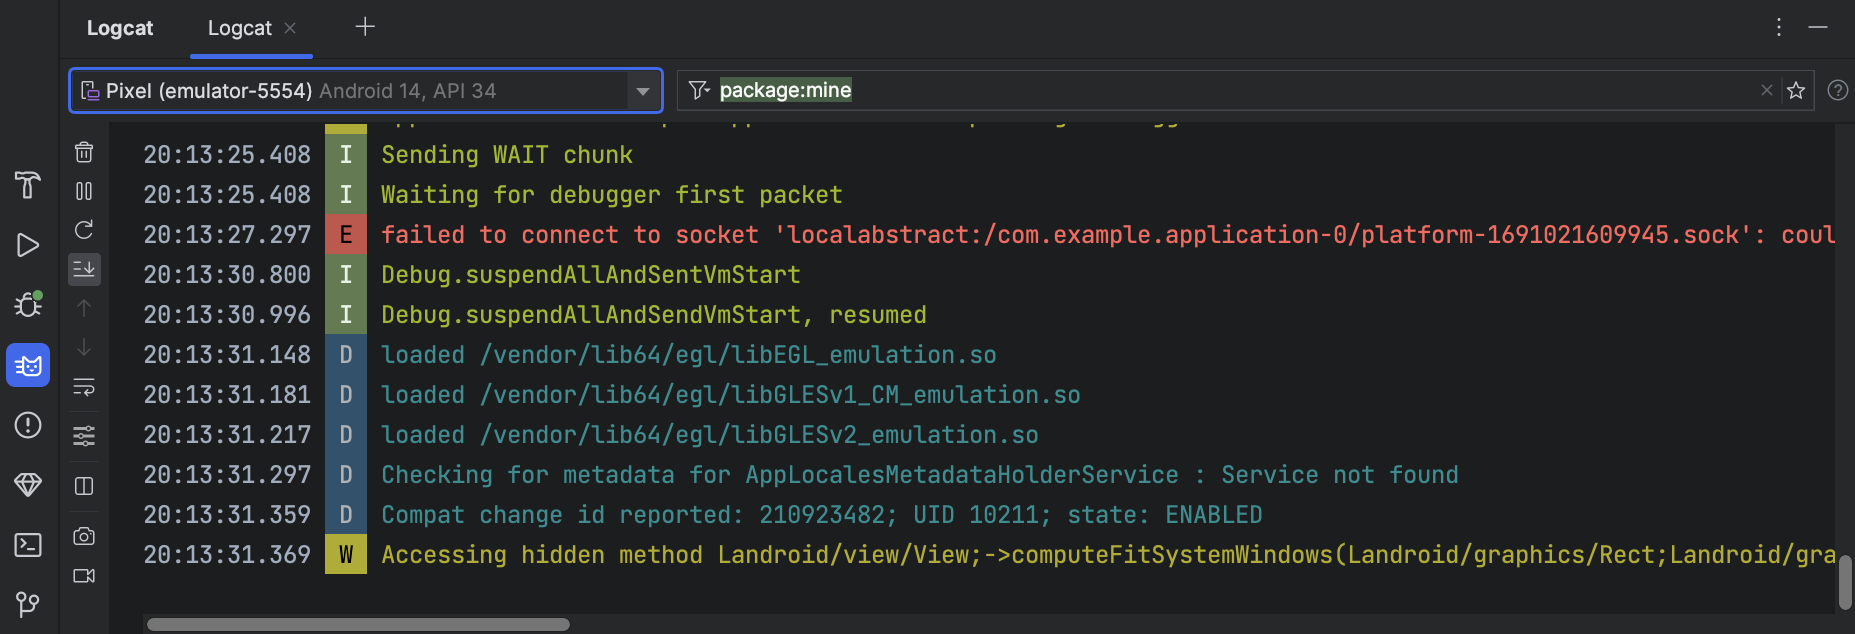
View the system log
You can view and filter debug and other system messages in the Logcat window, as shown
in figure 4. For example, you can see messages when garbage collection occurs or messages that
you add to your app with the
Log class.
To use Logcat, start debugging and select the Logcat tab.
For a description of Logcat and its filtering options, see Write and view logs with Logcat.
Work with breakpoints
Android Studio supports breakpoints that trigger different debugging actions. There are a several types types of breakpoint:
You can set conditional breakpoints that will only suspend execution if specific conditions are met. You can also set logging breakpoints that write to Logcat without suspending execution. This can help avoid littering your code with log statements.
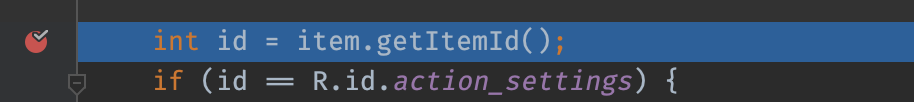
To add a line breakpoint, proceed as follows:
A red dot appears next to the line when you set a breakpoint, as shown in figure 5.
When your code execution reaches the breakpoint, Android Studio pauses execution of your app.
To identify the state of the app, use the tools in the Debugger tab:
If your project uses any native code, by default the Detect Automatically debug type attaches both the Java debugger and LLDB to your app as two separate processes. You can switch between inspecting Java and C/C++ breakpoints without restarting your app or changing settings.
Note: For Android Studio to detect breakpoints in your C or C++ code, you need to use a debug type that supports LLDB, such as Detect Automatically, Native, or Dual. You can change the debug type Android Studio uses by editing your debug configuration. To learn more about the different debug types, read the section about using other debug types.
When Android Studio deploys your app to your target device, the Debug window opens with a tab or debug session view for each debugger process, as shown in figure 6.
While debugging C/C++ code, you can also set special types of breakpoints, called watchpoints, that can suspend your app process when your app interacts with a particular block of memory. To learn more, read the section about how to add watchpoints.
View and configure breakpoints
To view all the breakpoints and configure breakpoint settings, click
View Breakpoints
 in the
Debug window. The Breakpoints window appears,
as shown in figure 7.
in the
Debug window. The Breakpoints window appears,
as shown in figure 7.
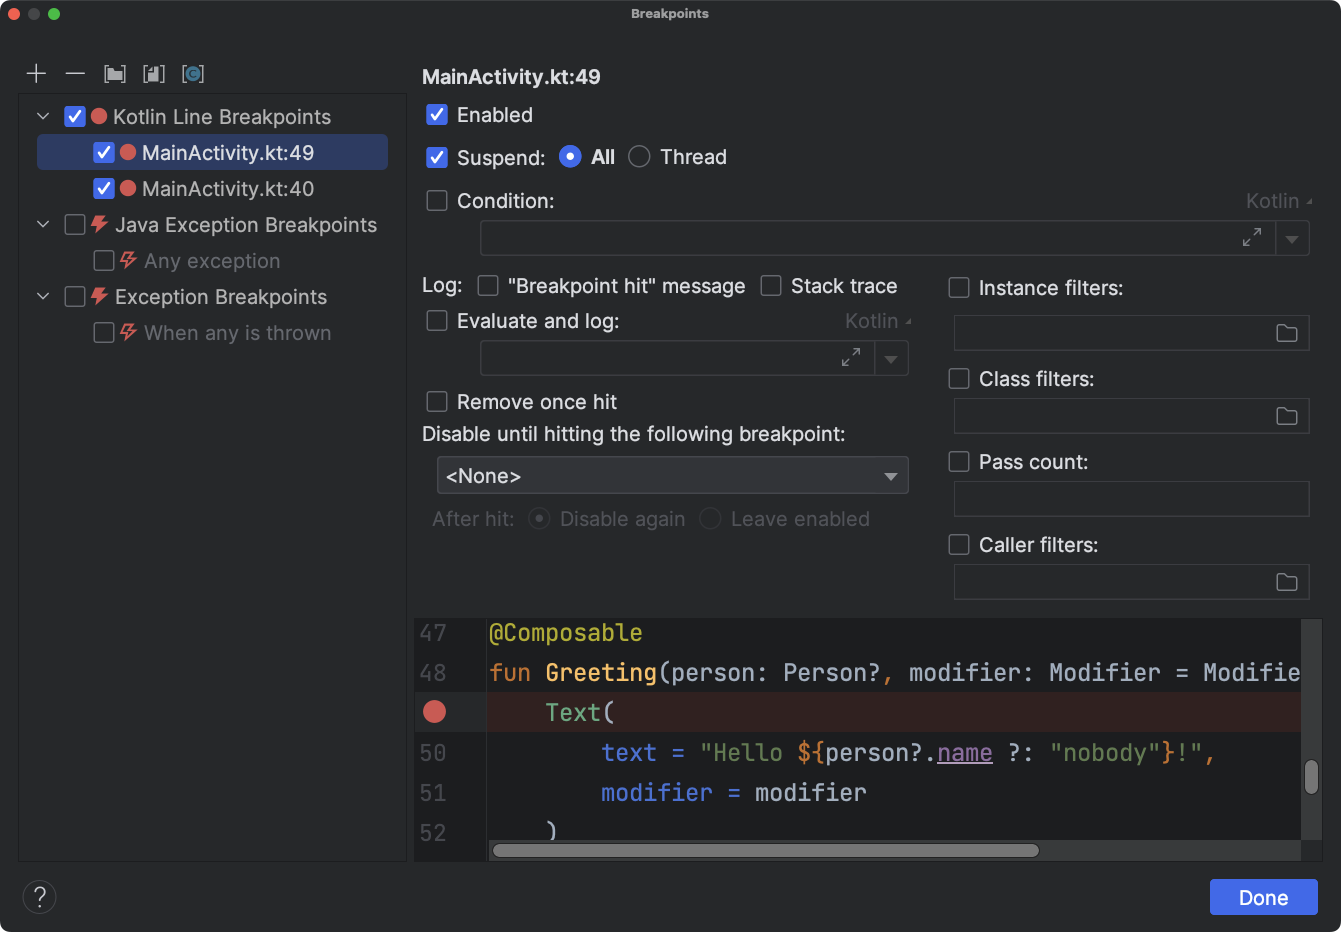
The Breakpoints window lets you enable or disable each breakpoint from the list in the pane. If a breakpoint is disabled, Android Studio doesn't pause your app when it hits that breakpoint.
Select a breakpoint from the list to configure its settings. You can configure a breakpoint to be disabled at first and have the system enable it after a different breakpoint is hit. You can also configure whether a breakpoint should be disabled after it is hit. To set a breakpoint for any exception, select Exception Breakpoints in the list of breakpoints.
To temporarily disable all breakpoints, click Mute Breakpoints
 in the
Debug window. Click again to re-enable.
in the
Debug window. Click again to re-enable.
Debug window frames
In the Debugger window, the Frames pane lets you inspect the stack frame that caused the current breakpoint to be hit. This enables you to navigate and examine the stack frame and also inspect the list of threads in your Android app.
To select a thread, use the thread selector menu and view its stack frame. Click the elements in the frame to open the source in the editor. You can also customize the thread presentation and export the stack frame as discussed in the Examine Frames guide.
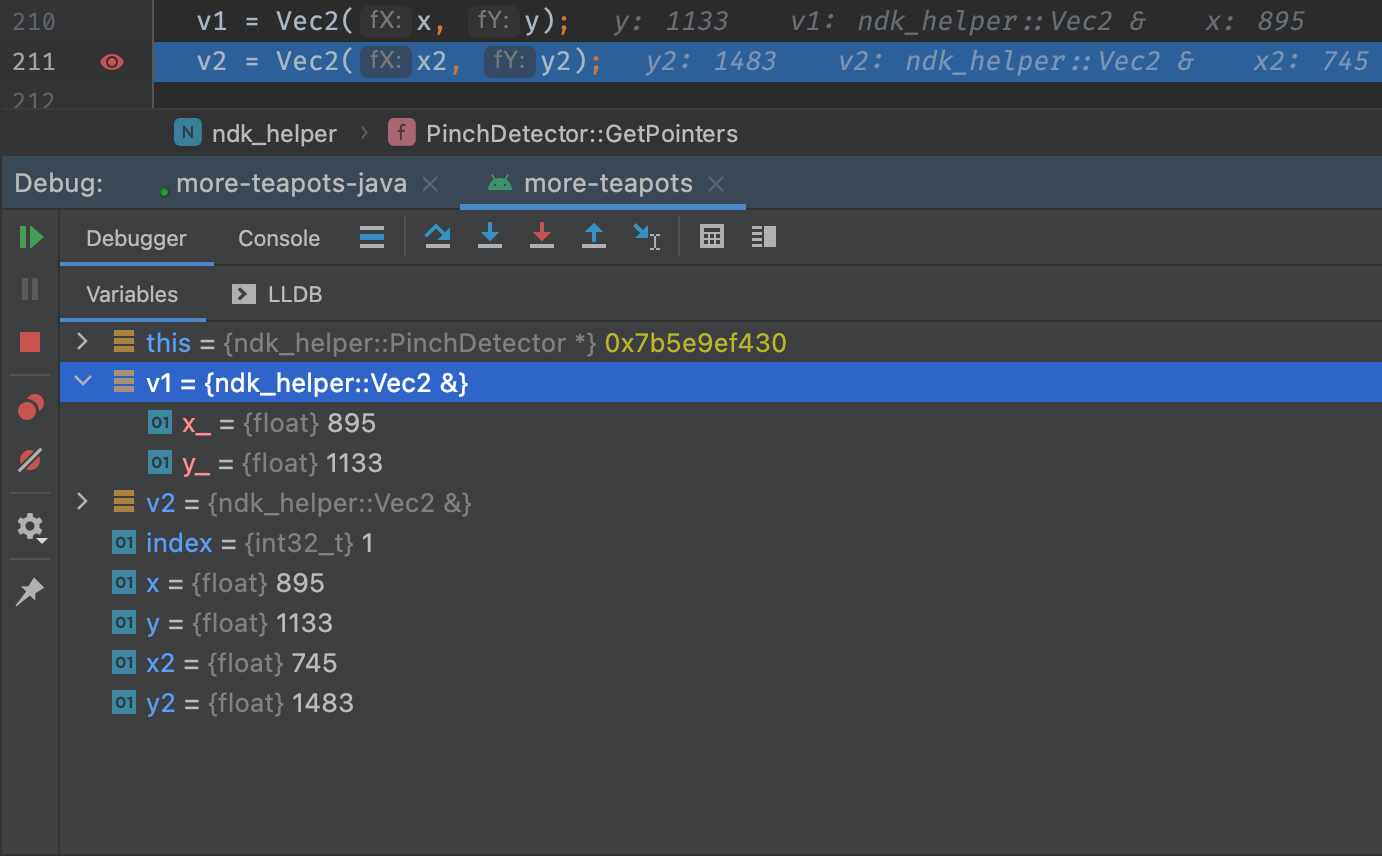
Inspect variables
In the Debugger window, the Variables pane lets you inspect variables when the system stops your app on a breakpoint and you select a frame from the Frames pane. The Variables pane also lets you evaluate ad hoc expressions using static methods and/or variables available within the selected frame.
To add an expression to the object tree (while the application is being debugged):
Alternatively, if the object tree contains the expression you want to watch, you can drag it to the top of the tree to add it as a watched expression.
Watched expressions will update when breakpoints are hit or you step through your code.
Evaluated expressions will remain displayed at the top of the object tree until you manually evaluate another expression or step through your code.
To remove a watched expression from the object tree, right-click the expression and then click Remove Watch.
Add watchpoints
While debugging C/C++ code, you can set special types of breakpoints, called watchpoints, that can suspend your app process when your app interacts with a particular block of memory. For example, if you set two pointers to a block of memory and assign a watchpoint to it, using either pointer to access that block of memory triggers the watchpoint.
In Android Studio, you can create a watchpoint during runtime by selecting a specific variable, but LLDB assigns the watchpoint to only the block of memory the system allocates to that variable, not the variable itself. This is different from adding a variable to the Watches pane, which enables you to observe the value of a variable but doesn’t let you suspend your app process when the system reads or changes its value in memory.
Note: When your app process exits a function and the system deallocates its local variables from memory, you need to reassign any watchpoints you created for those variables.
To set a watchpoint, you must meet the following requirements:
Note: When debugging your app with 32-bit ARM ABIs, adding a watchpoint or hovering over variables inside the code to investigate their values may cause a crash. As a workaround, debug using 64-bit ARM, x86, or x86_64 binaries. This issue will be fixed in an upcoming Android Studio release.
If you meet the requirements, you can add a watchpoint as follows:
To view all your watchpoints and configure watchpoint settings, click View Breakpoints
in the Debug window. The
Breakpoints dialog appears, as shown in figure 10.
After you add your watchpoint, click Resume Program
in the Debug window to resume your app
process. By default, if your app tries to access a block of memory that you
have set a watchpoint to, the Android system suspends your app process and a
watchpoint icon ![]() appears next to the line of code that your app
executed last, as shown in figure 11.
appears next to the line of code that your app
executed last, as shown in figure 11.
View and change resource value display format
In debug mode, you can view resource values and select a different display format for variables in your Java or Kotlin code. With the Variables tab displayed and a frame selected, do the following:
To create a custom format, do the following: