
This document shows the basic setup steps and workflow for the Batterystats tool and the Battery Historian script. To learn how to use Battery Historian to inspect battery consumption patterns, see Analyze power use with Battery Historian.
Batterystats is a tool included in the Android framework that collects battery
data on your device. You can use adb to dump the
collected battery data to your development machine and create a report you can
analyze using Battery Historian. Battery Historian converts the report from
Batterystats into an HTML visualization that you can view in your browser.
Batterystats and Battery Historian are useful for the following:
- Showing you where and how processes are drawing current from the battery.
- Identifying tasks in your app that can be deferred or removed to improve battery life.
Install Battery Historian
You can use Docker to install Battery Historian. For alternative installation methods, including building from source, see the README on the project's GitHub page. To install using Docker, do the following:
Install Docker by following the instructions on the Docker website. Any subscription type works, including a free Personal subscription.
To confirm Docker is correctly installed, open the command line and enter the following command:
docker run hello-worldIf Docker is correctly installed, it displays an output like this:
Unable to find image 'hello-world:latest' locally
latest: Pulling from library/hello-world
78445dd45222: Pull complete
Digest:
sha256:c5515758d4c5e1e838e9cd307f6c6a0d620b5e07e6f927b07d05f6d12a1ac8d7
Status: Downloaded newer image for hello-world:latest

Hello from Docker!
This message shows that your installation appears to be working correctly.

To generate this message, Docker took the following steps:
1. The Docker client contacted the Docker daemon.
2. The Docker daemon pulled the "hello-world" image from the Docker Hub.
3. The Docker daemon created a new container from that image which runs the
executable that produces the output you are currently reading.
4. The Docker daemon streamed that output to the Docker client, which sent it to your terminal
Launch the Docker Desktop app—which is a GUI frontend for Docker—before you run the Battery Historian image. Running this initializes the Docker tools. Battery Historian doesn't run until you do this at least once.
Run Battery Historian from the command line when running it for the first time. The Docker Desktop app doesn't let you specify the port to run the web server on. You can only do this from the command line. However, after you successfully run the container from the command line, an entry is created in Docker Desktop, and then you can launch it using the same listener port from Docker Desktop.
Run the Battery Historian image using the following command:
docker run -p port_number:9999 gcr.io/android-battery-historian/stable:3.1 --port 9999
Battery Historian uses the port of your choice, as specified using
port_number.Navigate to Battery Historian in your browser to confirm it's running. The address varies depending on your operating system:
- For Linux and Mac
- Battery Historian is available at
http://localhost:port_number. - For Windows
- After you start Docker, it tells you the IP address of the machine it
is using. For example, if the IP address is 123.456.78.90, Battery
Historian is available at
http://123.456.78.90:port_number.
It then displays the Battery Historian start page, where you can upload and view battery statistics.
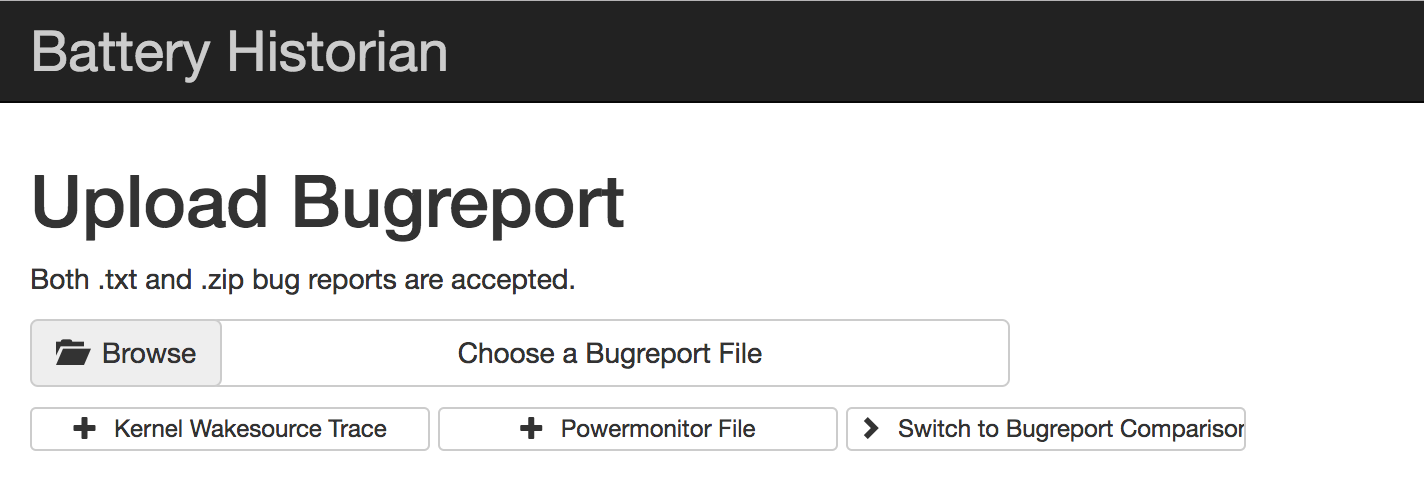
Figure 1. The start page for Battery Historian.
Gather data with Batterystats
To collect data from your device using Batterystats and open it in Battery Historian, do the following:
Connect your mobile device to your computer.
From a Terminal window, shut down your running
adbserver by running the following command:adb kill-serverRestart
adband check for connected devices by running the following command.adb devicesIt lists your device, similar to the following example output.
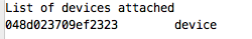
Figure 2. The output of adb devices, showing one connected deviceIf it doesn't list any devices, make sure your phone is connected and USB debugging is enabled, and then stop and restart
adb.Reset battery data gathering by running the following command:
adb shell dumpsys batterystats --resetThe device is always collecting Batterystats and other debugging information in the background. Resetting erases previous battery collection data. If you don't reset, the output can be very large.
Disconnect your device from your computer so that you are only drawing current from the device's battery.
Use your app and perform actions for which you want to collect data for. For example, disconnect from Wi-Fi and send data to the cloud.
Reconnect your phone.
Make sure your phone is recognized and run the following command:
adb devicesDump all battery data by running the following command. This can take a while.
adb shell dumpsys batterystats > [path/]batterystats.txt
The
batterystats.txtfile is created in the directory you specify using the optional path argument. If you don't specify a path, the file is created in your home directory.Create a report from raw data.
- For devices running Android 7.0 and higher:
-
adb bugreport [path/]bugreport.zip
- For devices running Android 6.0 and lower:
-
adb bugreport [path/]bugreport.txt
Bugreport can take several minutes to complete. Don't disconnect your device or cancel the process until it's complete.
As with
batterystats.txt, these files are created in the directory you specify using the optionalpathargument. If you don't specify a path, they are created in your home directory.If it's not already running, run Battery Historian using the following command:
docker run -p port_number:9999 gcr.io/android-battery-historian/stable:3.1 --port 9999
To view your data in Battery Historian, open the Battery Historian in your browser. For Mac and Linux, Battery Historian runs at
http://localhost:port_number. For Windows, Battery Historian runs athttp://your_IP_address:port_number.Click Browse and then choose the bugreport file you created.
Click Submit. Battery Historian opens a chart created from your Batterystats data.
View data with Battery Historian charts
The Battery Historian chart graphs power-relevant events over time.
Each row shows a colored bar segment when a system component is active and thus drawing current from the battery. The chart doesn't show how much battery is used by the component—only whether the app is active. Charts are organized by category, showing a bar for each category over time, as displayed on the x-axis of the chart.
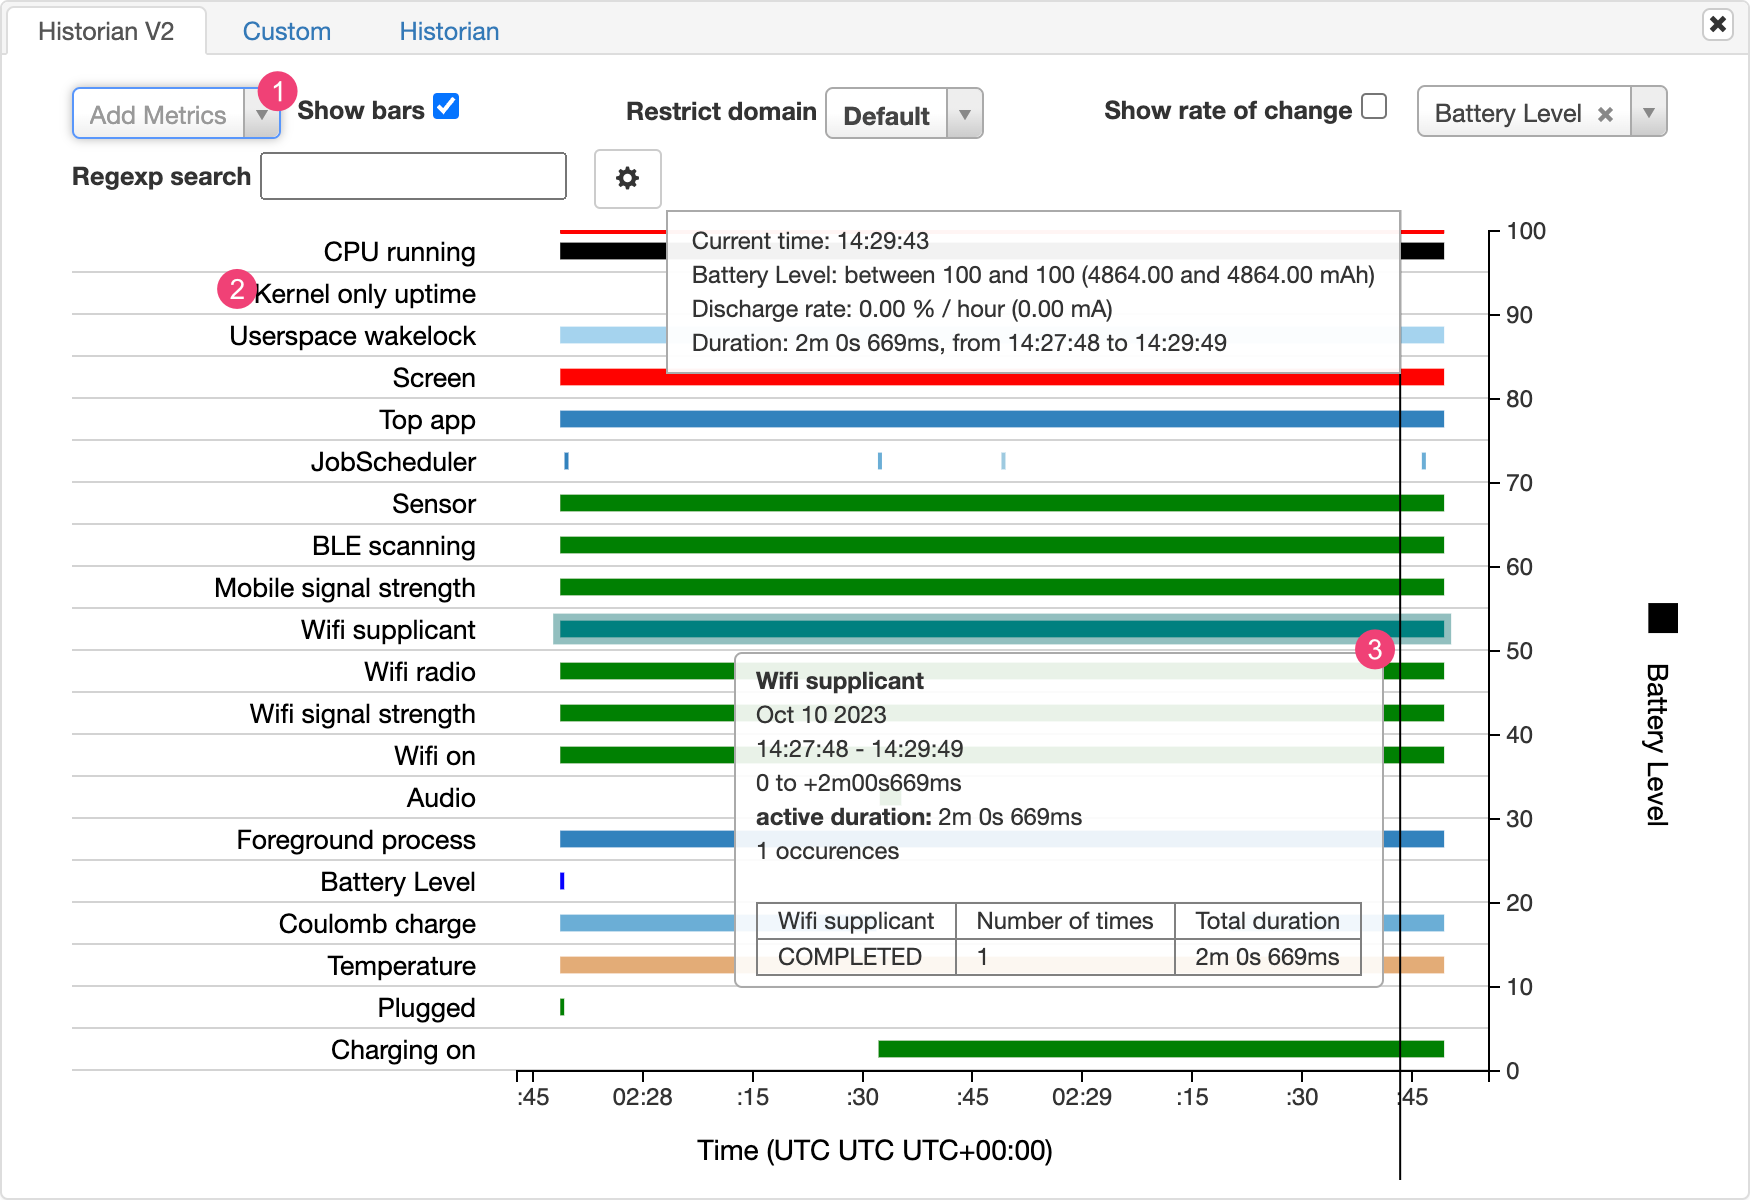
- Add additional metrics from the drop-down list.
- Hold the pointer over the metric name to see more information about each metric, including a key for the colors used in the chart.
- Hold the pointer over a bar to see more detailed information about that metric and the battery stats at a specific point on the timeline.
Additional Batterystats output
You can view additional information from the batterystats.txt file in the
stats section after the Battery Historian chart.
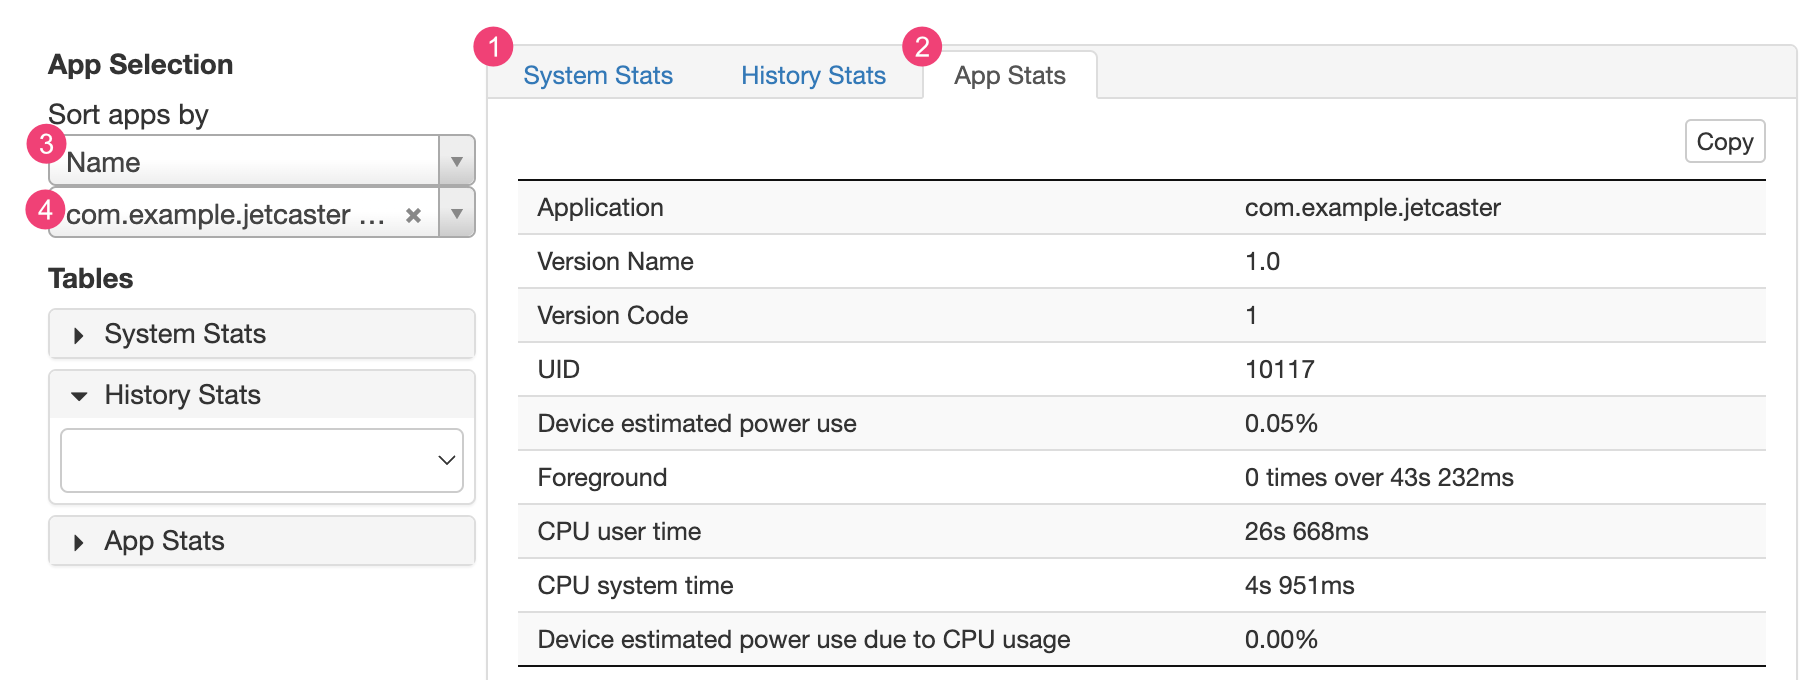
The 1 System Stats tab includes system-wide statistics, such as cell signal levels and screen brightness. This information provides an overall picture of what's happening with the device. This is especially useful to make sure no external events are affecting your test.
The 2 App Stats tab includes information about specific apps. Sort the list of apps using the 3 Sort apps by drop-down list in the App Selection pane. You can select a specific app to view stats for using the 4 apps drop-down list.