
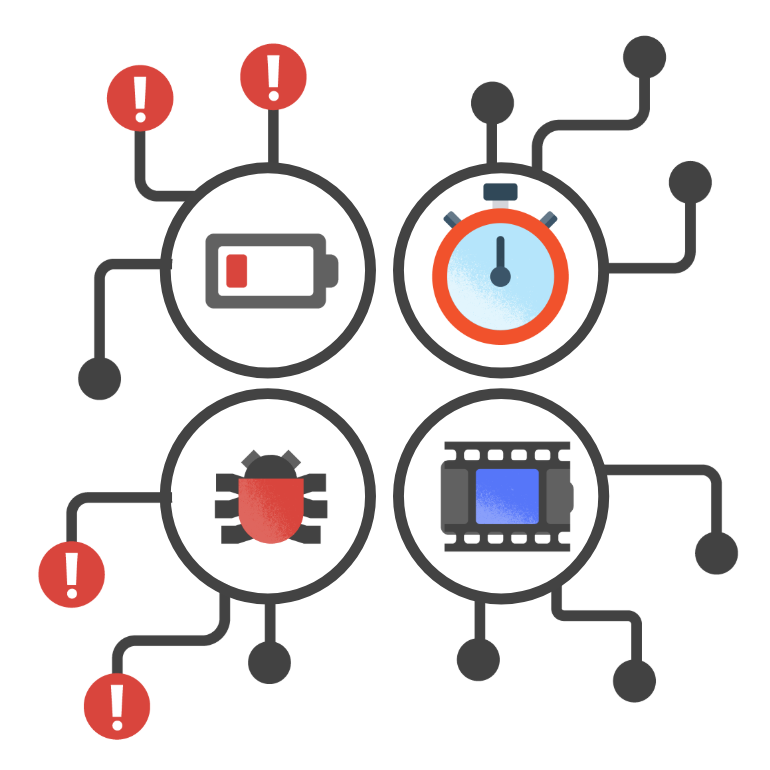
Android vitals helps Google improve the quality of Android apps on Google Play. When a user allows it, their Android-powered device tracks app quality metrics such as stability, performance, battery use, and permission issues. Google Play collects this data, which can be accessed through the Android vitals dashboard in the Play Console, and through the Google Play Developer Reporting API.
Developers should monitor Android vitals to improve the user experience, especially the core vitals: user-perceived crash rate, user-perceived ANR rate, excessive partial wake locks, memory usage, and bitmap memory usage.
Core vitals and bad behaviors
Your app's core vitals affect your app's visibility on Google Play. In addition to core vitals, Android vitals alerts you to items such as DEX Code Optimization that require attention and may also affect your app's visibility on Google Play. User-perceived crash rate and user-perceived ANR rate have an overall bad behavior threshold and a per-device bad behavior threshold.
Excessive partial wake locks only has an overall bad behavior threshold and excessive battery usage on wear OS has an overall and per watch model threshold.
The memory usage metric has different thresholds for each device RAM tier and app state, and differs for apps and games. Bitmap memory usage is the same across device RAM tiers, but has different thresholds for each app state.
FAQs
What are core vitals?
Core vitals are the most important metrics in Android vitals, and affect the visibility of your app on Google Play. The core vitals are:
Stability: User-perceived crash rate and user-perceived ANR rate for all apps.
Battery: Excessive partial wake locks for all apps, and excessive battery usage for watch face apps.
Memory: Memory usage (Anonymous RSS + Swap) and bitmap memory usage for all mobile apps.
What are the bad behavior thresholds?
Stability & Battery Vitals
|
BAD BEHAVIOR THRESHOLD To maximize your title's visibility on Google Play, please keep it under these thresholds. |
|||
|---|---|---|---|
| Overall (average across devices) | Per phone model | Per watch model | |
| User-perceived crash rate | 1.09% | 8% | 4% |
| User-perceived ANR rate | 0.47% | 8% | 5% |
| Excessive battery usage | 1% | - | 1% |
| Excessive partial wake locks | 5% | - | - |
Memory Vitals
Apps
|
BAD BEHAVIOR THRESHOLD To maximize your title's visibility on Google Play, please keep it under these thresholds. |
|||||
|---|---|---|---|---|---|
| Physical RAM (Total Memory Range) |
App State | ||||
| Foreground | User-Perceived Services | Background | Cached | ||
| Memory usage (Anonymous RSS + Swap) | 0 - 4 GB (0 - 3200 MB) |
- | - | - | - |
| 4 GB (3200 - 4800 MB) |
2.00 GB | 1.00 GB | 1.00 GB | - | |
| 6 GB (4800 - 6800 MB) |
2.25 GB | 1.25 GB | 1.25 GB | - | |
| 8 GB (6800 - 9216 MB) |
2.25 GB | 1.50 GB | 1.50 GB | - | |
| 12 GB (9216 - 14336 MB) |
3.25 GB | 1.75 GB | 1.75 GB | - | |
| 16 GB (14336 - 18432 MB) |
4.25 GB | 2.00 GB | 2.00 GB | - | |
| 16 GB + (Above 18432 MB) |
- | - | - | - | |
| Bitmap memory usage | - | - | 200 MB | 200 MB | 400 MB |
Games
|
BAD BEHAVIOR THRESHOLD To maximize your title's visibility on Google Play, please keep it under these thresholds. |
|||||
|---|---|---|---|---|---|
| Physical RAM (Total Memory Range) |
App State | ||||
| Foreground | User-Perceived Services | Background | Cached | ||
| Memory usage (Anonymous RSS + Swap) | 0 - 4 GB (0 - 3200 MB) |
- | - | - | - |
| 4 GB (3200 - 4800 MB) |
2.25 GB | 2.00 GB | 2.00 GB | - | |
| 6 GB (4800 - 6800 MB) |
2.75 GB | 2.50 GB | 2.50 GB | - | |
| 8 GB (6800 - 9216 MB) |
3.50 GB | 2.75 GB | 2.75 GB | - | |
| 12 GB (9216 - 14336 MB) |
4.00 GB | 3.20 GB | 3.20 GB | - | |
| 16 GB (14336 - 18432 MB) |
5.00 GB | 3.50 GB | 3.50 GB | - | |
| 16 GB + (Above 18432 MB) |
- | - | - | - | |
| Bitmap memory usage | - | - | 200 MB | 200 MB | 400 MB |
DEX Code Optimization
|
BAD BEHAVIOR THRESHOLD
To maximize your title's visibility on Google Play, please keep it above these thresholds. |
||
|---|---|---|
| Criteria | Requirement | Minimum threshold |
| Apps with > 10 MB DEX code | Optimization, Obfuscation, and Shrinking | 25% |
| Games with > 50 MB DEX code | Optimization, Obfuscation, and Shrinking | 25% |
How do core vitals affect my title's visibility on Play?
If your app or game exceeds a bad behavior threshold, Play may reduce the visibility of your title. Play may also show users a warning on your store listing.
Is it possible to have both per-device and overall bad behaviors? Or one but not the other? What do I do if so?
Yes, all combinations are possible. To improve app quality, fix the crashes and ANRs affecting the most users. For better quality on specific devices, fix the biggest crash and ANR groups on those devices. If you have both issues, focus first on the largest overall crash and ANR clusters.
I need help to fix my technical issues. Where do I start?
The following resources resources are provided to help you diagnose and fix technical issues in your app or game.
Core vitals:
User-perceived ANR rate
User-perceived crash rate
Excessive battery usage
Excessive partial wake locks
Memory usage (Anonymous RSS + swap)
Bitmap memory usage
All other vitals:
Excessive wakeups
Stuck partial wake locks
Excessive background Wi-Fi scans
Excessive background network
usage
App startup time
Slow rendering
Slow Sessions
Low memory killers (LMKs)
Permission denials
I don't want to be surprised by bad behaviors or store listing warnings. How can I get ahead of this?
Play uses the last 28 days of data to assess your app's quality. Android vitals warn you about any problems during that period.
- Regularly check the UI or use the reporting API to integrate data into your workflow.
- Set up email alerts in the Play Console for issues.
- Android vitals flags "emerging issues"—problems affecting devices for over 7 days for crashes and ANRs. This gives you 21 days to address them.
I have a lot of devices with bad behaviors. How do I make sense of the list?
Sometimes, device hardware or software problems cause high error rates. Android vitals alerts you to possible links between high error rates and things like RAM, Android version, and processor type. You can also investigate these links yourself using Reach and Devices in the Play Console.
Android vitals also provides quick access to key device information, such as user numbers, revenue, ratings, and reviews. This information is shown in a side panel, so you don't need to leave your current page.
If I fix an issue on a device, how long before warnings stop showing?
Play checks your app's key performance indicators daily, using a 28-day average. When this average improves, Android vitals warnings disappear. Store listing warnings may be removed faster if Play's system detects improvement.
What if I can't fix the issue, or I don't want to do so?
Ensure you've weighed the costs and lost opportunities from ongoing poor user experiences. Bad behavior hurts current users and makes it harder to attract new ones. If fixing problems on specific devices isn't practical, reconsider your device targeting and exclusion rules.
Why don't Android vitals issue counts and rates match the issue counts and rates I see from my own or other third-party solutions?
Android vitals is Play's main source for technical app quality. The number of issues and rates may differ from other sources for several reasons:
- Android vitals data comes from the Android system and includes events not
seen by SDKs, such as:
- Crashes before SDK initialization
- ANRs before Android 12
- Android vitals only counts issues from certified devices and apps installed from Google Play.
- Android vitals only uses data from users who agreed to share data.
- To protect user privacy, we only show data if we have enough to make anonymous reports.
- Issue rates may be calculated differently. Android vitals shows issues per
daily active user.
- For example, Crashlytics counts the number of issues per app session. If a user played a game three times in one day and experienced one crash, Android vitals would show a 100% crash rate while Crashlytics would show a 33% crash rate.
For more information on how data is collected, see the Play Console Help Center.
Can I see my ANR and crashes insights in the IDE?
Yes, from Android Studio Meerkat, when viewing reports in App Quality Insights, click the Insights tab. Gemini provides a summary of the crash, generates insights, and links to useful documentation. If you also provide Gemini with access to local code context, Gemini can provide more accurate results, relevant next steps, and code suggestions. This helps you reduce the time spent diagnosing and resolving issues. See the Android Studio documentation to learn more.
What is considered a user session and when does it begin and end?
A user session is defined as the sum of usage activity that occurs in a 24-hour period. The 24-hour period starts at midnight Pacific Time (PT) for all collected Android vitals metrics. If there is no usage activity recorded on the app for the day, a session is not recorded.