

Cette page explique comment déboguer une erreur L'application ne répond pas (ANR) à l'aide de ProfilingManager avec un exemple de trace système.
Configurer l'application pour collecter les ANR
Commencez par configurer un déclencheur d'ANR dans votre application :
Kotlin
fun addANRTrigger() { val profilingManager = applicationContext.getSystemService(ProfilingManager::class.java) ?: return val triggers = ArrayList<ProfilingTrigger>() val triggerBuilder = ProfilingTrigger.Builder(ProfilingTrigger.TRIGGER_TYPE_ANR) triggers.add(triggerBuilder.build()) val callbackExecutor: Executor = Executors.newSingleThreadExecutor() val resultCallback = Consumer<ProfilingResult> { profilingResult -> // Handle uploading trace to your back-end } profilingManager.registerForAllProfilingResults(callbackExecutor, resultCallback) profilingManager.addProfilingTriggers(triggers) }
Java
public void addANRTrigger() { ProfilingManager profilingManager = getApplicationContext().getSystemService( ProfilingManager.class); List<ProfilingTrigger> triggers = new ArrayList<>(); ProfilingTrigger.Builder triggerBuilder = new ProfilingTrigger.Builder( ProfilingTrigger.TRIGGER_TYPE_ANR); triggers.add(triggerBuilder.build()); Executor callbackExecutor = Executors.newSingleThreadExecutor(); Consumer<ProfilingResult> resultCallback = profilingResult -> { // Handle uploading trace to your back-end }; profilingManager.registerForAllProfilingResults(callbackExecutor, resultCallback); profilingManager.addProfilingTriggers(triggers); }
Après avoir capturé et importé une trace ANR, vous pouvez l'inspecter manuellement dans l'UI Perfetto en suivant les étapes ci-dessous, ou automatiser l'analyse de l'ANR avec un agent IA.
Analyser la trace
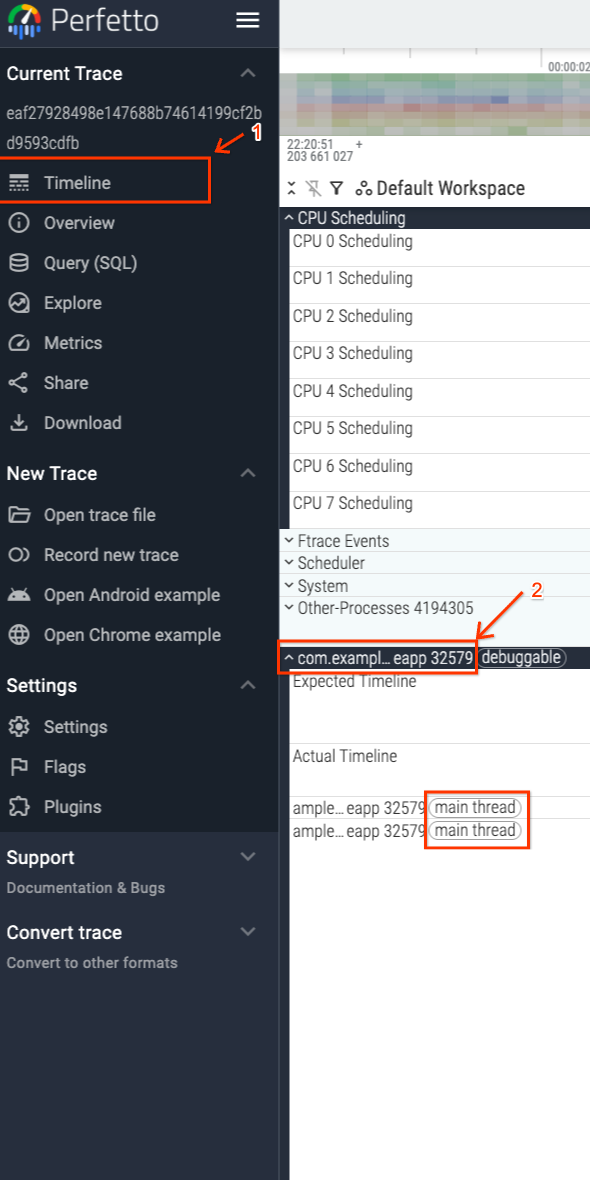
Comme l'erreur ANR a déclenché la trace, vous savez que celle-ci s'est terminée lorsque le système a détecté un manque de réactivité dans le thread principal de votre application (ou lorsqu'un autre délai avant expiration s'est écoulé). La figure 1 montre comment accéder au thread principal de votre application, qui est tagué en conséquence dans l'UI.
La fin de la trace correspond au code temporel de l'ANR, comme illustré dans la figure 2.
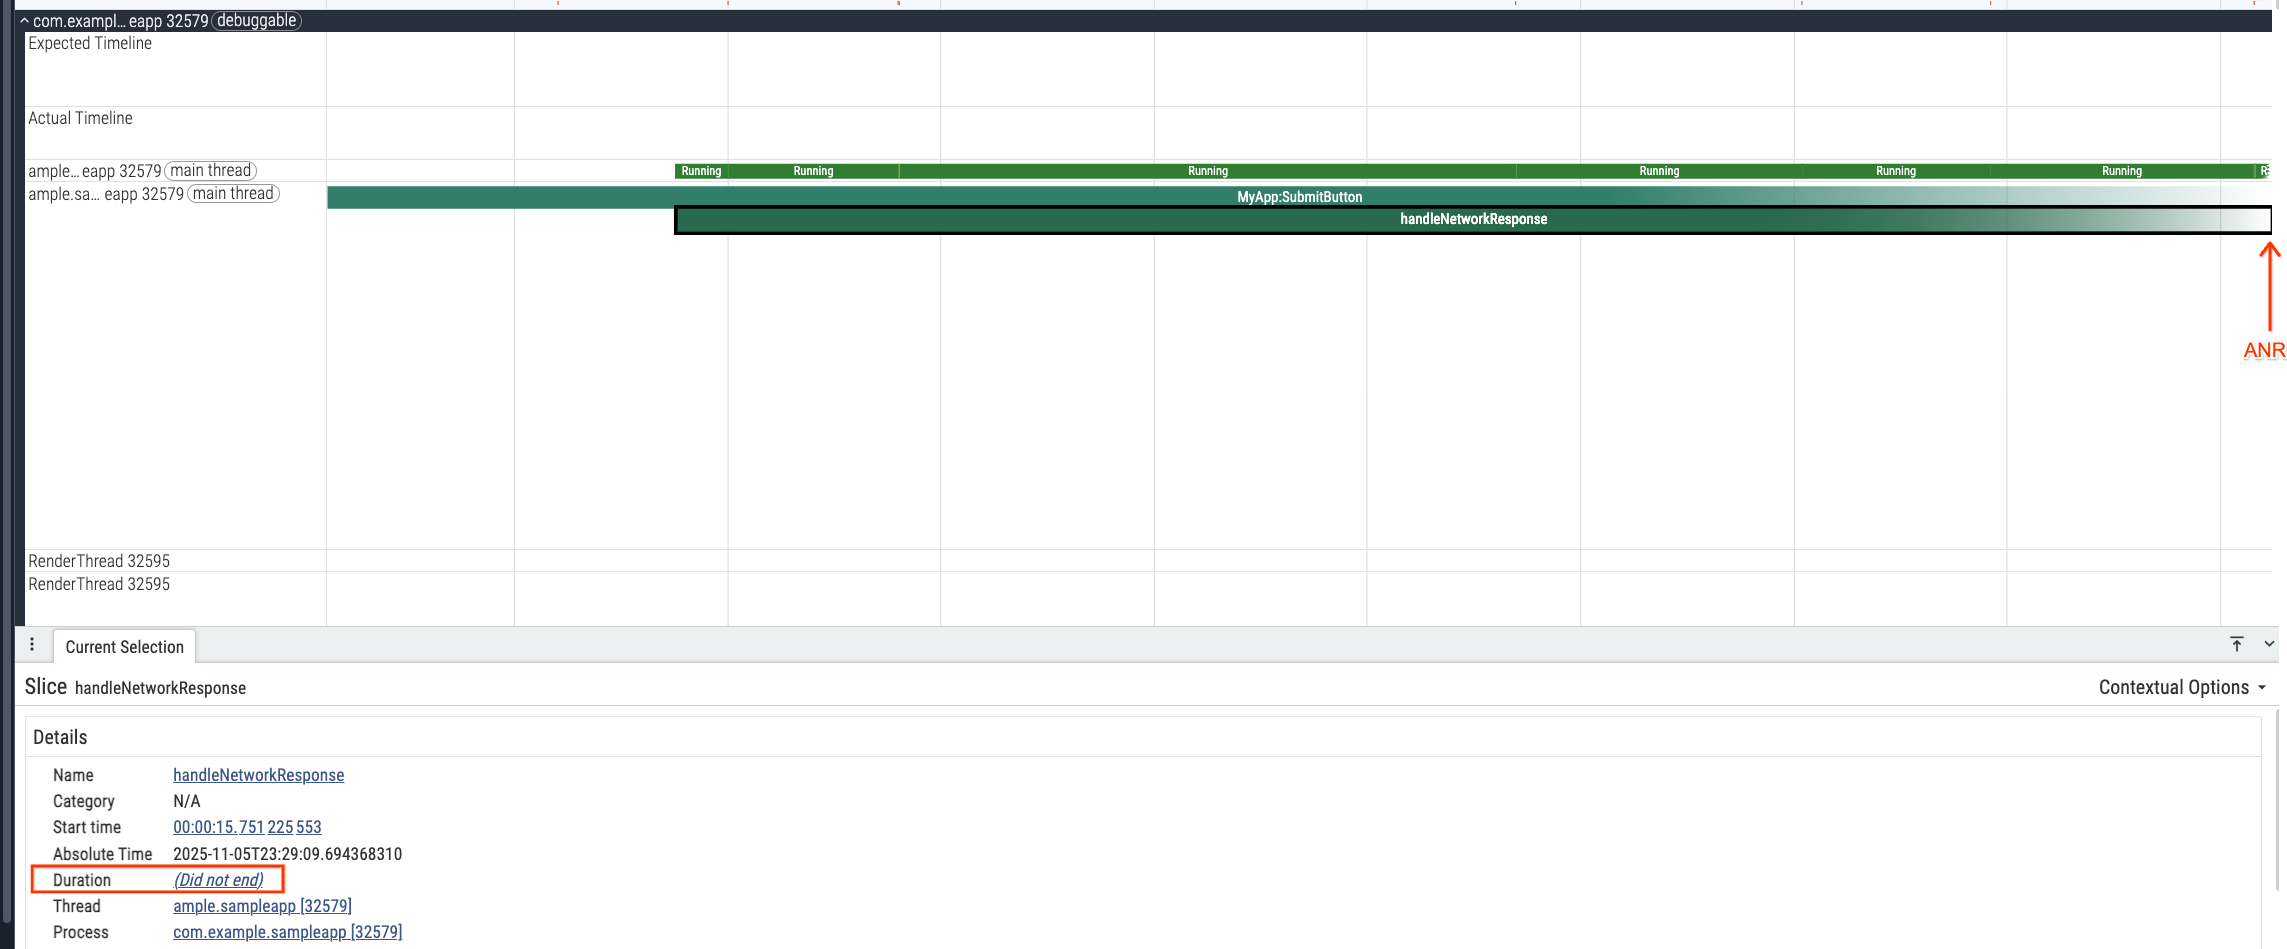
Lorsque l'ANR s'est produite, le thread principal exécutait la tranche handleNetworkResponse dans MyApp:SubmitButton, ce qui a consommé 1,48 seconde de temps CPU (figure 3).

Se fier uniquement à un vidage de pile effectué au moment de l'ANR peut attribuer à tort le blocage entièrement à handleNetworkResponse. Cependant, 1, 48 seconde ne suffit pas à déclencher une erreur ANR.Vous devez donc inspecter ce qui a bloqué le thread principal plus tôt.
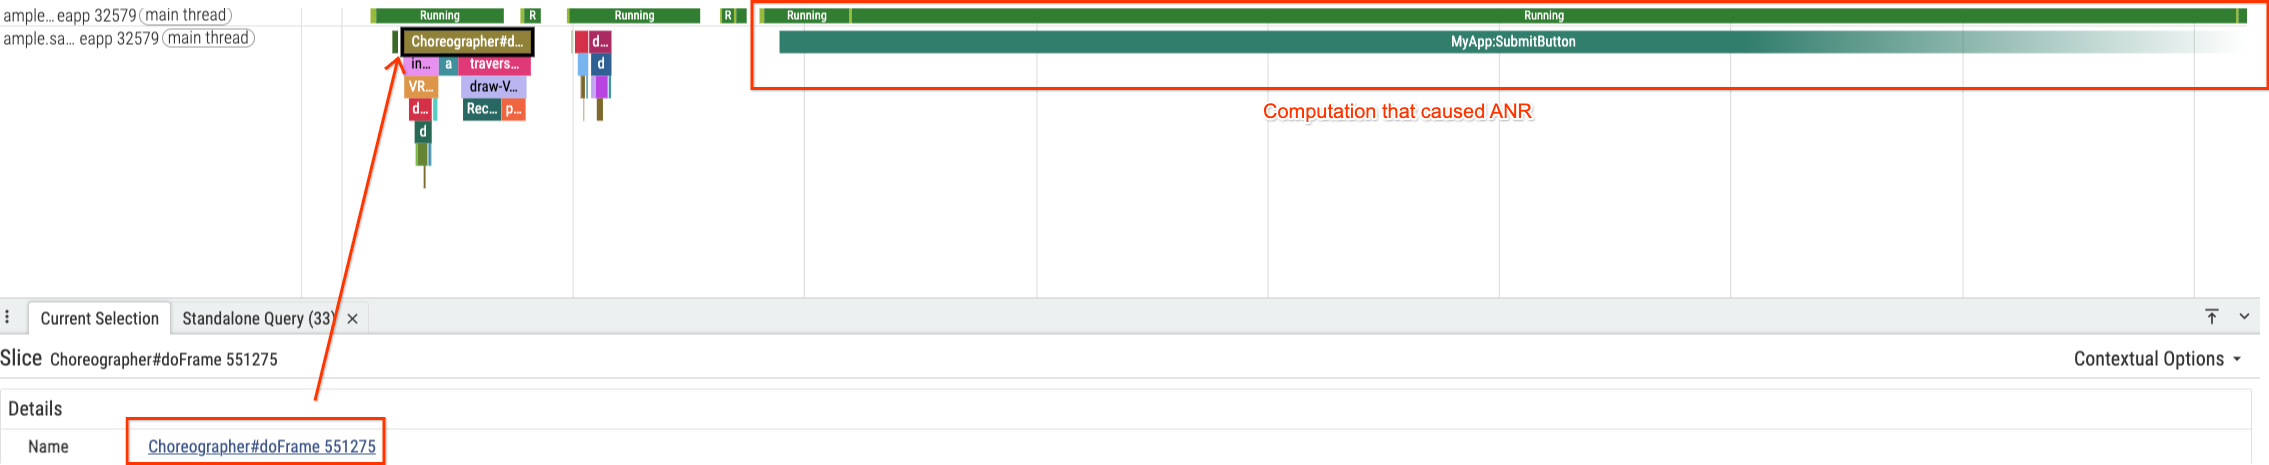
Commencez par localiser la dernière frame d'UI affichée avant le blocage (Choreographer#doFrame 551275), qui précède immédiatement la section MyApp:SubmitButton (figure 4).
Pour comprendre le blocage, effectuez un zoom arrière afin d'inspecter l'intégralité de la tranche MyApp:SubmitButton. Vous remarquerez un détail important dans les états du thread pour la plage sélectionnée manuellement dans la figure 5 : le thread a passé environ 75 % du temps (6,7 secondes) dans l'état Sleeping et seulement 24 % du temps dans l'état Running.
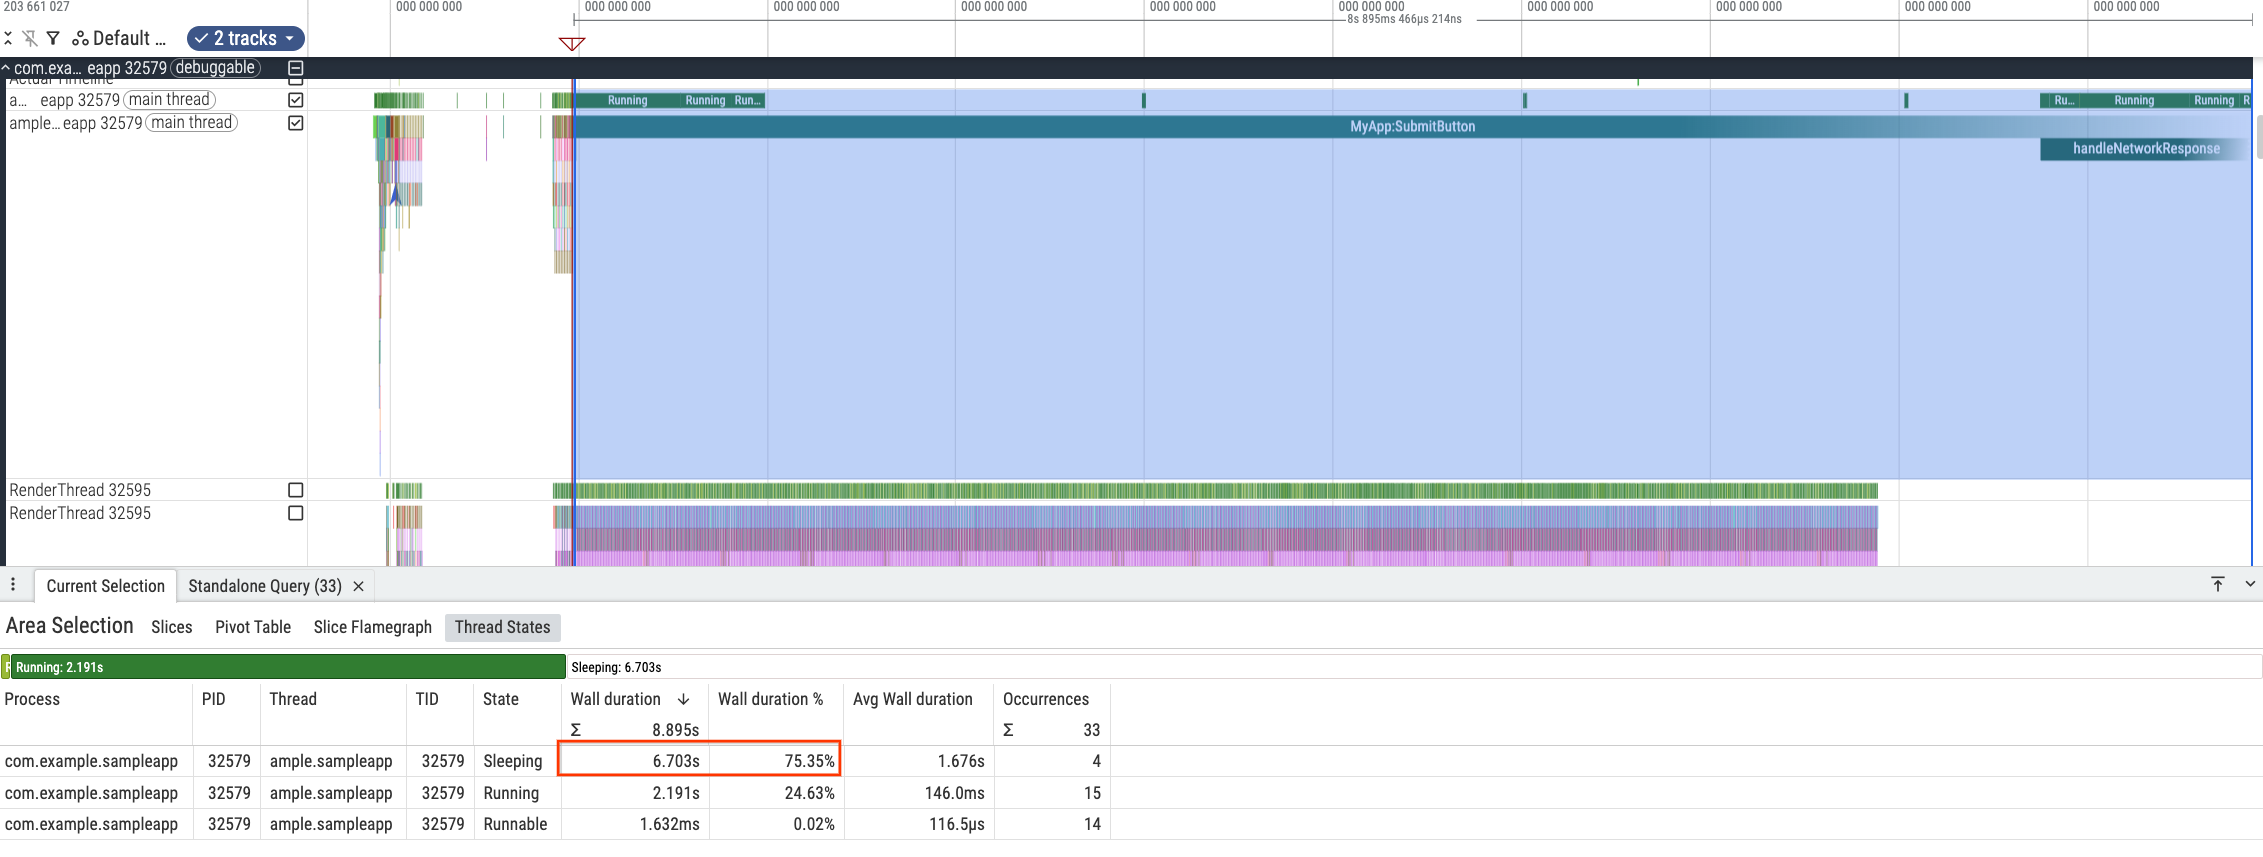
MyApp:SubmitButton.Cela indique que la cause principale de l'ANR était l'attente, et non le calcul. Examinez les différentes occurrences de sommeil pour identifier une tendance.

MyApp:SubmitButton.
MyApp:SubmitButton.
MyApp:SubmitButton.
MyApp:SubmitButton.Les trois premiers intervalles de veille (figures 6 à 8) durent environ deux secondes chacun, et le quatrième (figure 9) dure 0,7 seconde. Des pauses répétées de deux secondes suggèrent fortement un délai avant expiration programmé qui a été relancé trois fois avant de réussir à la quatrième tentative, accumulant ainsi un délai suffisant pour déclencher une ANR (figure 10).
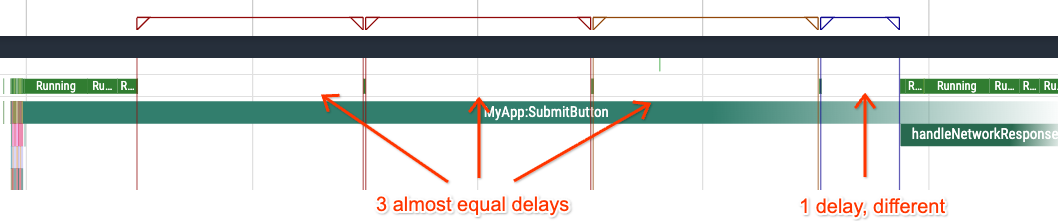
MyApp:SubmitButton.Identifier la cause principale dans le code
Pour vérifier cette hypothèse, inspectez le code associé à la section de trace MyApp:SubmitButton :
Kotlin
fun setupButtonCallback() { findViewById<View>(R.id.submit).setOnClickListener { trace("MyApp:SubmitButton") { onClickSubmit() } } } fun onClickSubmit() { prepareNetworkRequest() var networkRequestSuccess = false var maxAttempts = 10 while (!networkRequestSuccess && maxAttempts > 0) { networkRequestSuccess = performNetworkRequest(NETWORK_TIMEOUT_MILLISECS) maxAttempts-- } if (networkRequestSuccess) { handleNetworkResponse() } } fun performNetworkRequest(timeoutMilliseconds: Int): Boolean { // ... } fun prepareNetworkRequest() { // ... } fun handleNetworkResponse() { trace("handleNetworkResponse") { // ... } } companion object { private const val NETWORK_TIMEOUT_MILLISECS = 2000 }
Java
private static final int NETWORK_TIMEOUT_MILLISECS = 2000; public void setupButtonCallback() { findViewById(R.id.submit).setOnClickListener(submitButtonView -> { Trace.beginSection("MyApp:SubmitButton"); onClickSubmit(); Trace.endSection(); }); } public void onClickSubmit() { prepareNetworkRequest(); boolean networkRequestSuccess = false; int maxAttempts = 10; while (!networkRequestSuccess && maxAttempts > 0) { networkRequestSuccess = performNetworkRequest(NETWORK_TIMEOUT_MILLISECS); maxAttempts--; } if (networkRequestSuccess) { handleNetworkResponse(); } } boolean performNetworkRequest(int timeoutMiliseconds) { // ... } void prepareNetworkRequest() { // ... } public void handleNetworkResponse() { Trace.beginSection("handleNetworkResponse"); // ... Trace.endSection(); }
Le code confirme cette hypothèse. La méthode onClickSubmit exécute une requête réseau sur le thread UI avec un NETWORK_TIMEOUT_MILLISECS codé en dur de 2 000 ms.
Il est important de noter qu'il s'exécute dans une boucle while qui effectue jusqu'à 10 tentatives.
Dans cette trace spécifique, l'utilisateur avait probablement une mauvaise connectivité réseau. Les trois premières tentatives ont échoué, ce qui a entraîné trois délais avant expiration de deux secondes (soit un total de six secondes).
La quatrième tentative a réussi après 0,7 seconde, ce qui a permis au code de passer à handleNetworkResponse. Toutefois, le temps d'attente cumulé a déjà déclenché l'ANR.
Corriger l'ANR
Pour éviter ce type d'ANR, déplacez les opérations liées au réseau qui ont des latences variables vers un thread d'arrière-plan au lieu de les exécuter sur le thread principal. Cela permet à l'UI de rester réactive même en cas de mauvaise connectivité, ce qui élimine cette classe d'ANR.
Automatiser l'analyse des ANR avec un agent IA
Au lieu d'inspecter manuellement les chronologies et les intervalles de veille dans l'UI Perfetto, vous pouvez utiliser un agent de codage IA configuré avec la compétence IA Perfetto pour interroger la trace ANR et la mettre en corrélation avec votre codebase :
Analyze the Perfetto system trace at </path/to/trace.perfetto-trace>, which
corresponds to an ANR trace, and find the root cause of the ANR using the
Perfetto AI skill. The codebase is located at </path/to/codebase>.
L'agent interroge la trace avec trace_processor et arrive à la même conclusion que l'investigation manuelle, sans être induit en erreur par la tranche handleNetworkResponse non terminée à la fin de la trace. Il identifie que MyApp:SubmitButton a bloqué le thread principal pendant plus de 9,2 secondes, reconstruit les trois délais d'expiration du réseau de deux secondes et la quatrième tentative de 0,7 seconde dans performNetworkRequest, ainsi que les boucles d'attente active du processeur dans prepareNetworkRequest et handleNetworkResponse, et mappe chaque phase à ProfilingManagerJavaSnippets.java avec une recommandation de déplacer onClickSubmit hors du thread UI :
# Perfetto ANR Root-Cause Analysis Report

* **Source Code:** `ProfilingManagerJavaSnippets.java`
* **Target Process:** `com.example.sampleapp` (`pid = 32579`, `upid = 27`)
* **Blocked Thread:** Main UI thread `ample.sampleapp` (`tid = 32579`, `utid = 760`)
* **Collection Mechanism:** Android `ProfilingManager` (`ProfilingTrigger.TRIGGER_TYPE_ANR`)

---

## 1. Executive Summary

> **Important:** The ANR in `com.example.sampleapp` is caused by executing **synchronous, blocking network retry logic (`Thread.sleep`) and heavy CPU busy-wait loops (`cpuIntensiveComputation`) directly on the main UI thread** inside the submit button click listener (`MyApp:SubmitButton` -> `onClickSubmit()`).

When the user taps the submit button at `7,967.78 ms` into the trace (`ts = 80459171444519`), the main UI thread is blocked continuously for **more than `9,281.30 ms`** (still unfinished when the trace ends at `17,249.08 ms`):

1. **`prepareNetworkRequest()`** runs a CPU busy-wait loop on the main thread for **`~1,019 ms`**.
2. **`performNetworkRequest(2000)`** executes in a synchronous `while` retry loop on the main thread. Each attempt begins with **`20 ms`** of CPU busy-waiting followed by a `Thread.sleep()`. The request times out (`2,000 ms` sleep) **3 times in a row** and succeeds on the **4th attempt** (`~701 ms` sleep), blocking the main thread for **`~6,764 ms`** across the 4 attempts (`6,703.18 ms` sleeping + `~60 ms` CPU).
3. **`handleNetworkResponse()`** begins at **`+7,783.44 ms`** after the button click and runs another `2,000 ms` CPU busy-wait loop on the main thread (`1,497.86 ms` captured before the trace ends).

    [Touch UP & Click (t = +0 ms)]
      -> prepareNetworkRequest() (~1,000 ms CPU Busy-Wait)
      -> Attempt #1 (Timeout: 20 ms CPU + 2,001 ms Sleep)
      -> Attempt #2 (Timeout: 20 ms CPU + 2,001 ms Sleep)
      -> Attempt #3 (Timeout: 20 ms CPU + 2,001 ms Sleep, crosses 5s ANR threshold)
      -> Attempt #4 (Success: 20 ms CPU + 701 ms Sleep)
      -> handleNetworkResponse() (1,498 ms CPU, unfinished at trace end)
## 2. PerfettoSQL Trace Analysis

### 2.1 Open Main-Thread Slices at Trace End

Querying `thread_or_process_slice` on the main thread (`utid = 760`) around and after the touch event shows that `MyApp:SubmitButton` and its nested slice `handleNetworkResponse` both have `dur = -1` (still open when the trace completed):

```sql
INCLUDE PERFETTO MODULE slices.with_context;

SELECT
  id,
  ts,
  (ts - trace_start()) / 1e6 AS rel_ts_ms,
  dur,
  IIF(dur = -1, trace_end() - ts, dur) / 1e6 AS effective_dur_ms,
  depth,
  name
FROM thread_or_process_slice
WHERE utid = 760 AND ts >= 80459169800000
ORDER BY ts;
```

| Slice ID | Slice Name | Start (`ts` ns) | Offset from Trace Start | Raw `dur` | Effective Duration (to trace end) | Depth |
| :--- | :--- | :--- | :--- | :--- | :--- | :--- |
| `40070` | `dispatchInputEvent MotionEvent UP` | `80459169801575` | `7,966.14 ms` | `190,633 ns` | `0.19 ms` | `0` |
| `40156` | **`MyApp:SubmitButton`** | `80459171444519` | `7,967.78 ms` | `-1` | **`9,281.30 ms`** | `0` |
| `97500` | **`handleNetworkResponse`** | `80466954886580` | `15,751.23 ms` | `-1` | **`1,497.86 ms`** | `1` |

---

### 2.2 Aggregate Main-Thread State (`thread_state`) During `MyApp:SubmitButton`

Aggregating `thread_state` for `utid = 760` from the start of `MyApp:SubmitButton` (`ts >= 80459171444519`) to the end of the trace reveals that the main thread spent **72.3%** of the time sleeping (`S`) and **27.6%** actively spinning on CPU (`Running`):

```sql
SELECT
  state,
  COUNT(*) AS cnt,
  SUM(dur) / 1e6 AS total_dur_ms,
  MIN(dur) / 1e6 AS min_dur_ms,
  MAX(dur) / 1e6 AS max_dur_ms
FROM thread_state
WHERE utid = 760 AND ts >= 80459171444519
GROUP BY state
ORDER BY total_dur_ms DESC;
```

| Thread State | Interval Count | Total Duration | Min Duration | Max Duration | Cause in Code |
| :--- | :--- | :--- | :--- | :--- | :--- |
| **`S` (Sleeping)** | `4` | **`6,703.18 ms`** | `700.78 ms` | `2,000.82 ms` | 4 `Thread.sleep()` calls in `performNetworkRequest()` |
| **`Running` (On CPU)** | `20` | **`2,559.81 ms`** | `0.00 ms` | `578.77 ms` | Busy-wait `while` loops in `cpuIntensiveComputation()` |
| **`R` (Runnable)** | `20` | **`2.11 ms`** | `0.01 ms` | `1.21 ms` | Scheduler wakeups and brief preemptions |

---

### 2.3 Phase-by-Phase Reconstruction (`thread_state` Intervals)

Querying individual `thread_state` intervals (`dur > 2 ms`) shows the exact sequence of CPU bursts and sleeps on the main thread:

```sql
SELECT
  ts,
  (ts - 80459171444519) / 1e6 AS ms_since_submit,
  dur / 1e6 AS dur_ms,
  state
FROM thread_state
WHERE utid = 760 AND ts >= 80459171444519 AND dur > 2e6
ORDER BY ts;
```

| Phase | Offset from Submit (`ms_since_submit`) | State | Duration (`dur_ms`) | Corresponding Code Execution |
| :--- | :--- | :--- | :--- | :--- |
| **1. Request Prep + Attempt #1 CPU** | `+0.63 ms` -> `+1,019.36 ms` | `Running` | **`1,018.68 ms`** *(across 5 slices)* | `prepareNetworkRequest()` (`1,000 ms` CPU) + Attempt #1 `cpuIntensiveComputation(20)` |
| **2. Network Attempt #1 (Timeout)** | `+1,019.36 ms` -> `+3,020.18 ms` | `S` (Sleep) | **`2,000.82 ms`** | `performNetworkRequest(2000)` -> `Thread.sleep(2000)` (`return false`) |
| **3. Network Attempt #2 (CPU)** | `+3,020.23 ms` -> `+3,040.24 ms` | `Running` | **`20.00 ms`** | Attempt #2 `cpuIntensiveComputation(20)` |
| **4. Network Attempt #2 (Timeout)** | `+3,040.24 ms` -> `+5,041.01 ms` | `S` (Sleep) | **`2,000.78 ms`** | `performNetworkRequest(2000)` -> `Thread.sleep(2000)` (`return false`) -- **5s input ANR threshold crossed** |
| **5. Network Attempt #3 (CPU)** | `+5,041.06 ms` -> `+5,061.30 ms` | `Running` | **`20.11 ms`** *(8.05 + 7.93 + 4.14 ms)* | Attempt #3 `cpuIntensiveComputation(20)` |
| **6. Network Attempt #3 (Timeout)** | `+5,061.30 ms` -> `+7,062.09 ms` | `S` (Sleep) | **`2,000.80 ms`** | `performNetworkRequest(2000)` -> `Thread.sleep(2000)` (`return false`) |
| **7. Network Attempt #4 (CPU)** | `+7,062.15 ms` -> `+7,082.38 ms` | `Running` | **`20.22 ms`** | Attempt #4 `cpuIntensiveComputation(20)` |
| **8. Network Attempt #4 (Success)** | `+7,082.38 ms` -> `+7,783.16 ms` | `S` (Sleep) | **`700.78 ms`** | `performNetworkRequest(2000)` hits `Math.random() < 0.2`, sleeps `~700 ms`, `return true` |
| **9. Handle Response (CPU)** | `+7,783.21 ms` -> `+9,281.30 ms` | `Running` | **`1,479.68 ms`** *(across 6 slices)* | `handleNetworkResponse()` (`Trace.beginSection("handleNetworkResponse")` at `+7,783.44 ms`) runs `cpuIntensiveComputation(2000)` until trace ends |

---

## 3. Code Mapping (`ProfilingManagerJavaSnippets.java`)

In `ProfilingManagerJavaSnippets.java` (lines `38` and `158-221`), the `OnClickListener` for `R.id.submit` runs `onClickSubmit()` directly on the main UI thread:

```java
private static final int NETWORK_TIMEOUT_MILLISECS = 2000;

public void setupButtonCallback() {
  findViewById(R.id.submit).setOnClickListener(submitButtonView -> {
    Trace.beginSection("MyApp:SubmitButton");
    onClickSubmit();
    Trace.endSection();
  });
}

public void onClickSubmit() {
  // 1. Blocks main thread on CPU for 1,000 ms
  prepareNetworkRequest();

  // 2. Synchronous retry loop on main thread (up to 10 attempts * 2,020 ms = 20.2 seconds!)
  boolean networkRequestSuccess = false;
  int maxAttempts = 10;
  while (!networkRequestSuccess && maxAttempts > 0) {
    networkRequestSuccess = performNetworkRequest(NETWORK_TIMEOUT_MILLISECS);
    maxAttempts--;
  }

  // 3. Blocks main thread on CPU for another 2,000 ms
  if (networkRequestSuccess) {
    handleNetworkResponse();
  }
}

boolean performNetworkRequest(int timeoutMilliseconds) {
  cpuIntensiveComputation(20);
  try {
    if (Math.random() < 0.2) {
      // Simulate performing a network request by waiting a random period of time
      int networkRequestTimeMs = (int) (Math.random() * timeoutMilliseconds);
      Thread.sleep(networkRequestTimeMs);
      return true;
    } else {
      // Simulate a timeout
      Thread.sleep(timeoutMilliseconds);
    }
  } catch (InterruptedException e) {
  }
  return false;
}

void cpuIntensiveComputation(int durationMs) {
  long start = System.currentTimeMillis();
  while (System.currentTimeMillis() - start < durationMs) {
  }
}

void prepareNetworkRequest() {
  cpuIntensiveComputation(1000);
}

public void handleNetworkResponse() {
  Trace.beginSection("handleNetworkResponse");
  cpuIntensiveComputation(2000);
  Trace.endSection();
}
```

---

## 4. Recommended Remediation

> **Tip:** Never perform network I/O, `Thread.sleep()`, or multi-hundred-millisecond CPU computations on the Android main UI thread.

1. **Offload `onClickSubmit()` to a Background Thread / Coroutine:**
   * In Java, dispatch `prepareNetworkRequest()`, the `performNetworkRequest()` retry loop, and heavy response processing in `handleNetworkResponse()` to a background `ExecutorService` (e.g., `Executors.newSingleThreadExecutor()`), then marshal only lightweight UI updates back to the main thread via `runOnUiThread(...)` or `View.post(...)`.
   * In Kotlin, use `lifecycleScope.launch(Dispatchers.IO)` (for network waiting) and `withContext(Dispatchers.Default)` (for CPU-intensive preparation/parsing).
2. **Use Non-Blocking / Asynchronous Retries with Backoff:**
   * Avoid holding threads with `Thread.sleep()` inside tight retry loops; use asynchronous HTTP client timeouts/retries or `WorkManager` for deferrable background network tasks.