
Users expect apps to load fast and be responsive. An app with a slow start time doesn't meet this expectation and can disappoint users. This sort of poor experience can cause a user to rate your app poorly on the Play store or even abandon your app altogether.
This page provides information to help optimize your app's launch time, including an overview of the internals of the launch process, how to profile startup performance, and some common start-time issues with tips on how to address them.
Understand the different app startup states
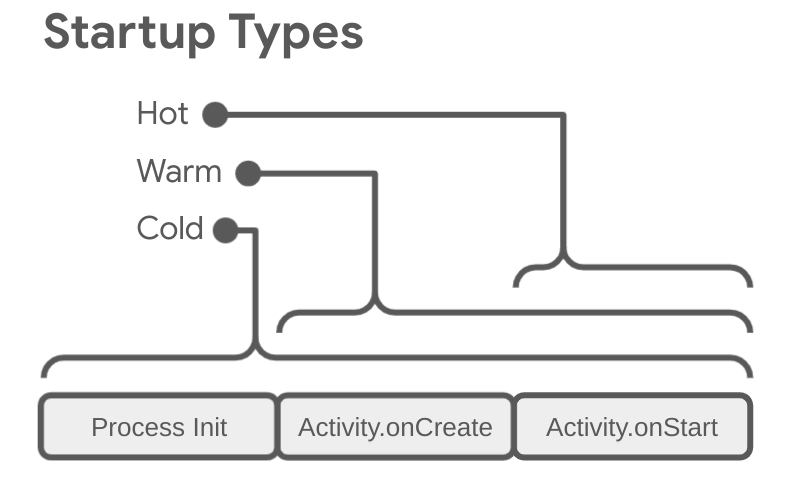
App launch can take place in one of three states: cold start, warm start, or hot start. Each state affects how long it takes for your app to become visible to the user. In a cold start, your app starts from scratch. In the other states, the system needs to bring the running app from the background to the foreground.
We recommend that you always optimize based on an assumption of a cold start. Doing so can improve the performance of warm and hot starts as well.
To optimize your app for fast startup, it's useful to understand what's happening at the system and app levels and how they interact in each of these states.
Two important metrics for determining app startup are time to initial display (TTID) and time to full display (TTFD). TTID is the time it takes to display the first frame, and TTFD is the time it takes for the app to become fully interactive. Both are equally important, because TTID lets the user know that the app is loading, and TTFD is when the app is actually usable. If either of these is too long, the user might exit your app before it even fully loads.
Cold start
A cold start refers to an app's starting from scratch. This means that until this start, the system's process creates the app's process. Cold starts happen in cases such as your app launching for the first time since the device booted or since the system killed the app.
This type of start presents the greatest challenge to minimizing startup time, because the system and app have more work to do than in the other launch states.
At the beginning of a cold start, the system has the three following tasks:
- Load and launch the app.
- Display a blank starting window for the app immediately after launch.
- Create the app process.
As soon as the system creates the app process, the app process is responsible for the next stages:
- Create the app object.
- Launch the main thread.
- Create the main activity.
- Initialize the UI.
- Draw the UI on the screen.
When the app process completes the first draw, the system process swaps out the displayed background window, replacing it with the main activity. At this point, the user can start using the app.
For more information about layout phases in Compose, see Jetpack Compose phases.
Performance issues can arise during creation of the app and creation of the host activity.
App creation
When your app launches, the blank starting window remains on the screen until the system finishes drawing the app for the first time. At this point, the system process swaps the starting window for your app, letting the user interact with the app.
If you override Application.onCreate in your own app, the system
invokes the onCreate method on your app object. Afterwards, the app spawns
the main thread, also known as the UI thread, and tasks it with creating your
app's host activity.
From this point, system- and app-level processes proceed in accordance with the app lifecycle stages.
Activity creation
After the app process creates your activity, the activity performs the following operations:
- Initializes values.
- Calls constructors.
- Calls the callback method, such as
Activity.onCreate, appropriate to the current lifecycle state of the activity.
Typically, the onCreate method has the greatest impact on load time. In
a Jetpack Compose app, the onCreate method's overhead often comes from the
initial composition. This happens when your app calls setContent and
invokes your top-level composables. A deep or complex UI hierarchy, or
composables that perform heavy calculations on the main thread, can increase
this composition time.
Warm start
A warm start encompasses a subset of the operations that take place during a cold start. At the same time, it represents more overhead than a hot start. There are many potential states that can be considered warm starts, such as the following:
The user backs out of your app but then relaunches it. The process might continue to run, but the app must recreate the activity from scratch using a call to
onCreate.The system evicts your app from memory and then the user relaunches it. The process and the activity need to restart, but the task can benefit somewhat from the saved instance state bundle passed into
onCreate.
Hot start
A hot start of your app has lower overhead than a cold start. In a hot start, the system brings your app's host activity to the foreground. If all of your app's UI is still resident in memory, then the app can avoid repeating object initialization, UI initialization, and rendering.
However, if some memory is purged in response to memory trimming events, such as
onTrimMemory, then these objects need to be recreated in response to
the hot start event.
A hot start displays the same on-screen behavior as a cold start scenario. The system process displays a blank screen until the app finishes rendering the activity.
How to identify app startup in Perfetto
To debug app startup issues, it's helpful to determine what exactly is included in the app startup phase. To identify the entire app startup phase in Perfetto, follow these steps:
In Perfetto, find the row with the Android App Startups derived metric. If you don't see it, try capturing a trace using the on-device system tracing app.
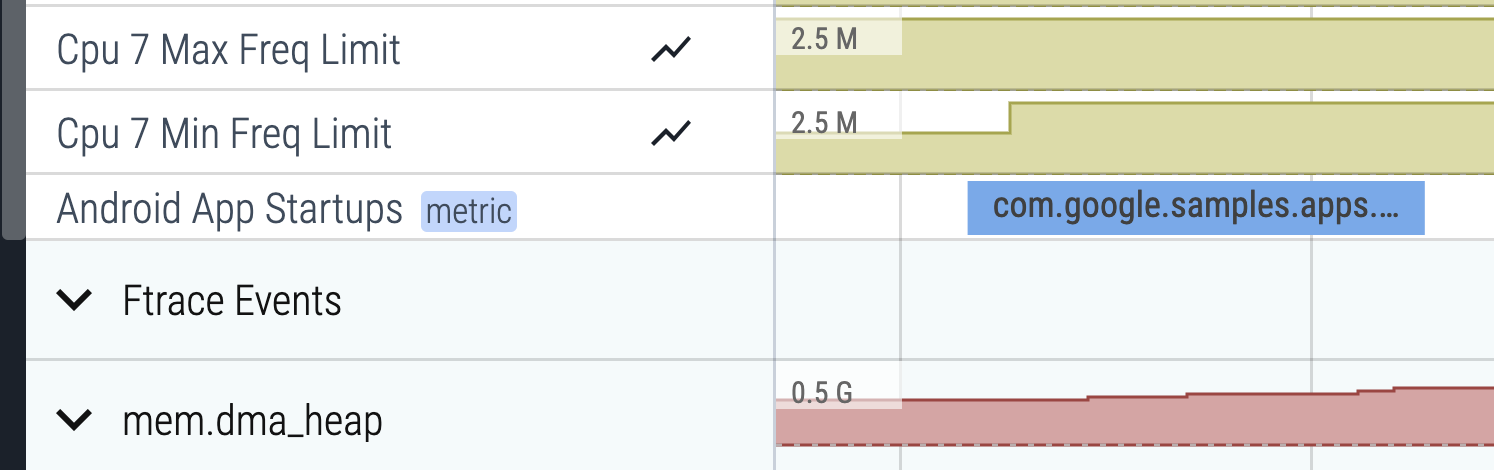
Figure 2. The Android App Startups derived metric slice in Perfetto. Click the associated slice and press m to select the slice. Brackets appear around the slice and denote how long it took. The duration is also shown in the Current selection tab.
Pin the Android App Startups row by clicking on the pin icon, which is visible when you hold the pointer over the row.
Scroll to the row with the app in question and click the first cell to expand the row.
Zoom into the main thread, usually at the top, by pressing w (press s, a, d to zoom out, move left, and move right, respectively).

Figure 3. The Android App Startups derived metric slice next to the main thread of the app. The derived metrics slice makes it easier to see what exactly is included in the app startup, so you can continue to debug in more detail.
When analyzing a Jetpack Compose application, you can use
Composition tracing to see granular details about your UI's performance.
Pay special attention to trace sections within the main thread that start with
Choreographer#doFrame. Look for slices like Compose:recompose,
Compose:layout, and Compose:draw. These show you how much time your app
spends composing, measuring and placing, and drawing specific components.
Use metrics to inspect and improve startups
To properly diagnose startup time performance, you can track metrics that show how long it takes your app to start. Android provides several means of showing you that your app has a problem and helps you diagnose it. Android vitals can alert you that a problem is occurring, and diagnostic tools can help you diagnose the problem.
Benefits of utilizing startup metrics
Android uses the time to initial display (TTID) and time to full display (TTFD) metrics to optimize cold and warm app startups. Android Runtime (ART) uses the data from these metrics to efficiently precompile code for optimization of future startups.
Faster startups lead to more sustained user interaction with your app, which reduces instances of early exiting, restarting the instance, or navigating away to a different app.
Android vitals
Android vitals can help improve your app's performance by alerting you on the Play Console when your app's startup times are excessive.
Android vitals considers the following startup times for your app excessive:
- Cold startup takes 5 seconds or longer.
- Warm startup takes 2 seconds or longer.
- Hot startup takes 1.5 seconds or longer.
Android vitals uses the time to initial display (TTID) metric. For information about how Google Play collects Android vitals data, see the Play Console documentation.
Time to initial display
Time to initial display (TTID) is the time it takes to display the first frame
of the app's UI. This metric measures the time it takes for an app to produce
its first frame, including process initialization during a cold start, activity
creation during a cold or warm start, and displaying the first frame. Keeping
your app's TTID low helps improve the user experience by letting users see your
app launch quickly. TTID is reported automatically for every app by the Android
Framework. When optimizing for app startup we recommend implementing
reportFullyDrawn to get information up to TTFD.
TTID is measured as a time value that represents the total elapsed time that includes the following sequence of events:
- Launching the process.
- Initializing the objects.
- Creating and initializing the host activity.
- Initializing the UI.
- Drawing the app for the first time.
Retrieve TTID
To find TTID, search in the Logcat command-line tool for an output line
containing a value called Displayed. This value is the TTID and looks similar
to the following example, in which TTID is 3s534ms:
ActivityManager: Displayed com.android.myexample/.StartupTiming: +3s534ms
To find TTID in Android Studio, disable the filters in your Logcat view from the
drop-down filter menu, and then find the Displayed time, as shown in figure 4.
Disabling the filters is necessary because the system server, not the app
itself, serves this log.
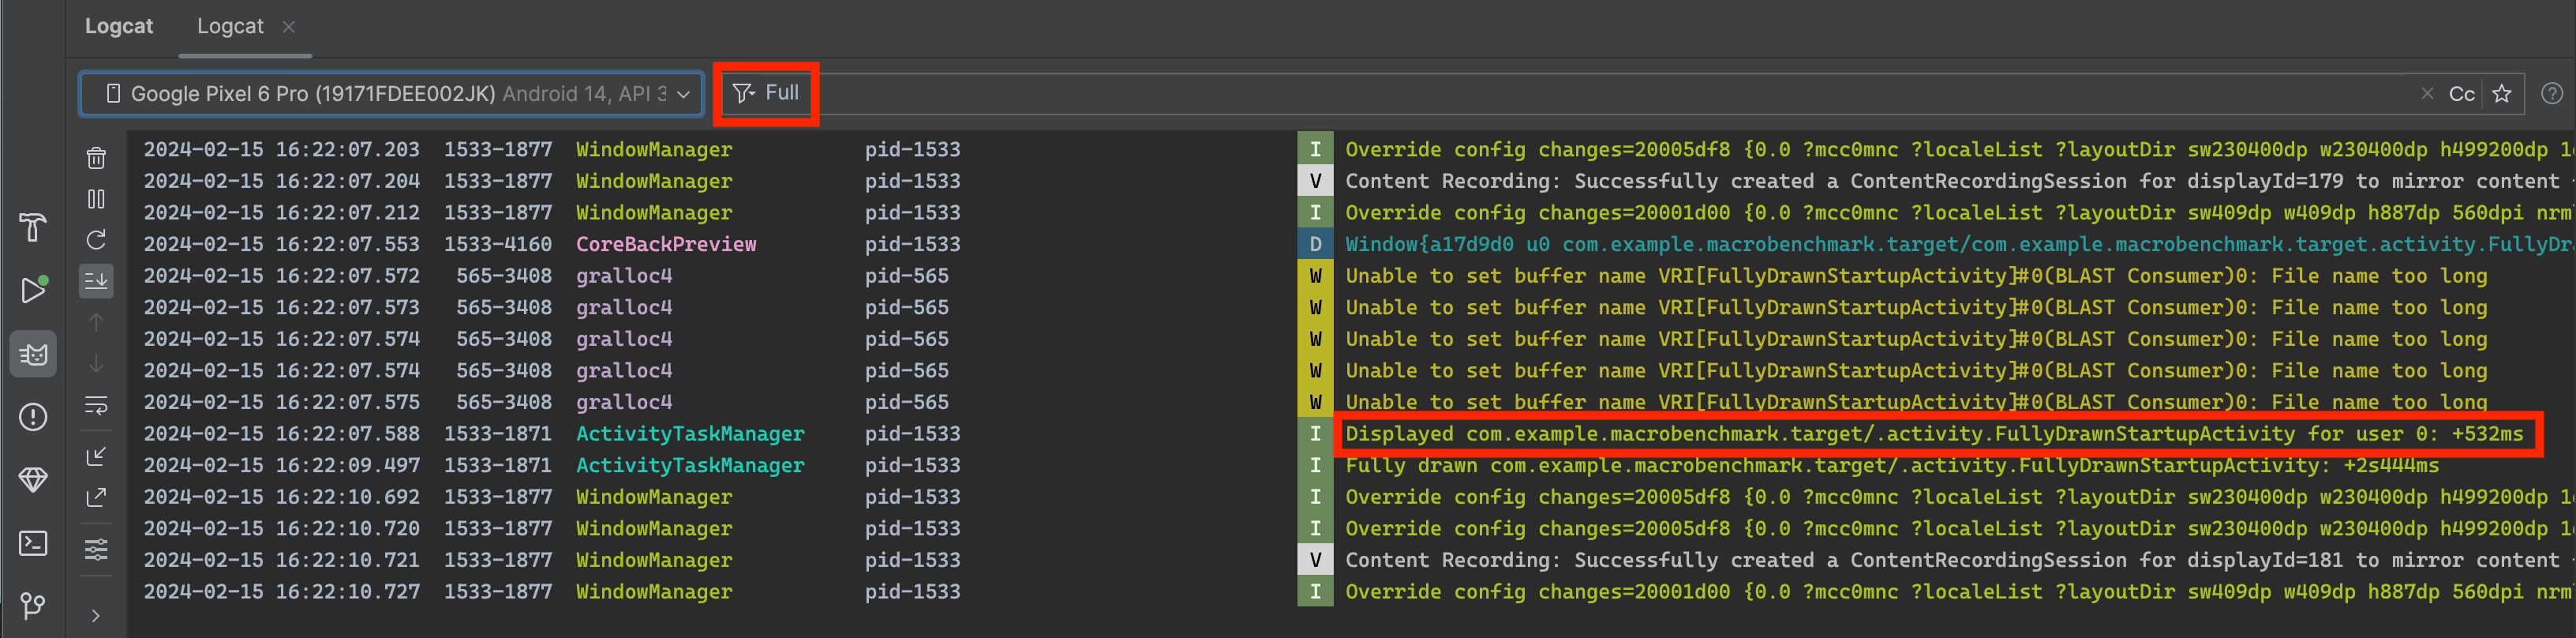
Displayed
value in Logcat.The Displayed metric in the Logcat output doesn't necessarily capture the
amount of time until all resources are loaded and displayed. It leaves out
resources that aren't referenced in the initial composition (like asynchronously
loaded data or images) or resources that the app creates as
part of object initialization. It excludes these resources because loading them
is an inline process and it doesn't block the app's initial display.
For more information on resources, see Resources in Compose.
Sometimes the Displayed line in the Logcat output contains an additional field
for total time, like in the following example:
ActivityManager: Displayed com.android.myexample/.StartupTiming: +3s534ms (total +1m22s643ms)
In this case, the first time measurement is only for the activity that is first
drawn, typically the host activity. The total time measurement begins at the
app process start and can include another activity that is started first but
doesn't display anything to the screen. The total time measurement is shown
only when there is a difference between the single activity and total startup
times.
We recommend using Logcat in Android Studio, but if you're not using Android
Studio, you can also measure TTID by running your app with the adb shell
activity manager command. Here's an example:
adb [-d|-e|-s <serialNumber>] shell am start -S -W
com.example.app/.MainActivity
-c android.intent.category.LAUNCHER
-a android.intent.action.MAIN
The Displayed metric appears in the Logcat output as before. Your terminal
window displays the following:
Starting: Intent
Activity: com.example.app/.MainActivity
ThisTime: 2044
TotalTime: 2044
WaitTime: 2054
Complete
The -c and -a arguments are optional and let you specify <category>
and <action>.
Time to full display
Time to full display (TTFD) is the time it takes for an app to become interactive for the user. It is reported as the time it takes to display the first frame of the app's UI, as well as the content that loads asynchronously after the initial frame is displayed. Generally, this is primary content loaded from the network or disk, as reported by the app. In other words, TTFD includes TTID as well as the time it takes for the app to be usable. Keeping your app's TTFD low helps improve the user experience by letting users interact with your app quickly.
Although the system can determine TTID when the host window renders its initial frame, it can't automatically determine TTFD. Because apps often load their primary content asynchronously, the system doesn't know when the app is actually fully usable to the user. To determine TTFD, the app needs to signal to the system when it reaches the fully drawn state.
Retrieve TTFD
To find TTFD, signal the fully drawn state by calling the
reportFullyDrawn method of the ComponentActivity. The
reportFullyDrawn method reports when the app is fully drawn and in a usable
state. The TTFD is the time elapsed from when the system receives the app launch
intent to when reportFullyDrawn is called. If you don't call
reportFullyDrawn, no TTFD value is reported.
To measure TTFD, call reportFullyDrawn after you completely draw the UI and
all of the data. Don't call reportFullyDrawn before the first activity's
window is first drawn and displayed as measured by the system, because then the
system reports the system-measured time. In other words, if you call
reportFullyDrawn before the system detects TTID, the system reports both
TTID and TTFD as the same value, and this value is the TTID value.
When you use reportFullyDrawn, Logcat displays an output like the following
example, in which the TTFD is 1s54ms:
system_process I/ActivityManager: Fully drawn {package}/.MainActivity: +1s54ms
The Logcat output sometimes includes a total time, as discussed in Time to
initial display.
If your display times are slower than you want, you can try to identify the bottlenecks in the startup process.
You can use reportFullyDrawn to signal the fully drawn state in basic cases
where you're aware that the fully drawn state is achieved. However, in cases
where background threads must complete background work before the fully drawn
state is achieved, you need to delay reportFullyDrawn for a more accurate
TTFD measurement. To learn how to delay reportFullyDrawn, see the following
section.
Improve startup timing accuracy
If your app is performing lazy loading and the initial display doesn't include
all resources, such as when your app is fetching images from the network, you
might want to delay calling reportFullyDrawn until after your app becomes
usable so that you can include the list population as part of your benchmark
timing.
For example, if the UI contains a dynamic list, such as a LazyColumn or
LazyRow, this might be populated by a background task that completes
after the list is first drawn and, therefore, after the UI is marked as fully
drawn. In such cases, the list population isn't included in the benchmarking.
To include the list population as part of your benchmark timing, get the
FullyDrawnReporter by using fullyDrawnReporter, and add a
reporter to it in your app code. Release the reporter after the background task
finishes populating the list.
FullyDrawnReporter doesn't call the reportFullyDrawn method until all
added reporters are released. By adding a reporter but not releasing it until
the background process completes, you make sure the startup timing data
includes the list population time, without changing the app's behavior for the
user. reportFullyDrawn isn't called until all of the tasks are
completed, regardless of the order.
If your app uses Jetpack Compose, you can use the following APIs to indicate fully drawn state:
ReportDrawn: indicates that your composable is immediately ready for interaction.ReportDrawnWhen: takes a predicate, such aslist.count > 0, to indicate when your composable is ready for interaction.ReportDrawnAfter: takes a suspending method that, once completed, indicates that your composable is ready for interaction.
The following example shows how you can run multiple background tasks concurrently, with each registering its own reporter:
class MainActivity : ComponentActivity() {

    sealed interface ActivityState {
        data object LOADING : ActivityState
        data object LOADED : ActivityState
    }

    override fun onCreate(savedInstanceState: Bundle?) {
        super.onCreate(savedInstanceState)

        setContent {
            var activityState by remember {
                mutableStateOf(ActivityState.LOADING as ActivityState)
            }
            fullyDrawnReporter.addOnReportDrawnListener {
                activityState = ActivityState.LOADED
            }
            ReportFullyDrawnTheme {
                when(activityState) {
                    is ActivityState.LOADING -> {
                        // Display the loading UI.
                    }
                    is ActivityState.LOADED -> {
                        // Display the full UI.
                    }
                }
            }
            SideEffect {
                fullyDrawnReporter.addReporter()
                lifecycleScope.launch(Dispatchers.IO) {
                    // Perform the background operation.
                    fullyDrawnReporter.removeReporter()
                }
                fullyDrawnReporter.addReporter()
                lifecycleScope.launch(Dispatchers.IO) {
                    // Perform the background operation.
                    fullyDrawnReporter.removeReporter()
                }
            }
        }
    }
}
Identify bottlenecks
To look for bottlenecks, you can use the Android Studio CPU Profiler. For more information, see Inspect CPU activity with CPU Profiler.
You can also gain insight into potential bottlenecks through inline tracing
inside of your apps' and activities' onCreate methods. To learn about inline
tracing, see the documentation for the Trace functions and the overview
of system tracing.
Solve common issues
This section discusses several issues that often affect app startup performance. These issues mainly concern initializing app and activity objects, as well as the loading of screens.
Heavy app initialization
Launch performance can suffer when your code overrides the Application object
and executes heavy work or complex logic when initializing that object. Your app
might waste time during startup if your Application subclasses perform
initializations that don't need to be done yet.
Some initializations might be completely unnecessary, such as when initializing state information for the main activity when the app is actually started up in response to an intent. With an intent, the app uses only a subset of the previously initialized state data.
Other challenges during app initialization include garbage collection events that are impactful or numerous, or disk I/O happening concurrently with initialization, which further blocks the initialization process. Garbage collection is especially a consideration with the Dalvik runtime; the Android Runtime (ART) performs garbage collection concurrently, minimizing that operation's impact.
Diagnose the problem
You can use method tracing or inline tracing to try to diagnose the problem.
Method tracing
Running the CPU Profiler reveals that the callApplicationOnCreate
method eventually calls your com.example.customApplication.onCreate method. If
the tool shows that these methods are taking a long time to finish executing,
explore further to see what work is occurring there.
Inline tracing
Use inline tracing to investigate likely culprits, including the following:
- Your app's initial
onCreatefunction. - Any global singleton objects your app initializes.
- Any disk I/O, deserialization, or tight loops that might be occurring during the bottleneck.
Solutions to the problem
Whether the problem lies with unnecessary initializations or with disk I/O, the solution is lazy initialization. In other words, only initialize objects that are immediately needed. Instead of creating global static objects, move to a singleton pattern where the app initializes objects only the first time it needs them.
Also, consider using a dependency injection framework like Hilt that creates objects and dependencies when they are injected for the first time.
If your app uses content providers to initialize app components at startup, consider using the App Startup library instead.
Heavy activity initialization
Activity creation often entails a lot of high-overhead work. Often, there are opportunities to optimize this work to achieve performance improvements. Such common issues include the following:
- Initializing a large or complex UI.
- Heavy initialization in composables.
- Blocking screen drawing on disk, or network I/O.
- Loading and decoding bitmaps.
- Rasterizing
VectorDrawableobjects. - Initialization of other subsystems of the app's host activity.
Diagnose the problem
In this case, as well, both method tracing and inline tracing can be useful.
Method tracing
When using the CPU Profiler, pay attention to your app's Application
subclass constructors and com.example.customApplication.onCreate methods.
If the tool shows that these methods are taking a long time to finish executing, explore further to see what work is occurring there.
Inline tracing
Use inline tracing to investigate likely culprits, including the following:
- Your app's initial
onCreatefunction. - Any global singleton objects it initializes.
- Any disk I/O, deserialization, or tight loops that might be occurring during the bottleneck.
Solutions to the problem
There are many potential bottlenecks, but two common problems and remedies are as follows:
- The larger your UI hierarchy, the more time the app takes to initialize it.
Consider the following steps when addressing this issue:
- Flatten your UI hierarchy by reducing redundant or nested composables.
- Avoid unnecessary composition and recomposition during launch.
- Defer composition of non-critical UI.
- Having all of your resource initialization on the main thread can also slow
down startup. You can address this issue as follows:
- Move all resource initialization so that the app can perform it lazily on a different thread.
- Load and display your UI with placeholder data first, and then later update visual properties that are dependent on bitmaps and other resources.
For more information on recomposition, see Recomposition and Get recomposition counts.
Custom splash screens
You might see extra time added during startup if you previously used one of the following methods to implement a custom splash screen in Android 11 (API level 30) or earlier:
- Using the
windowDisablePreviewtheme attribute to turn off the initial blank screen drawn by the system during launch. - Using a dedicated
Activity.
Starting with Android 12, migrating to the SplashScreen API is required.
This API enables a faster startup time and lets you tweak your splash screen in
the following ways:
- Set a theme to change the splash screen's appearance.
- Control how long the splash screen is displayed with
windowSplashScreenAnimationDuration. - Customize the splash screen animation, and gracefully handle the animation for dismissing the splash screen.
Furthermore, the compat library backports the SplashScreen API to enable
backward-compatibility and to create a consistent look and feel for splash
screen display across all Android versions.
See the Splash screen migration guide for details.
Recommended for you
- Note: link text is displayed when JavaScript is off
- Slow rendering
- Capture Macrobenchmark metrics
- Create Baseline Profiles{:#creating-profile-rules}