
L'affichage de l'interface utilisateur est une action qui consiste à générer une image depuis votre appli et à l'afficher à l'écran. Pour garantir une interaction fluide entre l'utilisateur et votre appli, celle-ci doit afficher des images en moins de 16 ms pour atteindre 60 images par seconde (FPS). Pour comprendre pourquoi il est préférable de définir une fréquence de 60 FPS, visionnez la vidéo Android Performance Patterns: Why 60 FPS? (Pourquoi 60 FPS ?). Si vous essayez d'atteindre 90 FPS, cette fenêtre passe à 11 ms et, pour 120 FPS, elle est de 8 ms.
Si vous dépassez cette fenêtre d'une milliseconde, cela ne signifie pas que l'image s'affiche en retard d'une milliseconde, mais que Choreographer le supprime complètement. Si votre appli souffre d'un rendu de l'interface utilisateur lent, le système est alors obligé d'ignorer des images, et l'utilisateur perçoit le stuttering dans votre appli. C'est ce qu'on appelle les à-coups. Cette page explique comment diagnostiquer et corriger les à-coups.
Si vous développez des jeux qui n'utilisent pas le système View, vous contournez Choreographer. Dans ce cas, la bibliothèque Frame Pacing permet aux jeux OpenGL et Vulkan d'obtenir un rendu fluide et de corriger le frame pacing sur Android.
Pour vous aider à améliorer la qualité de votre appli, Android contrôle automatiquement les à-coups et affiche les informations correspondantes dans le tableau de bord Android Vitals. Pour en savoir plus sur la collecte des données, consultez Contrôler la qualité technique de votre appli avec Android Vitals.
Identifier les à-coups
Il peut être difficile d'identifier le code de votre appli qui provoque un à-coup. Cette section décrit trois méthodes d'identification des à-coups :
L'examen visuel vous permet de parcourir tous les cas d'utilisation de votre appli en quelques minutes, mais il ne fournit pas autant d'informations que Systrace. Systrace fournit plus de détails, mais si vous exécutez Systrace pour tous les cas d'utilisation de votre appli, vous pouvez être inondé de données qu'il peut être difficile d'analyser. L'examen visuel et Systrace détectent les à-coups sur votre appareil local. Si vous ne parvenez pas à reproduire les à-coups sur les appareils locaux, vous pouvez créer un contrôle personnalisé des performances pour mesurer des parties spécifiques de votre appli sur les appareils qui fonctionnent dans le champ.
Examen visuel
L'examen visuel vous aide à identifier les cas d'utilisation qui génèrent des à-coups. Pour effectuer un examen visuel, ouvrez votre appli, parcourez manuellement les différentes parties de votre appli et recherchez les à-coups dans l'interface utilisateur.
Voici quelques conseils pour effectuer des examens visuels :
- Exécutez une version de votre appli (ou au moins une version non débogable). L'environnement d'exécution ART désactive plusieurs optimisations importantes afin d'accepter les fonctionnalités de débogage. Veillez donc à ce que l'écran ressemble à ce que voit l'utilisateur.
- Activez le rendu GPU du profil. Le rendu GPU du profil affiche à l'écran des barres qui vous donnent une représentation visuelle du délai nécessaire pour afficher les images d'une fenêtre d'interface utilisateur par rapport à la fréquence de 16 ms par image. Chaque barre contient des composants colorés qui correspondent à une étape du pipeline de rendu. Vous pouvez ainsi voir quelle étape prend le plus de temps. Par exemple, si l'image met beaucoup de temps à gérer les entrées, vous devez examiner le code de votre appli qui gère les entrées utilisateur.
- Parcourez les composants qui sont des sources courantes d'à-coups, comme
RecyclerView. - Lancez l'appli depuis un démarrage à froid.
- Pour aggraver le problème, exécutez votre appli sur un appareil plus lent.
Une fois que vous aurez identifié les cas d'utilisation qui génèrent un à-coup dans votre appli, cela vous renseignera peut-être sur la cause du problème. Si vous avez besoin d'informations supplémentaires, vous pouvez utiliser Systrace.
Systrace
Bien que Systrace soit un outil qui montre ce que fait l'ensemble de l'appareil, il peut s'avérer utile pour identifier les à-coups dans votre appli. Systrace engendre des frais généraux système minimes. Vous observerez donc des à-coups réalistes lors de l'instrumentation.
Gardez une trace avec Systrace tout en exécutant le cas d'utilisation qui fonctionne mal sur votre appareil. Pour savoir comment utiliser Systrace, consultez Capturer une trace système dans la ligne de commande. Systrace est divisé en processus et en threads. Recherchez le processus de votre appli dans Systrace, qui ressemble à la figure 1.
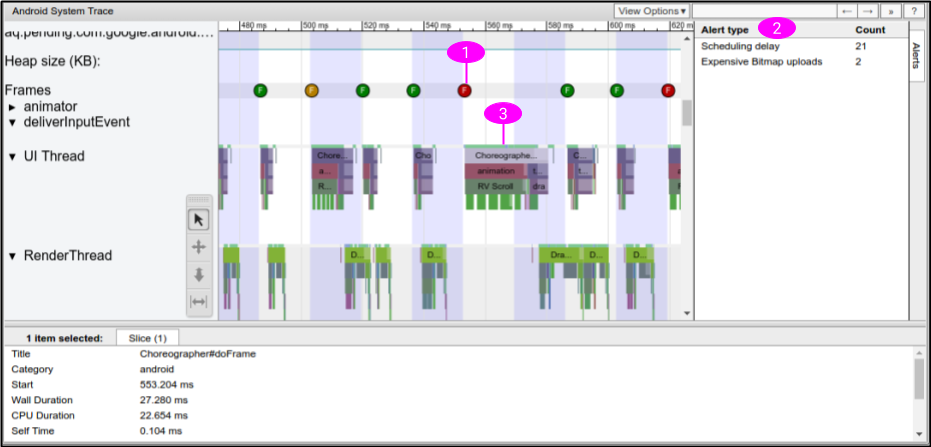
L'outil Systrace de la figure 1 contient les informations suivantes pour identifier les à-coups :
- Systrace affiche le moment où chaque image est dessinée, et associe un code couleur à chaque image pour mettre en évidence les délais d'affichage lents. Cette méthode vous permet de trouver les images qui fonctionnent mal de manière plus précise que via l'examen visuel. Pour en savoir plus, consultez Inspecter les cadres et les alertes d'interface utilisateur.
- Systrace détecte les problèmes dans votre appli et affiche les alertes dans des images séparées et dans le panneau alertes. Nous vous recommandons de suivre les instructions fournies dans l'alerte.
- Certaines parties du framework et des bibliothèques Android telles que
RecyclerViewcontiennent des repères de trace. Ainsi, la chronologie Systrace indique à quel moment ces méthodes sont exécutées sur le thread UI, et le temps nécessaire à leur exécution.
Après avoir examiné la sortie Systrace, il est possible que des méthodes dans votre appli soient à l'origine des à-coups. Par exemple, si la chronologie montre qu'un affichage lent est dû à la lenteur de RecyclerView, vous pouvez ajouter des événements de trace personnalisés au code approprié et réexécuter Systrace pour en savoir plus. Dans le nouvel outil Systrace, la chronologie indique quand les méthodes de votre appli sont appelées et le temps nécessaire à leur exécution.
Si Systrace ne vous indique pas pourquoi le thread UI prend beaucoup de temps, utilisez le Profileur de processeur Android pour enregistrer une trace de méthode échantillonnée ou instrumentée. En général, les traces de méthode ne sont pas efficaces pour identifier les à-coups, car elles produisent des faux positifs en raison d'importants frais généraux, et ne permettent pas de voir si les threads sont en cours d'exécution ou s'ils sont bloqués. Toutefois, les traces de méthode peuvent vous aider à identifier les méthodes les plus longues dans votre appli. Après avoir identifié ces méthodes, ajoutez des repères de trace et réexécutez Systrace pour voir si ces méthodes entraînent des à-coups.
Pour en savoir plus, consultez Comprendre Systrace.
Contrôle personnalisé des performances
Si vous ne parvenez pas à reproduire les à-coups sur un appareil local, vous pouvez intégrer un contrôle personnalisé des performances dans votre appli afin d'identifier ce qui cause les à-coups sur les appareils dans le champ.
Pour ce faire, collectez les délais d'affichage à partir de parties spécifiques de votre appli via FrameMetricsAggregator, et enregistrez et analysez les données à l'aide de Firebase Performance Monitoring.
Pour en savoir plus, consultez Premiers pas avec Performance Monitoring pour Android.
Cadres figés
Les cadres figés sont des cadres de l'interface utilisateur qui mettent plus de 700 ms à s'afficher. Cela pose problème, car votre application semble être bloquée et ne répond pas à l'entrée utilisateur pendant près d'une seconde complète alors que le cadre est en train de s'afficher. Nous recommandons fortement que les applications mettent 16 ms à afficher un cadre afin de garantir la fluidité de l'UI. Toutefois, au démarrage de l'application ou lors du passage à un autre écran, il est normal que le cadre initial mette plus de 16 ms à s'afficher, car l'application doit gonfler les vues, disposer les éléments à l'écran et procéder à l'affichage initial à partir de zéro. C'est pourquoi Android suit les cadres figés indépendamment de l'affichage lent. Les cadres de votre application ne devraient jamais mettre plus de 700 ms à s'afficher.
Pour vous aider à améliorer la qualité de votre application, Android contrôle automatiquement les cadres figés et affiche les informations correspondantes dans le tableau de bord Android Vitals. Pour en savoir plus sur la collecte des données, consultez Contrôler la qualité technique de votre appli avec Android Vitals.
Les cadres figés sont une forme extrême d'affichage lent. La procédure pour diagnostiquer et résoudre le problème est donc la même.
Suivi des à-coups
FrameTimeline dans Perfetto peut aider à suivre les lenteurs cadres figés.
Relation entre les images lentes, les cadres figés et les ANR
Les images lentes, les cadres figés et les ANR sont différentes formes d'à-coups que votre application peut rencontrer. Consultez le tableau ci-dessous pour connaître la différence.
| Lenteur des frames | Cadres figés | ANR | |
|---|---|---|---|
| Délai d'affichage | Entre 16 ms et 700 ms | Entre 700 ms et 5 s | Supérieur à 5 s |
| Zone d'impact visible pour l'utilisateur |
|
|
|
Suivre séparément les images lentes et les cadres figés
Au démarrage de l'application ou lors du passage à un autre écran, il est normal que le cadre initial mette plus de 16 ms à s'afficher, car votre application doit gonfler les vues, disposer les éléments à l'écran et procéder à l'affichage initial à partir de zéro.
Bonnes pratiques pour hiérarchiser et résoudre les à-coups
Tenez compte des bonnes pratiques suivantes lorsque vous cherchez à résoudre les problèmes d'à-coup dans votre application :
- Identifier et résoudre les à-coups les plus faciles à reproduire
- Résolvez en priorité les ANR. Bien que les problèmes d'images lentes ou de cadres figés puissent donner l'impression que l'application est lente, les ANR empêchent l'application de répondre.
- Il est difficile de reproduire un affichage lent, mais vous pouvez commencer par supprimer les cadres figés de 700 ms. Cela se produit généralement lorsque l'application démarre ou change d'écran.
Corriger les à-coups
Pour résoudre ce problème, examinez les images qui ne s'affichent pas en l'espace de 16 ms et recherchez le problème. Vérifiez si Record View#draw ou Layout prend trop de temps pour certaines images. Consultez la section Principales sources d'à-coups pour ces problèmes et d'autres.
Pour éviter les à-coups, exécutez des tâches de longue durée de manière asynchrone en dehors du thread UI. Soyez toujours conscient du thread sur lequel s'exécute votre code et faites preuve de prudence lorsque vous publiez des tâches importantes dans le thread principal.
Si vous disposez d'une UI principale complexe qui est importante pour votre appli (comme la liste de défilement centrale), envisagez d'écrire des tests d'instrumentation pouvant détecter automatiquement les affichages lents et effectuez régulièrement des tests pour éviter les régressions.
Cause des problèmes courants d'à-coups
Les sections suivantes expliquent les à-coups courants dans les applis à l'aide du système View et les bonnes pratiques pour y remédier. Pour en savoir plus sur la résolution des problèmes de performances avec Jetpack Compose, consultez la page Performances de Jetpack Compose.
Listes déroulantes
ListView, et surtout RecyclerView, sont couramment utilisés pour les listes déroulantes complexes, les plus susceptibles de subir des à-coups. Ils contiennent tous deux des repères Systrace. Vous pouvez donc utiliser Systrace pour voir s'ils contribuent aux à-coups dans votre appli. Transmettez l'argument de ligne de commande -a
<your-package-name> pour afficher les sections de trace dans RecyclerView, ainsi que les repères de trace que vous avez ajoutés. Si possible, suivez les instructions des alertes générées dans la sortie Systrace. Dans Systrace, vous pouvez cliquer sur les sections suivies par RecyclerView pour obtenir une explication du travail de RecyclerView.
RecyclerView : notifyDataSetChanged()
Si tous les éléments de votre RecyclerView sont reconstruits (et donc redisposés et redessinés) dans une seule image, assurez-vous de ne pas appeler notifyDataSetChanged(), setAdapter(Adapter) ou swapAdapter(Adapter,
boolean) pour les petites mises à jour. Ces méthodes signalent que des modifications ont été apportées à l'ensemble du contenu de la liste et apparaissent dans Systrace sous la forme RV FullInvalidate. Utilisez plutôt SortedList ou DiffUtil pour générer un nombre minimal de mises à jour lorsque le contenu est modifié ou ajouté.
Prenons l'exemple d'une appli qui reçoit une nouvelle version d'une liste de contenus d'actualités du serveur. Lorsque vous publiez ces informations sur l'adaptateur, il est possible d'appeler notifyDataSetChanged(), comme illustré dans l'exemple suivant :
Kotlin
fun onNewDataArrived(news: List<News>) {
    myAdapter.news = news
    myAdapter.notifyDataSetChanged()
}
Java
void onNewDataArrived(List<News> news) {
    myAdapter.setNews(news);
    myAdapter.notifyDataSetChanged();
}
L'inconvénient est qu'en cas de changement mineur, tel qu'un seul élément ajouté en haut, RecyclerView n'en est pas informé. Par conséquent, il est invité à supprimer l'intégralité de l'état de l'élément mis en cache et doit donc tout relier.
Nous vous recommandons d'utiliser DiffUtil, qui calcule et envoie très peu de mises à jour :
Kotlin
fun onNewDataArrived(news: List<News>) {
    val oldNews = myAdapter.items
    val result = DiffUtil.calculateDiff(MyCallback(oldNews, news))
    myAdapter.news = news
    result.dispatchUpdatesTo(myAdapter)
}
Java
void onNewDataArrived(List<News> news) {
    List<News> oldNews = myAdapter.getItems();
    DiffResult result = DiffUtil.calculateDiff(new MyCallback(oldNews, news));
    myAdapter.setNews(news);
    result.dispatchUpdatesTo(myAdapter);
}
Pour indiquer à DiffUtil comment inspecter vos listes, définissez MyCallback en tant qu'implémentation Callback.
RecyclerView : RecyclerViews imbriquées
Il est courant d'imbriquer plusieurs instances de RecyclerView, en particulier avec une liste verticale de listes déroulantes horizontales. Les grilles d'applis sur la page principale du Play Store en sont un bon exemple. Cette solution peut être très efficace, mais elle génère de nombreuses vues en mouvement.
Si vous constatez qu'un grand nombre d'éléments internes gonflent lorsque vous faites défiler la page pour la première fois, nous vous conseillons de vérifier que vous partagez RecyclerView.RecycledViewPool entre instances horizontales de RecyclerView. Par défaut, chaque RecyclerView possède son propre pool d'éléments. Toutefois, lorsqu'une dizaine d'itemViews s'affichent à l'écran en même temps, cela pose problème lorsqu'itemViews ne peut pas être partagé par les différentes listes horizontales si toutes les lignes présentent des types de vues similaires.
Kotlin
class OuterAdapter : RecyclerView.Adapter<OuterAdapter.ViewHolder>() {

    ...

    override fun onCreateViewHolder(parent: ViewGroup, viewType: Int): ViewHolder {
        // Inflate inner item, find innerRecyclerView by ID.
        val innerLLM = LinearLayoutManager(parent.context, LinearLayoutManager.HORIZONTAL, false)
        innerRv.apply {
            layoutManager = innerLLM
            recycledViewPool = sharedPool
        }
        return OuterAdapter.ViewHolder(innerRv)
    }
    ...
Java
class OuterAdapter extends RecyclerView.Adapter<OuterAdapter.ViewHolder> {
    RecyclerView.RecycledViewPool sharedPool = new RecyclerView.RecycledViewPool();

    ...

    @Override
    public void onCreateViewHolder(ViewGroup parent, int viewType) {
        // Inflate inner item, find innerRecyclerView by ID.
        LinearLayoutManager innerLLM = new LinearLayoutManager(parent.getContext(),
                LinearLayoutManager.HORIZONTAL);
        innerRv.setLayoutManager(innerLLM);
        innerRv.setRecycledViewPool(sharedPool);
        return new OuterAdapter.ViewHolder(innerRv);

    }
    ...
Si vous souhaitez optimiser davantage, vous pouvez également appeler setInitialPrefetchItemCount(int) au niveau du LinearLayoutManager du RecyclerView interne. Par exemple, si vous avez toujours 3,5 éléments visibles à la suite, appelez innerLLM.setInitialItemPrefetchCount(4). Cela indique à RecyclerView que lorsqu'une ligne horizontale est sur le point d'apparaître à l'écran, il doit essayer de précharger les éléments qui s'y trouvent s'il reste du temps sur le thread UI.
RecyclerView : le gonflage est trop important ou la création prend trop de temps
Dans la plupart des cas, la fonctionnalité de préchargement dans RecyclerView permet de limiter le coût du gonflage en effectuant un calcul à l'avance lorsque le thread UI est inactif.
Si vous constatez un gonflage sur une image, et non sur une section intitulée RV Prefetch (Précharger RV), veillez à effectuer le test sur un appareil compatible et à utiliser une version récente de la bibliothèque Support.
Le préchargement n'est compatible qu'à partir du niveau d'API 21 d'Android 5.0 ou version ultérieure.
Si vous constatez que des gonflages provoquent souvent des à-coups lorsque de nouveaux éléments s'affichent à l'écran, vérifiez que vous ne disposez pas de plus de types de vues que nécessaire. Moins il y a de types de vues dans le contenu d'un RecyclerView, moins il faut avoir recours au gonflage lorsque de nouveaux types d'éléments s'affichent à l'écran. Si possible, fusionnez les types de vues lorsque cela est raisonnable. Si seule une icône, une couleur ou un texte change d'un type à l'autre, vous pouvez effectuer cette modification au moment de la liaison et éviter le gonflage, ce qui réduit l'encombrement de la mémoire par votre appli.
Si vos types de vues sont corrects, pensez à réduire le coût du gonflage.
Il peut être utile de réduire les vues structurelles et de conteneurs inutiles. Envisagez de créer itemViews avec ConstraintLayout, ce qui peut contribuer à réduire les vues structurelles.
Si vous souhaitez optimiser davantage les performances et que vos hiérarchies d'éléments sont simples et que vous n'avez pas besoin de fonctionnalités de thématisation et de style complexes, envisagez d'appeler vous-même les constructeurs. Cependant, cela n'est souvent pas utile, car vous risquez de perdre la simplicité et les fonctionnalités de XML
RecyclerView : la liaison prend trop de temps
La liaison (c'est-à-dire onBindViewHolder(VH,
int)) doit être simple et prendre bien moins d'une milliseconde pour tout, sauf pour les éléments les plus complexes. Elle doit récupérer des éléments d'objet Java (POJO) simples issus des données sur les articles internes de votre adaptateur et des setters d'appel sur les vues dans le ViewHolder. Si RV OnBindView prend beaucoup de temps, vérifiez que le code de liaison est simple à réaliser.
Si vous utilisez des objets POJO simples pour stocker des données dans votre adaptateur, vous pouvez complètement vous passer d'écrire le code de liaison dans onBindViewHolder en utilisant la bibliothèque de liaison de données.
RecyclerView ou ListView : la mise en page ou le dessin prend trop de temps
Pour les problèmes de dessin et de mise en page, consultez les sections Performances de mise en page et Performances d'affichage.
ListView : gonflage
Vous pouvez désactiver accidentellement le recyclage dans ListView si vous ne faites pas attention. Si un gonflage se produit à chaque fois qu'un élément s'affiche à l'écran, vérifiez que votre implémentation de Adapter.getView() utilise le paramètre convertView, effectue à nouveau la liaison avec lui et le renvoie. Si votre implémentation getView() est toujours gonflée, votre appli ne bénéficie pas des avantages du recyclage dans ListView. La structure de votre getView() doit presque toujours être semblable à l'implémentation suivante :
Kotlin
fun getView(position: Int, convertView: View?, parent: ViewGroup): View {
    return (convertView ?: layoutInflater.inflate(R.layout.my_layout, parent, false)).apply {
        // Bind content from position to convertView.
    }
}
Java
View getView(int position, View convertView, ViewGroup parent) {

    if (convertView == null) {
        // Only inflate if no convertView passed.
        convertView = layoutInflater.inflate(R.layout.my_layout, parent, false)
    }
    // Bind content from position to convertView.
    return convertView;
}
Performances de mise en page
Si Systrace indique que le segment Layout de Choreographer#doFrame est trop actif, ou actif trop souvent, cela signifie que vous rencontrez des problèmes de performances de mise en page. Les performances de mise en page de votre appli dépendent de la partie de la hiérarchie des vues qui disposent d'entrées ou de paramètres de mise en page différents.
Performances de mise en page : coût
Si les segments durent plus de quelques millisecondes, il est possible que vous obteniez les pires performances d'imbrication pour RelativeLayouts ou weighted-LinearLayouts. Chacune de ces mises en page peut déclencher plusieurs passes de mesure et de mise en page de ses enfants. L'imbrication peut donc entraîner le comportement de O(n^2) sur la profondeur de l'imbrication.
Essayez d'éviter RelativeLayout ou la fonctionnalité de pondération de LinearLayout dans tous les nœuds feuilles les plus bas de la hiérarchie. Pour ce faire, procédez comme suit :
- Réorganisez vos vues structurelles.
- Définissez une logique de mise en page personnalisée. Pour un exemple spécifique, consultez Optimiser les hiérarchies de mise en page. Vous pouvez essayer de passer à
ConstraintLayout, qui fournit des fonctionnalités similaires, sans les inconvénients en termes de performances.
Performances de mise en page : fréquence
Une mise en page est normalement effectuée lorsque de nouveaux contenus s'affichent à l'écran, par exemple lorsque la page défile jusqu'à faire apparaître un nouvel élément dans RecyclerView. Si une mise en page importante est effectuée sur chaque image, il est possible que vous l'animiez, ce qui est susceptible d'entraîner la perte de certaines images.
En règle générale, les animations doivent s'exécuter sur les propriétés de dessin de View, comme :
Vous pouvez modifier tous ces éléments de manière beaucoup plus économique que les propriétés de mise en page, comme la marge intérieure ou les marges. En règle générale, il est beaucoup moins cher de modifier les propriétés de dessin d'une vue en appelant un setter qui déclenche un invalidate(), suivi de draw(Canvas). dans l'image suivante. Cette opération réenregistre les opérations de dessin pour la vue invalidée. De plus, elle est généralement beaucoup moins chère que la mise en page.
Performances d'affichage
L'interface utilisateur Android fonctionne en deux phases :
- Record View#draw sur le thread UI, qui exécute
draw(Canvas)sur chaque vue invalidée, et peut invoquer des appels dans des vues personnalisées ou dans votre code. - DrawFrame sur le
RenderThread, qui s'exécute sur leRenderThreadnatif, mais fonctionne sur la base du travail généré par la phase Record View#draw.
Performances d'affichage : thread UI
Si l'opération Record View#draw prend du temps, il arrive souvent qu'un bitmap soit peint dans le thread UI. Peindre sur un bitmap utilise l'affichage processeur. Essayez d'éviter cela dans la mesure du possible. Vous pouvez utiliser le traçage de méthode avec le Profileur de processeur Android pour voir si c'est le cas.
Un bitmap est souvent peint lorsqu'une appli souhaite décorer un bitmap avant de l'afficher, par exemple en ajoutant des angles arrondis :
Kotlin
val paint = Paint().apply {
    isAntiAlias = true
}
Canvas(roundedOutputBitmap).apply {
    // Draw a round rect to define the shape:
    drawRoundRect(
            0f,
            0f,
            roundedOutputBitmap.width.toFloat(),
            roundedOutputBitmap.height.toFloat(),
            20f,
            20f,
            paint
    )
    paint.xfermode = PorterDuffXfermode(PorterDuff.Mode.MULTIPLY)
    // Multiply content on top to make it rounded.
    drawBitmap(sourceBitmap, 0f, 0f, paint)
    setBitmap(null)
    // Now roundedOutputBitmap has sourceBitmap inside, but as a circle.
}
Java
Canvas bitmapCanvas = new Canvas(roundedOutputBitmap);
Paint paint = new Paint();
paint.setAntiAlias(true);
// Draw a round rect to define the shape:
bitmapCanvas.drawRoundRect(0, 0,
        roundedOutputBitmap.getWidth(), roundedOutputBitmap.getHeight(), 20, 20, paint);
paint.setXfermode(new PorterDuffXfermode(PorterDuff.Mode.MULTIPLY));
// Multiply content on top to make it rounded.
bitmapCanvas.drawBitmap(sourceBitmap, 0, 0, paint);
bitmapCanvas.setBitmap(null);
// Now roundedOutputBitmap has sourceBitmap inside, but as a circle.
Si c'est le genre de tâche que vous effectuez dans le thread UI, vous pouvez le faire sur le thread de décodage en arrière-plan. Dans certains cas, comme dans l'exemple précédent, vous pouvez même effectuer le travail au moment du dessin. Ainsi, si votre code Drawable ou View se présente comme suit :
Kotlin
fun setBitmap(bitmap: Bitmap) {
    mBitmap = bitmap
    invalidate()
}

override fun onDraw(canvas: Canvas) {
    canvas.drawBitmap(mBitmap, null, paint)
}
Java
void setBitmap(Bitmap bitmap) {
    mBitmap = bitmap;
    invalidate();
}

void onDraw(Canvas canvas) {
    canvas.drawBitmap(mBitmap, null, paint);
}
Vous pouvez le remplacer par le code suivant :
Kotlin
fun setBitmap(bitmap: Bitmap) {
    shaderPaint.shader = BitmapShader(bitmap, Shader.TileMode.CLAMP, Shader.TileMode.CLAMP)
    invalidate()
}

override fun onDraw(canvas: Canvas) {
    canvas.drawRoundRect(0f, 0f, width, height, 20f, 20f, shaderPaint)
}
Java
void setBitmap(Bitmap bitmap) {
    shaderPaint.setShader(
            new BitmapShader(bitmap, TileMode.CLAMP, TileMode.CLAMP));
    invalidate();
}

void onDraw(Canvas canvas) {
    canvas.drawRoundRect(0, 0, width, height, 20, 20, shaderPaint);
}
Vous pouvez également effectuer cette opération pour la protection en arrière-plan, par exemple lors du dessin d'un dégradé sur le bitmap, et du filtrage d'images avec ColorMatrixColorFilter, deux autres opérations courantes qui modifient les bitmaps.
Si vous souhaitez dessiner sur un bitmap pour une autre raison, par exemple pour l'utiliser comme cache, essayez de dessiner directement sur le Canvas accéléré par le matériel transmis à votre View ou à votre Drawable. Si nécessaire, envisagez également d'appeler setLayerType() avec LAYER_TYPE_HARDWARE pour mettre en cache la sortie de rendu complexe tout en tirant parti du rendu GPU.
Performances d'affichage : RenderThread
L'enregistrement de certaines opérations Canvas est peu coûteux, mais déclenche des calculs coûteux sur le RenderThread. Systrace les signale généralement via des alertes.
Animer des chemins d'accès volumineux
Lorsque Canvas.drawPath() est appelé sur le Canvas avec accélération matérielle transmise à View, Android dessine d'abord ces chemins d'accès sur le processeur, puis les importe dans le GPU.
Si vos chemins d'accès sont volumineux, évitez de les modifier d'une image à l'autre afin qu'ils puissent être mis en cache et dessinés plus efficacement.
drawPoints(), drawLines() et drawRect/Circle/Oval/RoundRect() sont plus efficaces et plus utiles, même si vous utilisez plus d'appels de dessin.
Canvas.clipPath
clipPath(Path) déclenche un comportement de bornement coûteux et doit généralement être évité. Si possible, optez pour le dessin de formes plutôt que de rogner des formes non rectangulaires. Cette méthode fonctionne mieux et est compatible avec l'anticrénelage. Par exemple, l'appel clipPath suivant peut être exprimé différemment :
Kotlin
canvas.apply {
    save()
    clipPath(circlePath)
    drawBitmap(bitmap, 0f, 0f, paint)
    restore()
}
Java
canvas.save();
canvas.clipPath(circlePath);
canvas.drawBitmap(bitmap, 0f, 0f, paint);
canvas.restore();
Écrivez plutôt l'exemple précédent comme suit :
Kotlin
paint.shader = BitmapShader(bitmap, Shader.TileMode.CLAMP, Shader.TileMode.CLAMP)
// At draw time:
canvas.drawPath(circlePath, mPaint)
Java
// One time init:
paint.setShader(new BitmapShader(bitmap, TileMode.CLAMP, TileMode.CLAMP));
// At draw time:
canvas.drawPath(circlePath, mPaint);
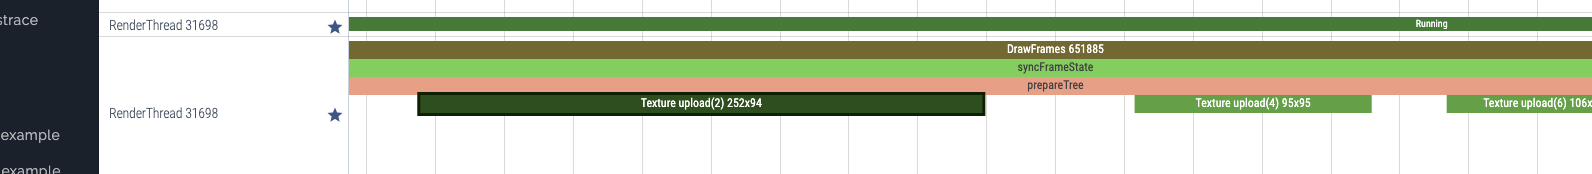
Importations de bitmaps
Android affiche les bitmaps sous forme de textures OpenGL. La première fois qu'un bitmap est affiché dans une image, il est importé dans le GPU. Vous pouvez le voir dans Systrace sous la forme Texture import(id) width x height. Comme l'illustre la figure 2, cette opération peut prendre plusieurs millisecondes, mais il est nécessaire d'afficher l'image avec le GPU.
Si cela prend beaucoup de temps, vérifiez d'abord les valeurs de largeur et de hauteur de la trace. Assurez-vous que le bitmap affiché n'est pas plus grand que la zone de l'écran. Si c'est le cas, vous perdrez du temps d'importation, et de la mémoire. Généralement, les bibliothèques de chargement bitmap permettent de demander un bitmap de taille appropriée.
Sous Android 7.0, le code de chargement bitmap (généralement effectué par les bibliothèques) peut appeler prepareToDraw() pour déclencher une importation anticipée, avant que cela ne soit nécessaire. De cette manière, l'importation se fait de façon précoce, lorsque le RenderThread est inactif. Vous pouvez le faire après le décodage ou lors de la liaison d'un bitmap à une vue, à condition de connaître le bitmap. Idéalement, votre bibliothèque de chargement de bitmaps effectue cette opération pour vous. Toutefois, si vous gérez la vôtre ou si vous souhaitez vous assurer de ne pas enregistrer d'importations sur des appareils plus récents, vous pouvez appeler prepareToDraw() dans votre code.
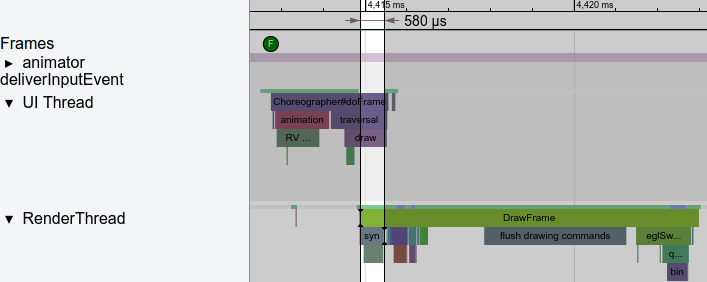
prepareToDraw().Retards de planification des threads
Le programmeur de threads est la partie du système d'exploitation Android qui choisit les threads du système et détermine quand et pendant combien de temps ils doivent s'exécuter.
Parfois, il peut y avoir des à-coups si le thread UI de votre appli est bloqué ou ne s'exécute pas. Systrace utilise différentes couleurs, comme l'illustre la figure 3, pour indiquer qu'un thread est en veille (gris), exécutable (bleu : il peut s'exécuter, mais n'est pas sélectionné par le planificateur pour s'exécuter pour le moment), en cours d'exécution (vert) ou en mode veille sans interruption (rouge ou orange). Ceci est extrêmement utile pour déboguer les problèmes d'à-coups causés par les retards de planification des threads.
Souvent, les appels de liaison (mécanisme de communication inter-processus (IPC) sur Android) entraînent de longues pauses dans l'exécution de votre appli. Dans les dernières versions d'Android, il s'agit de l'une des raisons les plus courantes pour lesquelles le thread UI s'arrête. La solution consiste généralement à éviter d'appeler des fonctions qui effectuent des appels de liaison. Si cela est inévitable, mettez en cache la valeur ou déplacez la tâche vers des threads en arrière-plan. À mesure que le codebase s'agrandit, vous pouvez ajouter accidentellement un appel de liaison en appelant une méthode de bas niveau, si vous ne faites pas attention. Vous pouvez toutefois les trouver et les corriger à l'aide du traçage.
Si vous disposez de transactions de liaison, vous pouvez capturer leurs piles d'appels via les commandes adb suivantes :
$ adb shell am trace-ipc start
… use the app - scroll/animate ...
$ adb shell am trace-ipc stop --dump-file /data/local/tmp/ipc-trace.txt
$ adb pull /data/local/tmp/ipc-trace.txt
Les appels qui semblent inoffensifs, comme getRefreshRate(), peuvent parfois déclencher des transactions de liaison et entraîner de gros problèmes lorsqu'ils sont appelés fréquemment. Le traçage régulier peut vous aider à détecter et à résoudre ces problèmes lorsqu'ils se présentent.
trace-ipc pour rechercher et supprimer les appels de liaison.Si aucune activité de liaison ne s'affiche, mais que votre thread UI ne s'exécute pas, assurez-vous de ne pas attendre un verrouillage ou une autre opération d'un autre thread. En règle générale, le thread UI ne doit pas attendre les résultats d'autres threads. Les autres fils de discussion doivent y publier des informations.
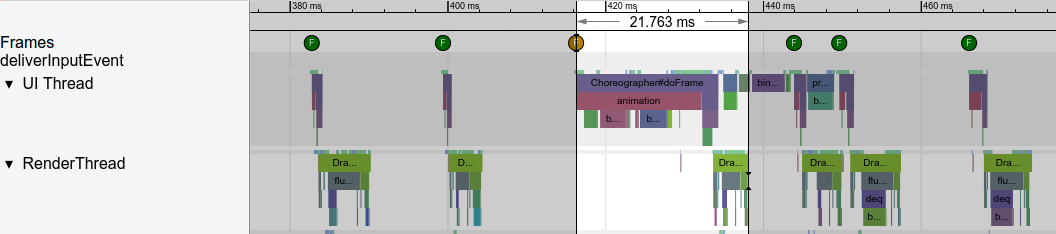
Allocation d'objets et récupération de mémoire
Depuis l'introduction d'ART comme environnement d'exécution par défaut dans Android 5.0, l'allocation d'objets et la récupération de mémoire sont désormais beaucoup moins problématiques. Toutefois, il est toujours possible d'alourdir vos threads avec des tâches supplémentaires. Il est possible d'allouer des ressources en réponse à un événement rare (comme un utilisateur qui clique sur un bouton), mais n'oubliez pas que chaque allocation entraîne un coût. S'il s'agit d'une boucle serrée qui est appelée fréquemment, envisagez d'éviter l'allocation pour alléger la charge sur la récupération de mémoire.
Systrace vous indique si la récupération de mémoire s'exécute fréquemment, et le Profileur de mémoire d'Android vous indique la provenance des allocations. Si vous évitez les allocations dans la mesure du possible, en particulier dans les boucles serrées, vous ne devriez pas rencontrer de problème.
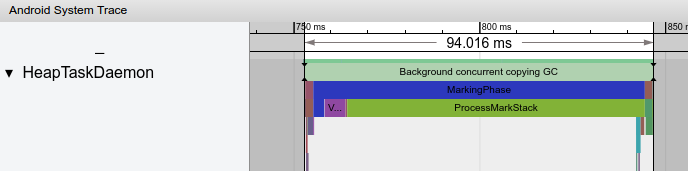
Dans les versions récentes d'Android, le GC s'exécute généralement sur un thread d'arrière-plan nommé HeapTaskDaemon. Une quantité importante d'allocations peut signifier que davantage de ressources processeur sont utilisées pour le récupération de mémoire, comme illustré dans la figure 5.
Recommandations personnalisées
- Remarque : Le texte du lien s'affiche lorsque JavaScript est désactivé
- Effectuer une analyse comparative de votre application
- Présentation de la mesure des performances des applications
- Bonnes pratiques pour l'optimisation des applications