
Android 9 (API 수준 28) 및 이후 버전을 실행하는 기기에는 시스템 추적이라는 시스템 수준 앱이 포함되어 있습니다. 이 앱은 systrace 명령줄 유틸리티와 유사하지만 이 앱을 사용하면 기기에 전원을 연결하고 adb를 통해 연결할 필요 없이 테스트 기기 자체에서 직접 트레이스를 기록할 수 있습니다. 그런 다음, 이 앱을 사용하여 트레이스 결과를 개발팀과 공유할 수 있습니다.
Android 10 이상을 실행하는 기기는 Perfetto 형식으로 트레이스를 기록하는 반면, 이전 기기는 Systrace 형식으로 기록합니다. Perfetto 트레이스 뷰어를 사용하여 두 형식을 모두 연 후 트레이스를 분석하는 것이 좋습니다.
느린 시작, 느린 전환 또는 UI 버벅거림과 같은 앱의 성능 관련 버그를 해결할 때 트레이스를 기록하면 도움이 됩니다.
시스템 트레이스 기록
시스템 추적 앱을 사용하면 빠른 설정 타일 또는 앱 자체 내의 메뉴를 사용하여 시스템 트레이스를 기록할 수 있습니다. 다음 섹션에서는 이러한 인터페이스를 사용하여 기록 프로세스를 완료하는 방법을 설명합니다.
빠른 설정 타일을 사용하여 기록
일반적으로 빠른 설정 타일은 기기 내 시스템 추적 프로세스를 완료하는 보다 편리한 방법입니다.
타일 설정
테스트 기기에서 처음으로 시스템 추적을 사용하거나 기기의 빠른 설정 패널(그림 2 참고)에 시스템 추적 타일이 표시되지 않는 경우 다음 설정 단계를 완료하세요.
- 개발자 옵션을 사용 설정합니다.
- 개발자 옵션 설정 화면을 엽니다.
- 디버깅 섹션에서 시스템 추적을 선택합니다. 시스템 추적 앱이 열리고 앱 메뉴가 표시됩니다.
그림 1에 표시된 것처럼 앱 메뉴에서 빠른 설정 타일 표시를 사용 설정합니다. 그림 2와 같이 시스템에서 시스템 추적 타일을 빠른 설정 패널에 추가합니다.
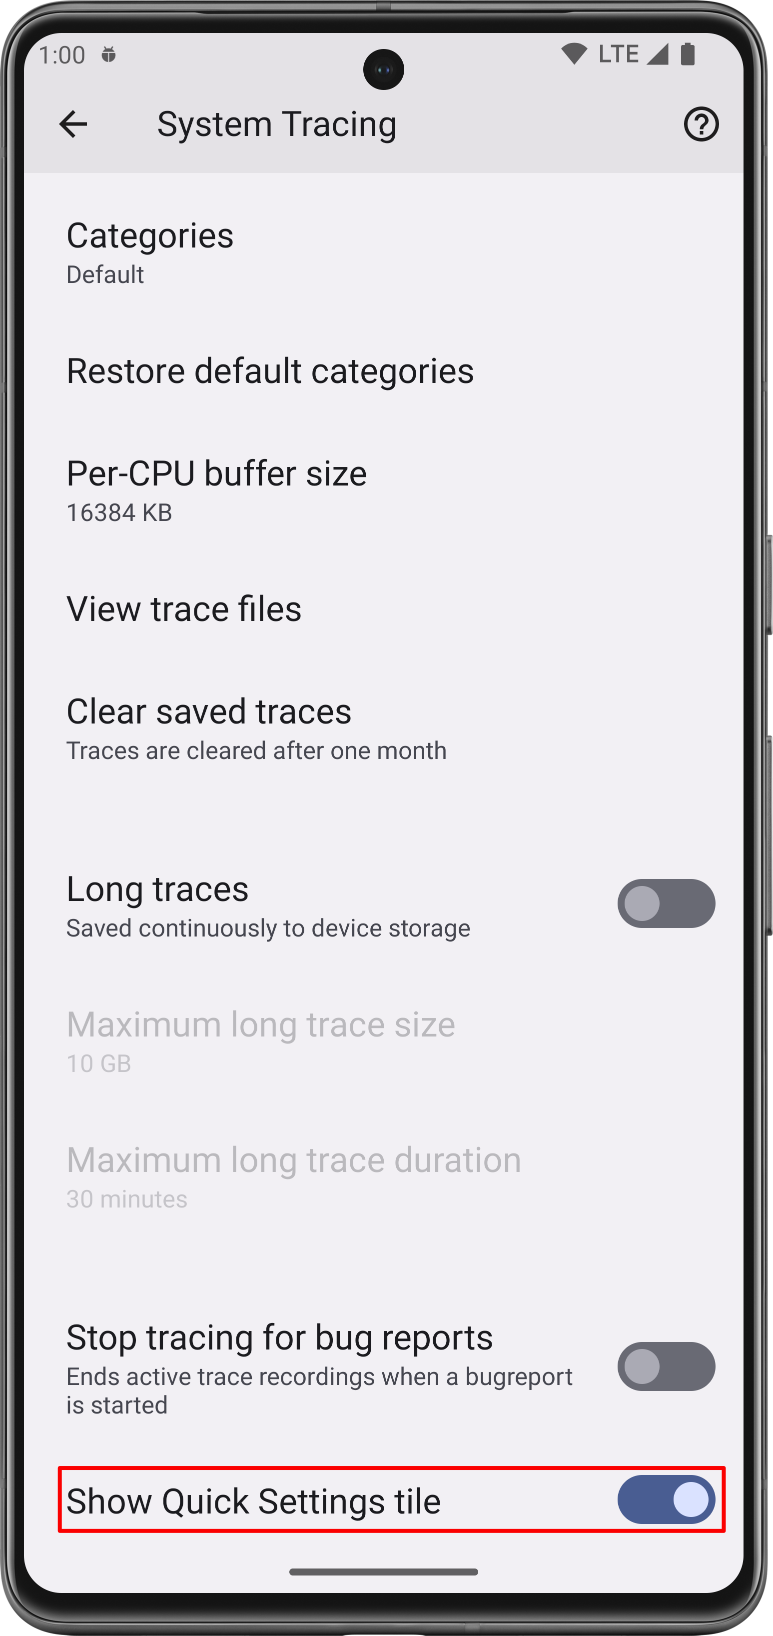
그림 1. 시스템 추적 앱의 빠른 설정 타일 표시 스위치 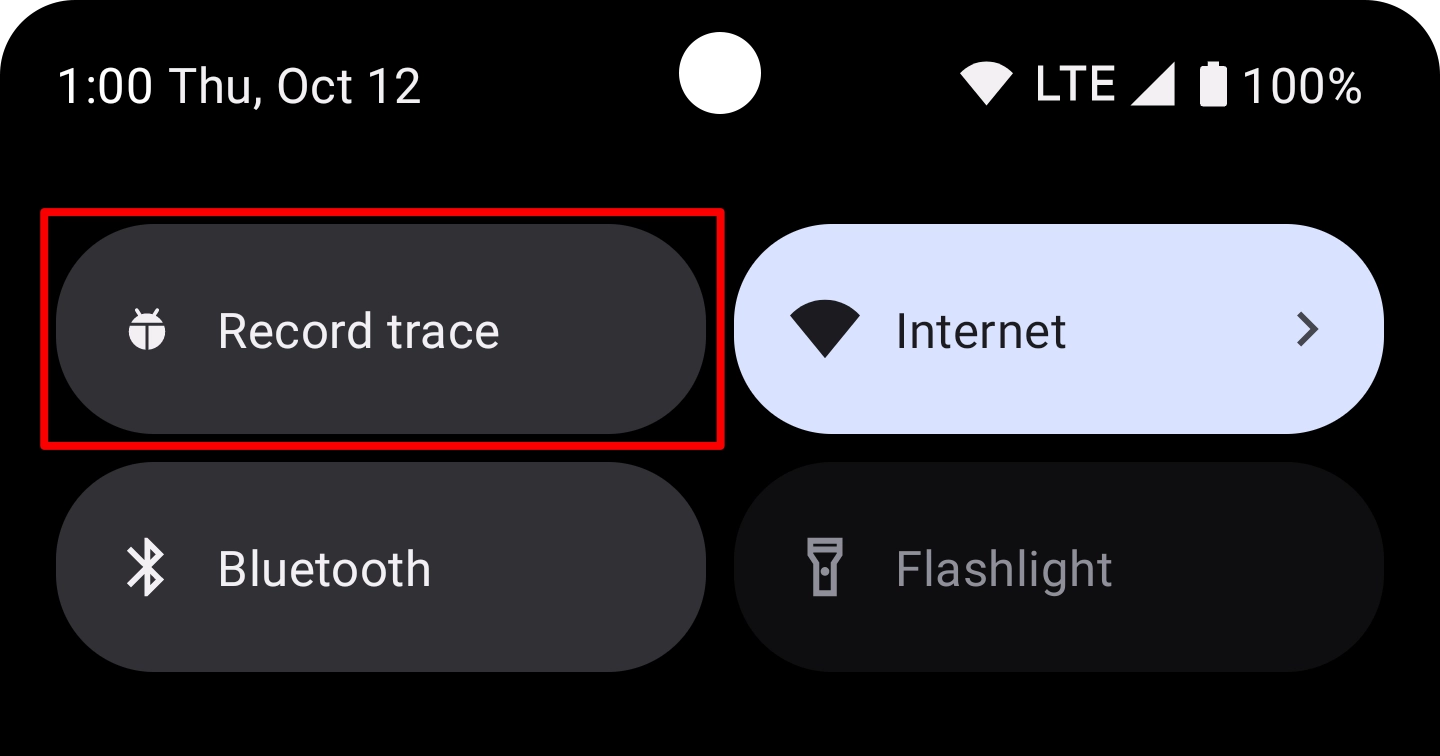
그림 2. 빠른 설정 패널 내의 시스템 추적 타일 참고: 기본적으로 시스템에서 시스템 추적 타일을 빠른 설정 패널의 첫 번째 타일로 추가합니다. 타일을 다른 위치에 표시하려면 패널의 수정 모드를 사용하여 타일을 이동하세요.
시스템 트레이스 기록 완료
빠른 설정 패널을 사용하여 시스템 트레이스를 기록하려면 다음 단계를 완료하세요.
트레이스 기록 라벨이 있는 시스템 추적 타일을 탭합니다. 타일이 사용 설정되고, 그림 3에 표시된 것처럼 시스템에서 트레이스를 기록 중임을 알리는 지속적인 알림이 표시됩니다.
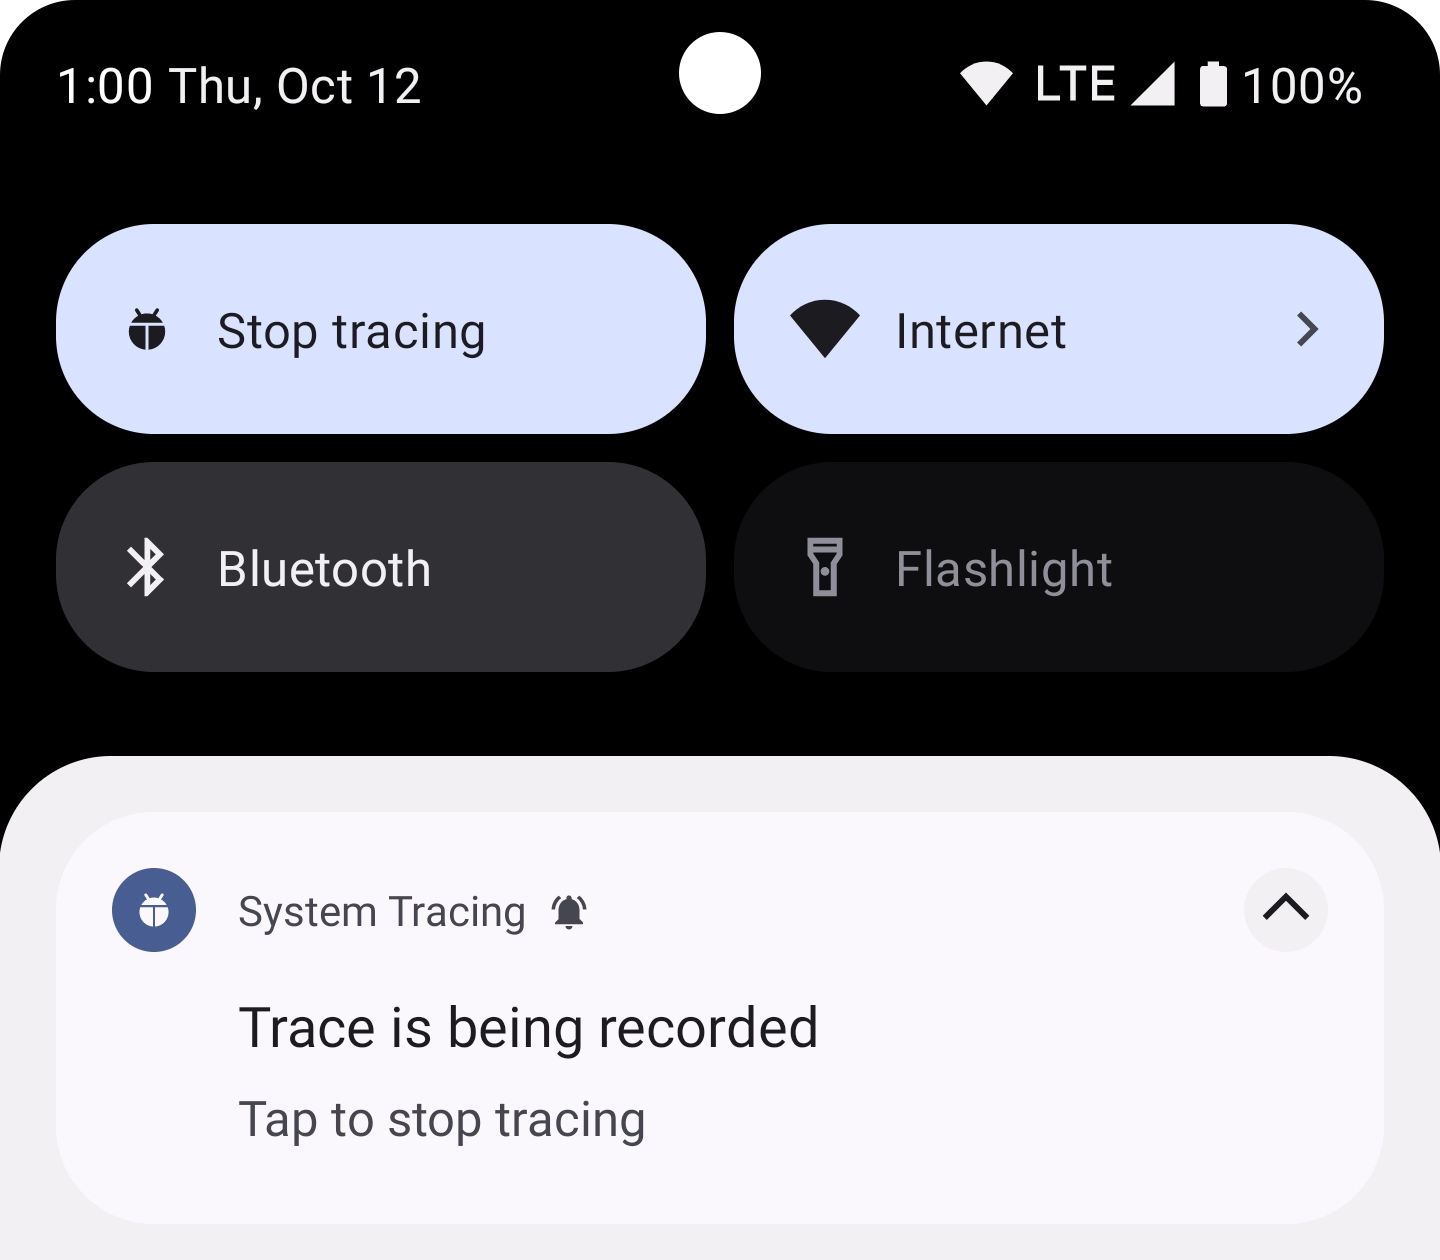
그림 3. 기기 내 시스템 트레이스를 시작한 후 표시되는 지속적인 알림 시스템에서 검사할 앱의 작업을 실행합니다.
빠른 설정 패널의 시스템 추적 타일 또는 시스템 추적 알림을 탭하여 추적을 중지합니다.
시스템에서 '트레이스 저장 중'이라는 메시지가 포함된 새로운 알림을 표시합니다. 저장이 완료되면 시스템에서는 알림을 닫고 그림 4에 표시된 것과 같이 트레이스가 저장되었으며 시스템 트레이스를 공유할 준비가 되었음을 확인하는 세 번째 알림을 표시합니다.
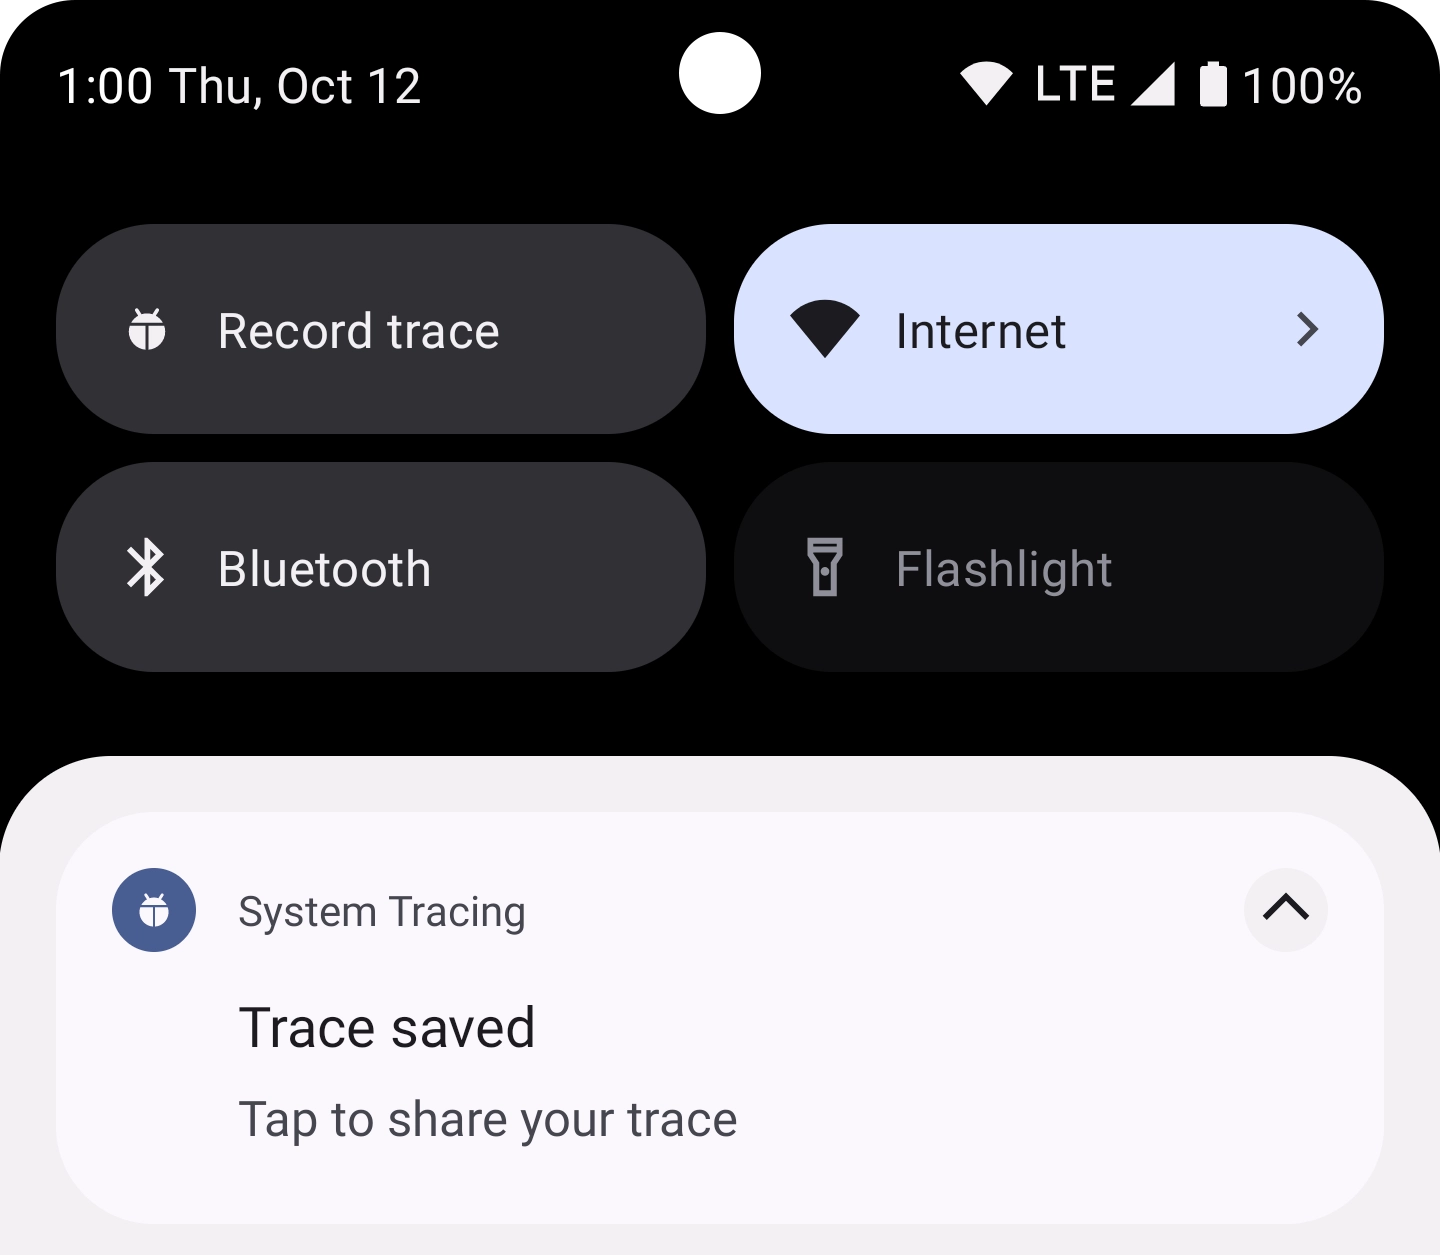
그림 4. 시스템에서 기록된 트레이스의 저장을 완료한 후 표시되는 지속적인 알림
앱 메뉴를 사용하여 기록
앱 메뉴에서 시스템 추적과 관련된 여러 고급 설정을 구성할 수 있으며 시스템 트레이스를 시작하고 중지하기 위한 스위치가 제공됩니다.
시스템 추적 앱 메뉴를 사용하여 시스템 트레이스를 기록하려면 다음 단계를 완료하세요.
- 개발자 옵션을 사용 설정합니다.
개발자 옵션 설정 화면을 엽니다. 디버깅 섹션에서 시스템 추적을 선택합니다. 시스템 추적 앱이 열립니다.
또는 시스템 추적 타일을 설정하는 경우 이 타일을 길게 탭하여 시스템 추적 앱을 시작할 수 있습니다.
시스템 트레이스에 디버깅이 사용 설정된 앱을 포함하도록 디버그 가능한 애플리케이션 추적이 선택되어 있는지 확인합니다.
선택적으로, 추적할 시스템 및 센서 호출의 카테고리를 선택하고 CPU별 버퍼 크기(KB 단위)를 선택합니다. 테스트 중인 사용 사례에 해당하는 카테고리를 선택합니다(예: 블루투스 작동을 테스트하는 경우 오디오 카테고리, 힙 할당의 경우 메모리 카테고리).
선택적으로, 장기 트레이스를 선택하여 기기 저장소에 지속적으로 저장되는 트레이스를 사용 설정합니다. 이 옵션의 경우 최대 장기 트레이스 크기 및 최대 장기 트레이스 기간에 제한을 설정합니다.
그림 5에 강조 표시된 트레이스 기록 스위치를 사용 설정합니다. 타일이 사용 설정되고, 그림 3에 표시된 것처럼 시스템에서 트레이스를 기록 중임을 알리는 지속적인 알림이 표시됩니다.
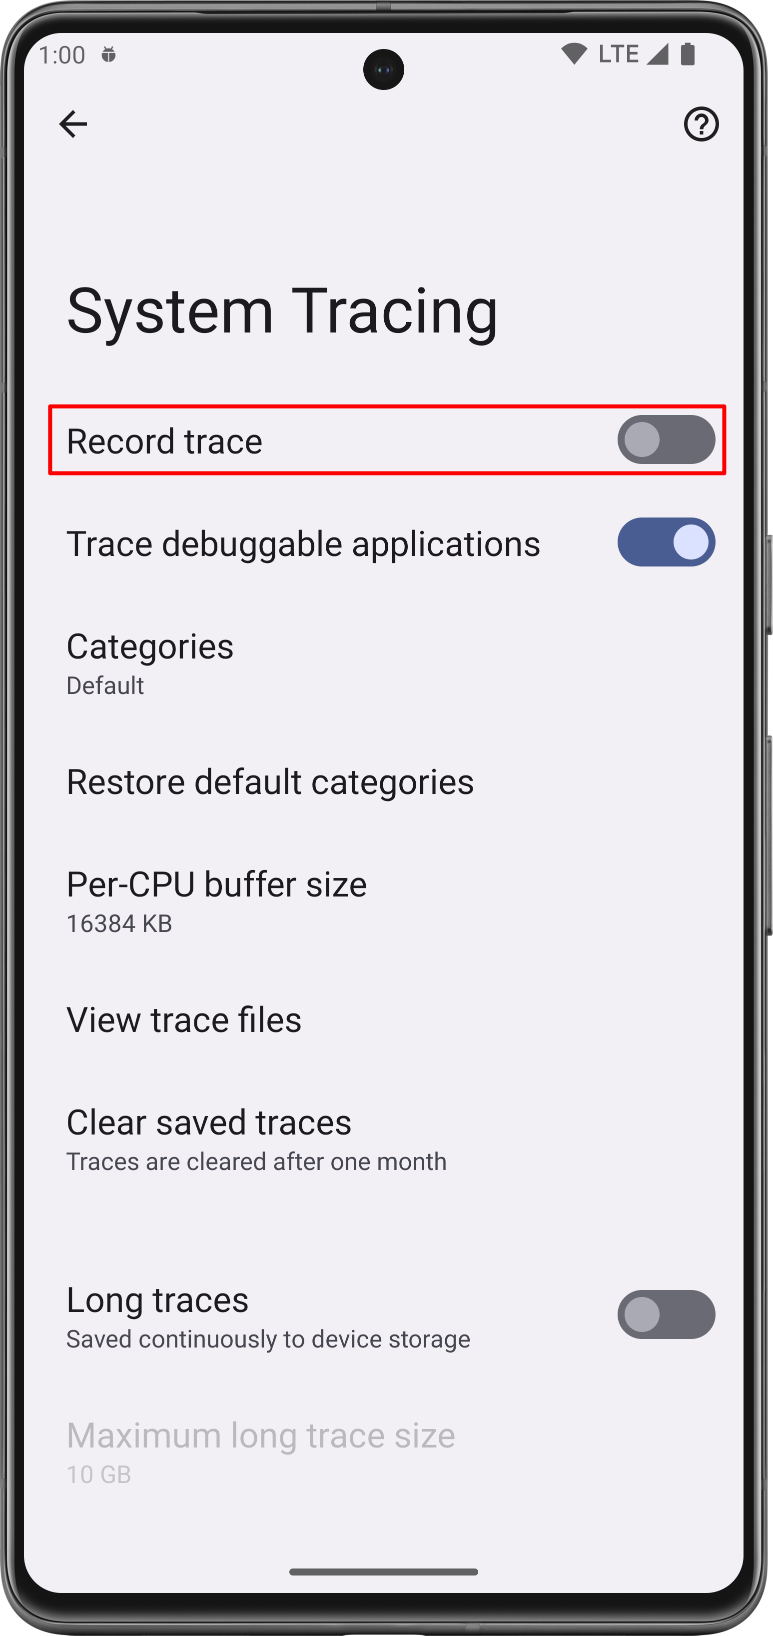
그림 5. 시스템 추적 설정의 트레이스 기록 스위치 시스템에서 검사할 앱의 작업을 실행합니다.
트레이스 기록 스위치를 꺼서 추적을 중지합니다.
시스템에서 '트레이스 저장 중'이라는 메시지가 포함된 새로운 알림을 표시합니다. 저장이 완료되면 시스템에서는 알림을 닫고 그림 4에 표시된 것과 같이 트레이스가 저장되었으며 시스템 트레이스를 공유할 준비가 되었음을 확인하는 세 번째 알림을 표시합니다.
시스템 트레이스 공유
시스템 추적 앱은 여러 개의 다른 워크플로의 일부로 시스템 트레이스 결과를 공유하는 데 도움이 됩니다. Android 10(API 수준 29) 및 이후 버전을 실행하는 기기에서는 .perfetto-trace 파일 이름 확장자를 사용하여 트레이스 파일이 저장되며 이 파일을 Perfetto UI에서 열 수 있습니다. 이전 버전의 Android를 실행하는 기기에서는 Systrace 형식을 나타내는 .ctrace 파일 이름 확장자를 사용하여 트레이스 파일이 저장됩니다.
메시지로 공유
시스템 추적을 사용하면 수집된 트레이스를 기기의 다른 앱과 공유할 수 있습니다. 기기를 개발 머신과 연결하지 않고도 이메일 또는 버그 추적 앱을 통해 트레이스를 개발팀에 보낼 수 있습니다.
시스템 트레이스를 기록한 후 기기에 표시되는 알림을 탭합니다(그림 4 참고). 플랫폼의 인텐트 선택 도구가 표시되므로 선택한 메시지 앱을 사용하여 트레이스를 공유할 수 있습니다.
Files 앱에서 공유
Android 10(API 수준 29) 이상을 실행하는 기기에서는 트레이스가 Files 앱에 표시됩니다. 이 앱에서 트레이스를 공유할 수 있습니다.
ADB를 사용하여 보고서 다운로드
adb를 사용하여 기기에서 시스템 트레이스를 추출할 수도 있습니다. 트레이스를 기록하는 데 사용된 기기를 개발 머신에 연결한 후 터미널 창에서 다음 명령어를 실행합니다.
cd /path-to-traces-on-my-dev-machine && \
  adb pull /data/local/traces/ .
트레이스 형식 간 변환
Perfetto 트레이스 파일을 Systrace 형식으로 변환할 수 있습니다. 자세한 내용은 트레이스 형식 간 변환을(를) 참고하세요.
HTML 보고서 만들기
트레이스를 공유하는 경우 보고서 자체는 .perfetto-trace 파일(Android 10 및 이후 버전을 실행하는 기기) 또는 .ctrace 파일(모든 다른 버전)에 있습니다.
웹 기반 UI나 명령줄을 사용하여 트레이스 파일에서 HTML 보고서를 만들 수 있습니다.
웹 기반 UI
Perfetto UI를 사용하여 트레이스 파일을 열고 보고서를 생성합니다.
Perfetto 파일의 경우 Open trace file을 클릭합니다. Systrace 파일의 경우 Open with legacy UI를 클릭합니다. 기존 UI는 Systrace 보고서와 모양 및 느낌이 같습니다.
명령줄
터미널 창에서 다음 명령어를 실행하여 추적 파일에서 HTML 보고서를 생성합니다.
cd /path-to-traces-on-my-dev-machine && \
  systrace --from-file trace-file-name{.ctrace | .perfetto-trace}
systrace 명령줄 프로그램이 아직 없는 경우 GitHub의 Catapult 프로젝트에서 다운로드하거나 Android 오픈소스
프로젝트에서 직접 다운로드할 수 있습니다.
추천 서비스
- 참고: JavaScript가 사용 중지되어 있으면 링크 텍스트가 표시됩니다.
- 지속적 통합의 벤치마크
- 명령줄에서 시스템 트레이스 캡처