
建議您使用 Jetpack Macrobenchmark 測試應用程式在啟用基準設定檔時的效能,再將結果與停用基準設定檔時的基準值比較。藉由這種方式,您可以評估應用程式的啟動時間 (初始顯示和完整顯示時間),也可以評估執行階段轉譯效能 (瞭解產生的影格是否造成卡頓)。
您可以透過 Macrobenchmark 利用 CompilationMode API,控管預先評估編譯作業。使用不同的 CompilationMode 值,比較不同編譯狀態的效能。下列程式碼片段說明如何使用 CompilationMode 參數,評估基準設定檔的效益:
@RunWith(AndroidJUnit4ClassRunner::class)
class ColdStartupBenchmark {
    @get:Rule
    val benchmarkRule = MacrobenchmarkRule()

    // No ahead-of-time (AOT) compilation at all. Represents performance of a
    // fresh install on a user's device if you don't enable Baseline Profiles—
    // generally the worst case performance.
    @Test
    fun startupNoCompilation() = startup(CompilationMode.None())

    // Partial pre-compilation with Baseline Profiles. Represents performance of
    // a fresh install on a user's device.
    @Test
    fun startupPartialWithBaselineProfiles() =
        startup(CompilationMode.Partial(baselineProfileMode = BaselineProfileMode.Require))

    // Partial pre-compilation with some just-in-time (JIT) compilation.
    // Represents performance after some app usage.
    @Test
    fun startupPartialCompilation() = startup(
        CompilationMode.Partial(
            baselineProfileMode = BaselineProfileMode.Disable,
            warmupIteration = 3
        )
    )

    // Full pre-compilation. Generally not representative of real user
    // experience, but can yield more stable performance metrics by removing
    // noise from JIT compilation within benchmark runs.
    @Test
    fun startupFullCompilation() = startup(CompilationMode.Full())

    private fun startup(compilationMode: CompilationMode) = benchmarkRule.measureRepeated(
        packageName = "com.example.macrobenchmark.target",
        metrics = listOf(StartupTimingMetric()),
        compilationMode = compilationMode,
        iterations = 10,
        startupMode = StartupMode.COLD,
        setupBlock = {
            pressHome()
        }
    ) {
        uiAutomator {
            startApp(packageName)
            onElement(5_000) { viewIdResourceName == "my-content"}
        }
    }
}
您可以直接在 Android Studio 中查看結果,下方螢幕截圖便是在 Google Pixel 7 上執行 Now in Android 範例應用程式的結果畫面。如結果所示,使用基準設定檔能達到最快的應用程式啟動速度 (229.0 毫秒),優於未編譯時的速度 (324.8 毫秒)。
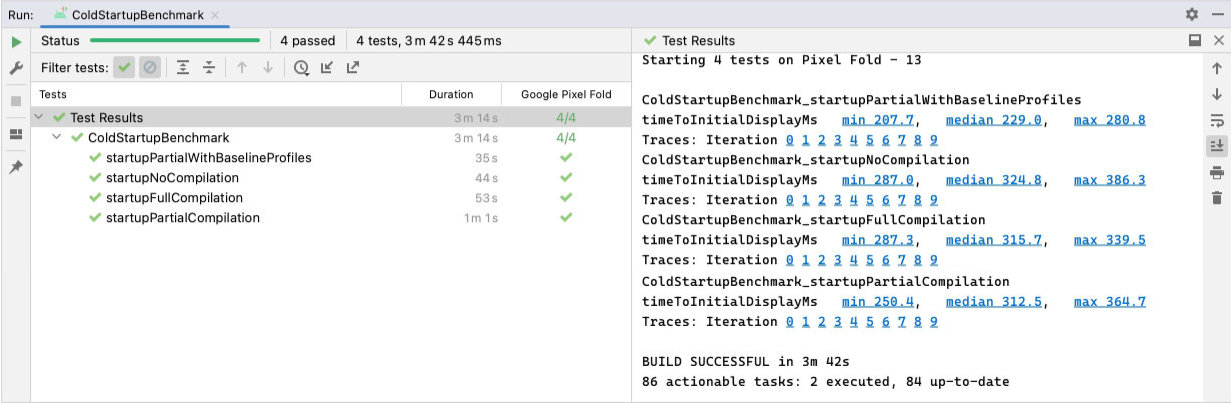
ColdStartupBenchmark 的結果顯示,在未編譯、完整編譯和部分編譯的情況下,初始顯示時間分別為 324 毫秒、315 毫秒和 312 毫秒;使用基準設定檔時,初始顯示時間則為 229 毫秒。雖然上述例子是利用 StartupTimingMetric 擷取的應用程式啟動結果,但您也應考慮其他重要指標,例如 FrameTimingMetric。如要進一步瞭解所有指標類型,請參閱「擷取 Macrobenchmark 指標」。
完整顯示時間
上述例子測量的是初始顯示時間 (TTID),也就是應用程式產生第一個影格所需的時間。不過,這並不一定能反映使用者開始與應用程式互動前的等候時間。因此,如要評估及提升讓應用程式狀態完整可用所需的程式碼路徑,就更適合使用完整顯示時間 (TTFD) 這項指標。
建議您同時最佳化 TTID 和 TTFD,因為兩者都很重要。如果 TTID 較短,使用者就能瞭解應用程式其實正在啟動。維持較短的 TTFD,則是確保使用者能快速與應用程式互動的關鍵。
如要瞭解應用程式 UI 繪製完成後的回報策略,請參閱「提高啟動時間準確度」。
為您推薦
- 注意:系統會在 JavaScript 關閉時顯示連結文字
- [編寫 Macrobenchmark][11]
- [擷取 Macrobenchmark 指標][12]
- 使用 UI Automator 編寫自動化測試
- [應用程式啟動分析與最佳化 {:#app-startup-analysis-optimization}][14]