
ثبت فعالیت دستگاه در یک دوره زمانی کوتاه، ردیابی سیستم نامیده میشود. ردیابی سیستم یک فایل ردیابی تولید میکند که میتوانید از آن برای تهیه گزارش سیستم استفاده کنید. این گزارش به شما کمک میکند تا بهترین روش برای بهبود عملکرد برنامه یا بازی خود را شناسایی کنید.
برای آشنایی جامع با ردیابی و پروفایلینگ، به صفحه ردیابی ۱۰۱ در مستندات Perfetto مراجعه کنید.
پلتفرم اندروید چندین گزینه مختلف برای ثبت ردپاها ارائه میدهد:
- ابزار پروفایل پردازنده و حافظه اندروید استودیو
- ابزار خط فرمان Perfetto (اندروید ۱۰ و بالاتر)
- ابزار ردیابی سیستم
- ابزار خط فرمان Systrace
ابزار پروفایل پردازنده اندروید استودیو، میزان استفاده از پردازنده و فعالیت نخهای برنامه شما را به صورت بلادرنگ و در حین تعامل شما با برنامه بررسی میکند. همچنین میتوانید جزئیات موجود در ردیابیهای متد، ردیابیهای تابع و ردیابیهای سیستم ثبت شده را بررسی کنید. ابزار پروفایل حافظه، نمای کلی از میزان استفاده از حافظه را در رابطه با رویدادهای لمسی، تغییرات Activity و رویدادهای جمعآوری زباله ارائه میدهد.
Perfetto ابزار ردیابی در سطح پلتفرم است که در اندروید ۱۰ معرفی شد. این یک پروژه ردیابی متنباز پیشرفته برای اندروید، لینوکس و کروم است. این ابزار در مقایسه با Systrace مجموعهای از منابع داده را ارائه میدهد و به شما امکان میدهد ردیابیهای طولانی دلخواه را در یک جریان دودویی بافر پروتکل ثبت کنید. میتوانید این ردیابیها را در رابط کاربری Perfetto باز کنید.
ابزار ردیابی سیستم (System traceing utility) یک ابزار اندرویدی است که فعالیت دستگاه را در یک فایل ردیابی ذخیره میکند. در دستگاهی که اندروید ۱۰ (سطح API 29) یا بالاتر را اجرا میکند، فایلهای ردیابی با فرمت Perfetto ذخیره میشوند، همانطور که در ادامه این سند نشان داده شده است. در دستگاهی که نسخههای قدیمیتر اندروید را اجرا میکند، فایلهای ردیابی با فرمت Systrace ذخیره میشوند.
Systrace یک ابزار خط فرمان ارائه شده توسط پلتفرم قدیمی است که فعالیت دستگاه را در یک دوره زمانی کوتاه در یک فایل متنی فشرده ثبت میکند. این ابزار گزارشی تولید میکند که دادههای هسته اندروید، مانند زمانبندی CPU، فعالیت دیسک و رشتههای برنامه را ترکیب میکند. Systrace روی تمام نسخههای پلتفرم اندروید کار میکند، اما ما Perfetto را برای دستگاههایی که اندروید ۱۰ و بالاتر دارند توصیه میکنیم.

شکل ۱. یک نمونه نمای ردیابی Perfetto، که حدود ۲۰ ثانیه از تعامل با یک برنامه را نشان میدهد.
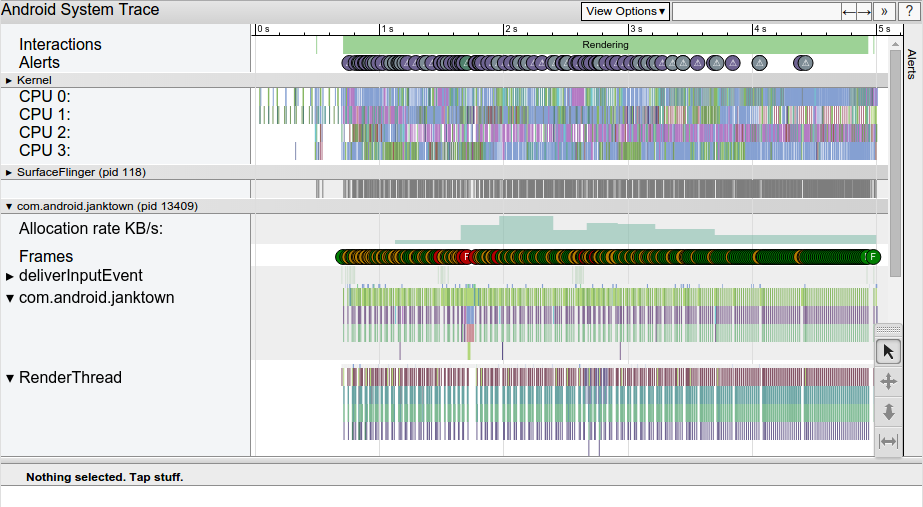
شکل ۲. یک نمونه گزارش HTML از Systrace، که پنج ثانیه از تعامل با یک برنامه را نشان میدهد.
هر دو گزارش، تصویری کلی از فرآیندهای سیستمی یک دستگاه اندرویدی را برای یک دوره زمانی مشخص ارائه میدهند. این گزارش همچنین اطلاعات ردیابی ضبطشده را بررسی میکند تا مشکلاتی را که مشاهده میکند، مانند کندی رابط کاربری یا مصرف بالای برق، برجسته کند.
Perfeto و Systrace با هم سازگار هستند:
- فایلهای Perfetto و Systrace را در رابط کاربری Perfetto باز کنید. فایلهای Systrace را با استفاده از نمایشگر قدیمی Systrace در رابط کاربری Perfetto و با کلیک روی لینک Open with legacy UI باز کنید.
- با استفاده از ابزار
traceconvیک مسیر Perfetto را به فرمت متنی قدیمی Systrace تبدیل کنید .
راهنماهای ردیابی سیستم
برای کسب اطلاعات بیشتر در مورد ابزارهای ردیابی سیستم، به راهنماهای زیر مراجعه کنید:
- بررسی فعالیت CPU با CPU Profiler
- نحوهی نمایش میزان استفاده از CPU و فعالیت نخهای برنامه در اندروید استودیو را نشان میدهد.
- ردیابی سیستم را روی یک دستگاه ضبط کنید
- توضیح میدهد که چگونه میتوان ردیابی سیستم را مستقیماً در هر دستگاهی که اندروید ۹ (سطح API 28) یا بالاتر را اجرا میکند، ثبت کرد.
- ردیابی سیستم را در خط فرمان ضبط کنید
- گزینهها و پرچمهای مختلفی را که میتوانید به رابط خط فرمان Systrace ارسال کنید، تعریف میکند.
- اجرای Perfetto با استفاده از adb
- نحوه اجرای ابزار خط فرمان
perfettoبرای ثبت ردپاها را شرح میدهد. - شروع سریع: ضبط ردپاها در اندروید
- مستندات خارجی که نحوه ساخت و اجرای ابزار خط فرمان
perfettoرا برای ثبت ردپاها شرح میدهد. - شروع سریع: ضبط ردپاها در اندروید
- نمایشگر ردیابی مبتنی بر وب Perfetto، ردیابیهای Perfetto را باز کرده و گزارش کاملی را نمایش میدهد. همچنین میتوانید ردیابیهای Systrace را در این نمایشگر با استفاده از گزینه رابط کاربری قدیمی باز کنید.
- پیمایش یک گزارش Systrace
- عناصر یک گزارش معمولی را فهرست میکند، میانبرهای صفحهکلید را برای پیمایش در گزارش ارائه میدهد و نحوه شناسایی انواع مشکلات عملکرد را شرح میدهد.
- تعریف رویدادهای سفارشی
- توضیح میدهد که چگونه میتوانید برچسبهای سفارشی را به بخشهای خاصی از کد خود اعمال کنید، که امکان تجزیه و تحلیل ریشهای آسانتر را در Systrace یا Perfetto فراهم میکند.
- از ویژگیهای تحلیل مبتنی بر هوش مصنوعی استفاده کنید
- توضیح میدهد که چگونه از ویژگیهای مبتنی بر هوش مصنوعی به همراه عامل هوش مصنوعی مورد نظر خود برای کاوش ردپاهای Perfetto و ساخت کوئریهای SQL سفارشی استفاده کنید.