
측정항목은 벤치마크에서 추출된 기본 정보 유형입니다. measureRepeated 함수에 List로 전달되므로 측정된 여러 측정항목을 한 번에 지정할 수 있습니다. 벤치마크를 실행하려면 측정항목 유형이 하나 이상 필요합니다.
다음 코드 스니펫은 프레임 타이밍 및 맞춤 트레이스 섹션 측정항목을 캡처합니다.
Kotlin
benchmarkRule.measureRepeated(
    packageName = TARGET_PACKAGE,
    metrics = listOf(
        FrameTimingMetric(),
        TraceSectionMetric("RV CreateView"),
        TraceSectionMetric("RV OnBindView"),
    ),
    iterations = 5,
    // ...
)
Java
benchmarkRule.measureRepeated(
    TARGET_PACKAGE,     // packageName
    Arrays.asList(      // metrics
        new StartupTimingMetric(),
        new TraceSectionMetric("RV CreateView"),
        new TraceSectionMetric("RV OnBindView"),
    ),
    5,                  // Iterations
    // ...
);
이 예에서 RV CreateView와 RV OnBindView는 RecyclerView에 정의된 추적 가능한 블록의 ID입니다. createViewHolder() 메서드의 소스 코드는 코드에서 추적 가능한 블록을 정의하는 방법을 보여주는 예가 됩니다.
StartupTimingMetric, TraceSectionMetric, FrameTimingMetric, PowerMetric에 관한 자세한 내용은 이 문서의 뒷부분에서 다룹니다.
측정항목의 전체 목록은 Metric의 서브클래스를 확인하세요.
벤치마크 결과는 그림 1과 같이 Android 스튜디오에 출력됩니다. 측정항목을 여러 개 정의하면 모두 출력에 결합됩니다.
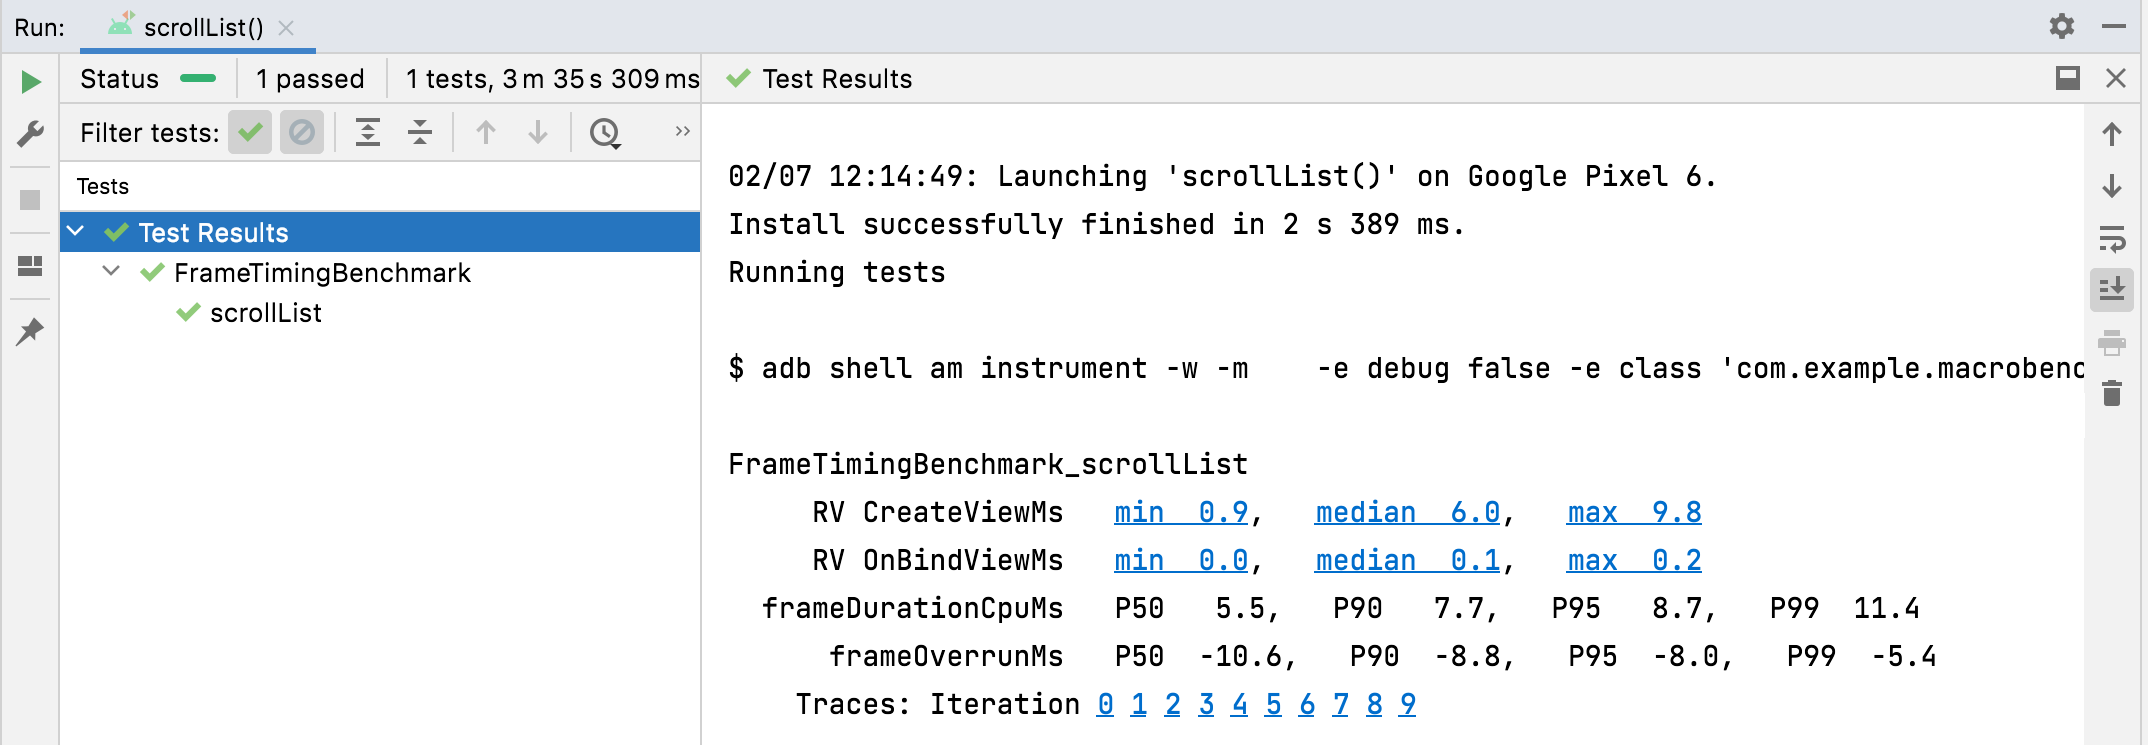
TraceSectionMetric 및 FrameTimingMetric의 결과StartupTimingMetric
StartupTimingMetric은 다음 값을 사용하여 앱 시작 시간 측정항목을 캡처합니다.
timeToInitialDisplayMs: 시스템이 시작 인텐트를 수신한 시점부터 대상Activity의 첫 번째 프레임을 렌더링하는 시점까지 걸린 시간입니다.timeToFullDisplayMs: 시스템이 시작 인텐트를 수신한 시점부터reportFullyDrawn()메서드를 사용하여 앱이 완전히 그려진 시점까지 걸린 시간입니다.reportFullyDrawn()호출 후(또는 해당 호출 포함) 첫 번째 프레임의 렌더링이 완료되면 측정이 중지됩니다. 이 측정은 Android 10(API 수준 29) 및 이전 버전에서는 사용하지 못할 수도 있습니다.
StartupTimingMetric은 시작 반복에서 최솟값, 중앙값, 최댓값을 출력합니다. 시작 개선을 평가하려면 중앙값에 집중해야 합니다. 중앙값으로 일반적인 시작 시간 추정치를 가장 잘 알 수 있기 때문입니다. 앱 시작 시간에 기여하는 요소에 관한 자세한 내용은 앱 시작 시간을 참고하세요.
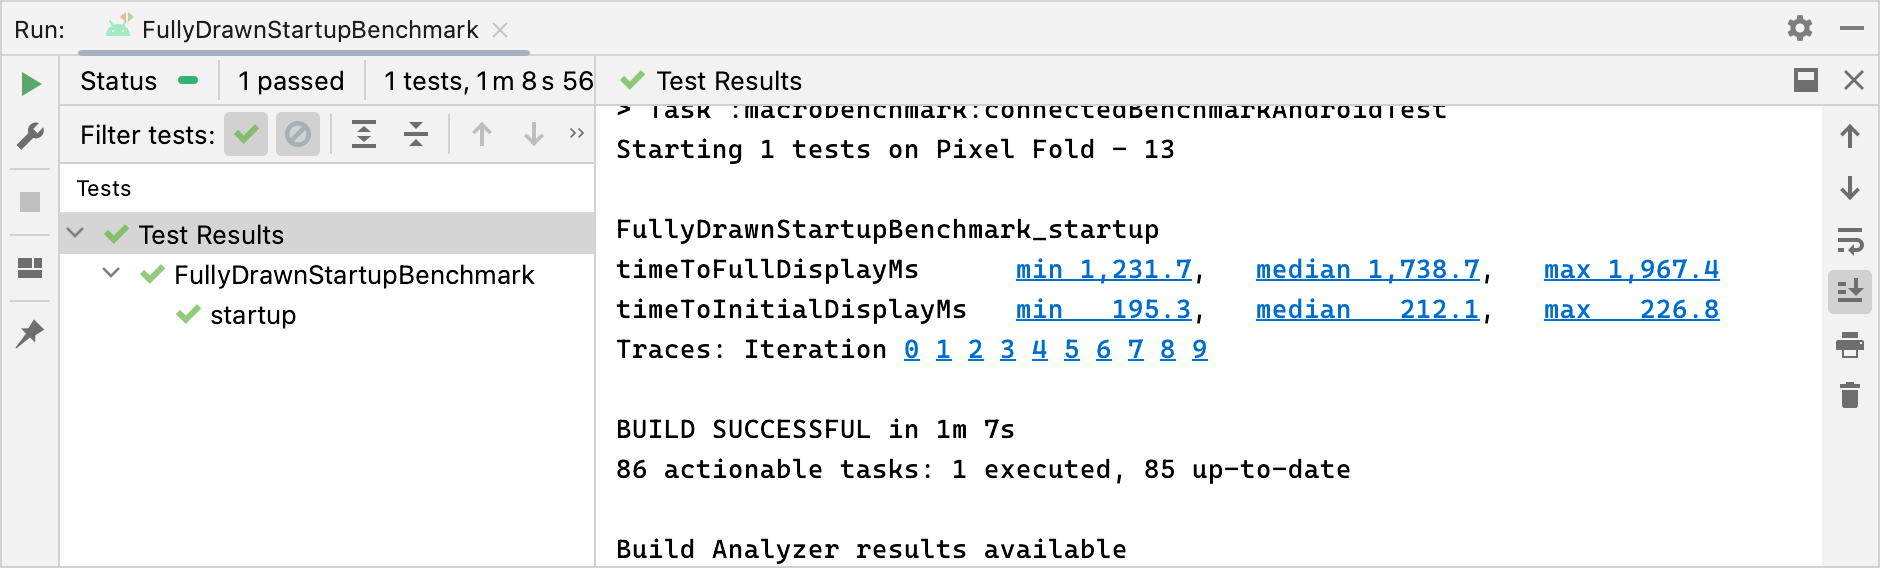
StartupTimingMetric 결과FrameTimingMetric
FrameTimingMetric은 벤치마크에서 생성된 프레임의 타이밍 정보(예: 스크롤 또는 애니메이션)를 캡처하고 다음 값을 출력합니다.
frameOverrunMs: 주어진 프레임이 기한을 넘긴 시간입니다. 양수는 드롭된 프레임과 눈에 보이는 버벅거림/끊김 현상을 나타냅니다. 음수는 프레임이 기한보다 얼마나 빠른지 나타냅니다. 참고: 이 기능은 Android 12(API 수준 31) 및 이후 버전에서만 사용할 수 있습니다.frameDurationCpuMs: CPU에서 UI 스레드와RenderThread에서 프레임이 생성되는 데 걸린 시간입니다.
이러한 측정값은 50번째, 90번째, 95번째, 99번째 백분위수로 분포되어 수집됩니다.
느린 프레임을 식별하고 개선하는 방법에 관한 자세한 내용은 느린 렌더링을 참고하세요.
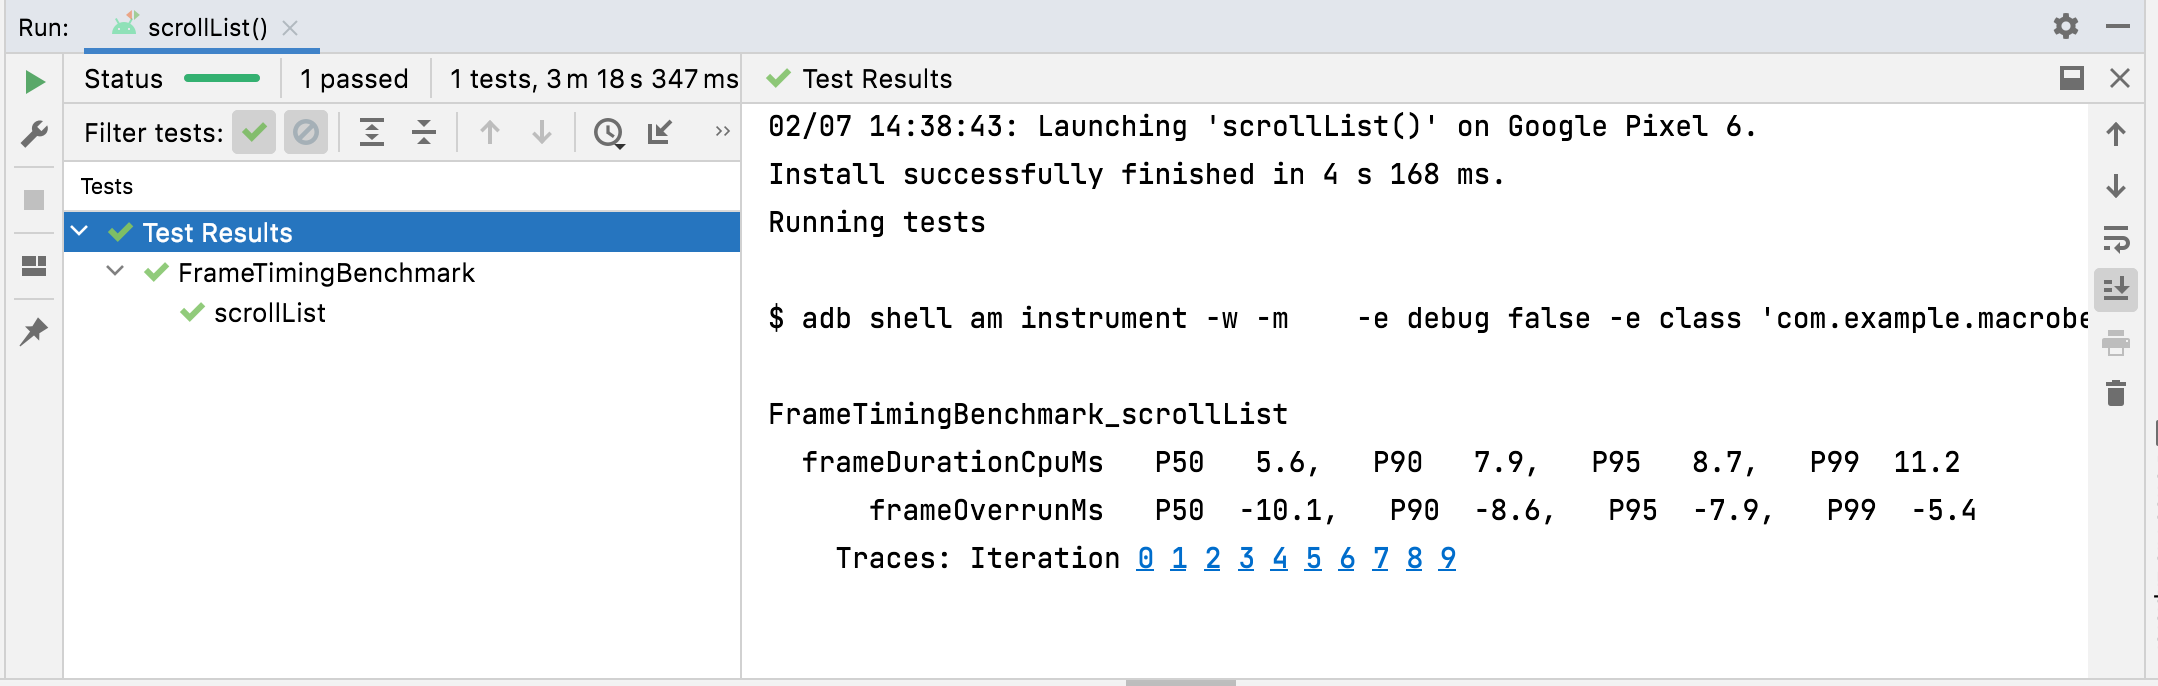
FrameTimingMetric 결과TraceSectionMetric
TraceSectionMetric은 트레이스 섹션이 제공된 sectionName과 일치하는 횟수와 소요된 시간을 캡처합니다. 시간의 경우 최소 시간, 중앙값, 최대 시간을 밀리초 단위로 출력합니다. 트레이스 섹션은 trace(sectionName) 함수 호출로 정의되거나 Trace.beginSection(sectionName) 및 Trace.endSection() 사이의 코드 또는 비동기 변형으로 정의됩니다. 이 섹션은 측정 중에 캡처된 트레이스 섹션의 첫 번째 인스턴스를 항상 선택합니다. 기본적으로 패키지의 트레이스 섹션만 출력합니다. 패키지 외부의 프로세스를 포함하려면 targetPackageOnly = false를 설정하세요.
추적에 관한 자세한 내용은 시스템 추적 개요 및 맞춤 이벤트 정의를 참고하세요.
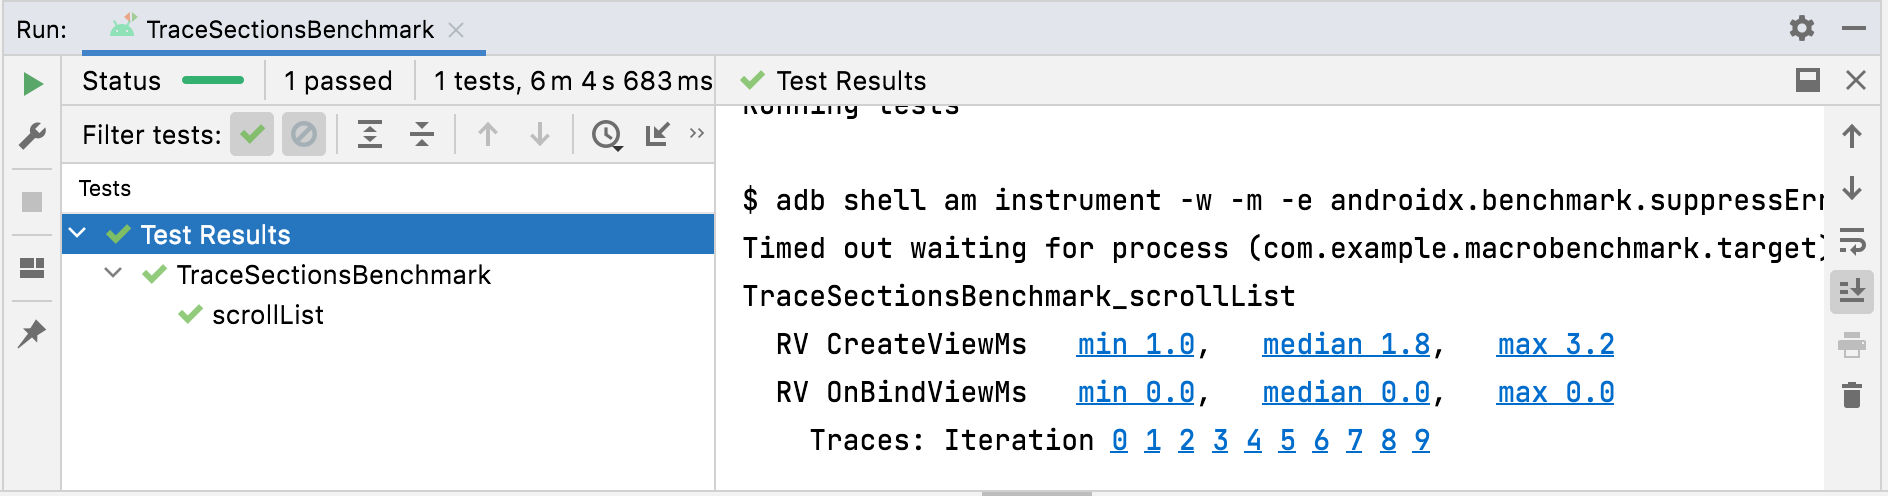
TraceSectionMetric 결과PowerMetric
PowerMetric은 제공된 전원 카테고리에 대해 테스트 기간 동안 전력 또는 에너지의 변화를 캡처합니다.
선택된 각 카테고리는 측정 가능한 하위 구성요소로 분류되는 반면 선택되지 않은 카테고리는 '선택 해제됨' 측정항목에 추가됩니다.
이러한 측정항목은 앱별 소비량이 아닌 시스템 전체 소비를 측정하며 Pixel 6, Pixel 6 Pro 및 이후 버전 기기로 제한됩니다.
power<category>Uw: 이 카테고리에서 테스트 기간 동안 소모된 전력량입니다.energy<category>Uws: 이 카테고리에서 테스트 기간 동안 시간 단위당 전송된 에너지의 양입니다.
카테고리에는 다음이 포함됩니다.
CPUDISPLAYGPUGPSMEMORYMACHINE_LEARNINGNETWORKUNCATEGORIZED
CPU와 같은 일부 카테고리에서는 다른 프로세스에서 실행한 작업과 자체 앱에서 실행한 작업을 구분하기 어려울 수 있습니다. 간섭을 최소화하려면 불필요한 앱과 계정을 삭제하거나 제한하세요.
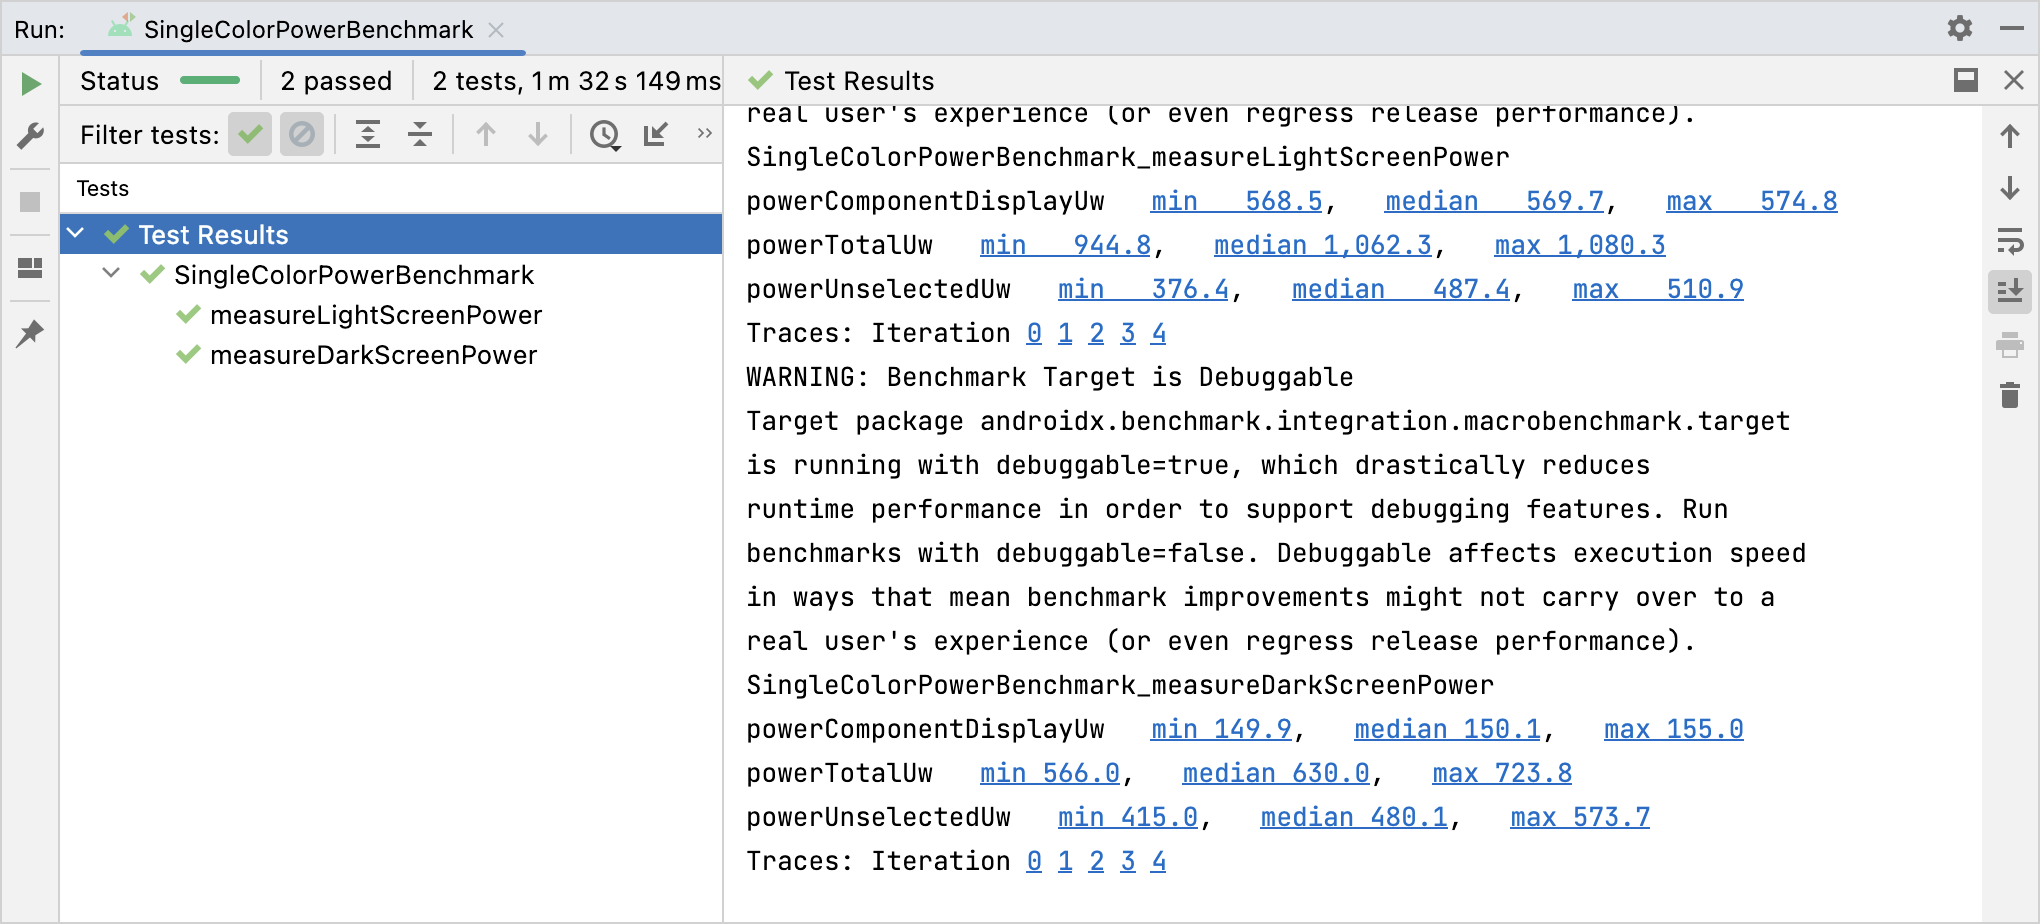
PowerMetric 결과추천 서비스
- 참고: JavaScript가 사용 중지되어 있으면 링크 텍스트가 표시됩니다.
- 기준 프로필 만들기{:#creating-profile-rules}
- Macrobenchmark 작성
- 앱 시작 분석 및 최적화{:#app-startup-analysis-optimization}