
我们建议使用 Jetpack Macrobenchmark 来测试在启用基准配置文件的情况下应用的性能,然后将这些结果与停用基准配置文件的基准进行比较。通过这种方法,您可以测量应用启动时间(初始显示所用时间和完全显示所用时间)或运行时渲染性能,以了解生成的帧是否会导致卡顿。
借助 Macrobenchmark,您可以通过 CompilationMode API 控制预测量编译。使用不同的 CompilationMode 值来比较不同编译状态下的性能。以下代码段展示了如何使用 CompilationMode 参数来衡量基准配置文件的益处:
@RunWith(AndroidJUnit4ClassRunner::class)
class ColdStartupBenchmark {
    @get:Rule
    val benchmarkRule = MacrobenchmarkRule()

    // No ahead-of-time (AOT) compilation at all. Represents performance of a
    // fresh install on a user's device if you don't enable Baseline Profiles—
    // generally the worst case performance.
    @Test
    fun startupNoCompilation() = startup(CompilationMode.None())

    // Partial pre-compilation with Baseline Profiles. Represents performance of
    // a fresh install on a user's device.
    @Test
    fun startupPartialWithBaselineProfiles() =
        startup(CompilationMode.Partial(baselineProfileMode = BaselineProfileMode.Require))

    // Partial pre-compilation with some just-in-time (JIT) compilation.
    // Represents performance after some app usage.
    @Test
    fun startupPartialCompilation() = startup(
        CompilationMode.Partial(
            baselineProfileMode = BaselineProfileMode.Disable,
            warmupIteration = 3
        )
    )

    // Full pre-compilation. Generally not representative of real user
    // experience, but can yield more stable performance metrics by removing
    // noise from JIT compilation within benchmark runs.
    @Test
    fun startupFullCompilation() = startup(CompilationMode.Full())

    private fun startup(compilationMode: CompilationMode) = benchmarkRule.measureRepeated(
        packageName = "com.example.macrobenchmark.target",
        metrics = listOf(StartupTimingMetric()),
        compilationMode = compilationMode,
        iterations = 10,
        startupMode = StartupMode.COLD,
        setupBlock = {
            pressHome()
        }
    ) {
        uiAutomator {
            startApp(packageName)
            onElement(5_000) { viewIdResourceName == "my-content"}
        }
    }
}
在下面的屏幕截图中,您可以直接在 Android Studio 中查看 Google Pixel 7 上运行的 Now in Android 示例应用的结果。结果表明,与未编译时应用启动时间(324.8 毫秒)相比,当使用基准配置文件时应用的启动时间最短(229.0 毫秒)。
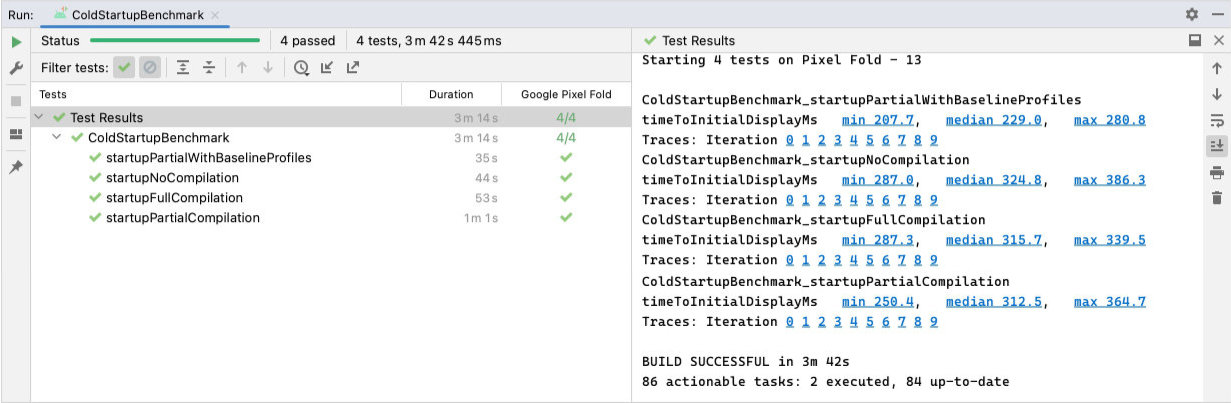
ColdStartupBenchmark 的结果,其中显示未编译(324 毫秒)、完整编译(315 毫秒)、部分编译(312 毫秒)和采用基准配置文件(229 毫秒)情况下的初始显示所用时间。虽然前面的示例显示的是使用 StartupTimingMetric 捕获的应用启动结果,但还有一些其他重要指标值得考虑,例如 FrameTimingMetric。如需详细了解所有类型的指标,请参阅捕获 Macrobenchmark 指标。
完全显示所用时间
前面的示例测量了初始显示所用时间 (TTID),这是指应用生成第一帧所用的时间。不过,这不一定反映您的应用启动直至用户可开始与应用互动之间的时间。完全显示所用时间 (TTFD) 指标在测量和优化拥有完全可用应用状态所需的代码路径方面更为有用。
我们建议您针对 TTID 和 TTFD 进行优化,因为两者都很重要。较短的 TTID 有助于用户看到应用是真的在启动。保持较短的 TTFD 对于帮助确保用户能够快速与应用互动非常重要。
如需了解在应用界面完全绘制后的报告策略,请参阅提高启动时间精确度。
为您推荐
- 注意:当 JavaScript 处于关闭状态时,系统会显示链接文字
- [编写 Macrobenchmark][11]
- [捕获 Macrobenchmark 指标][12]
- 使用 UI Automator 编写自动化测试
- [应用启动分析和优化 {:#app-startup-analysis-optimization}][14]