Macrobenchmark では、CompilationMode API を使用して、測定前のコンパイルを制御できます。CompilationMode のさまざまな値を使用して、さまざまなコンパイル状態のパフォーマンスを比較します。次のコード スニペットは、CompilationMode パラメータを使用してベースライン プロファイルのメリットを測定する方法を示しています。
@RunWith(AndroidJUnit4ClassRunner::class)classColdStartupBenchmark{@get:RulevalbenchmarkRule=MacrobenchmarkRule()// No ahead-of-time (AOT) compilation at all. Represents performance of a// fresh install on a user's device if you don't enable Baseline Profiles—// generally the worst case performance.@TestfunstartupNoCompilation()=startup(CompilationMode.None())// Partial pre-compilation with Baseline Profiles. Represents performance of// a fresh install on a user's device.@TestfunstartupPartialWithBaselineProfiles()=startup(CompilationMode.Partial(baselineProfileMode=BaselineProfileMode.Require))// Partial pre-compilation with some just-in-time (JIT) compilation.// Represents performance after some app usage.@TestfunstartupPartialCompilation()=startup(CompilationMode.Partial(baselineProfileMode=BaselineProfileMode.Disable,warmupIteration=3))// Full pre-compilation. Generally not representative of real user// experience, but can yield more stable performance metrics by removing// noise from JIT compilation within benchmark runs.@TestfunstartupFullCompilation()=startup(CompilationMode.Full())privatefunstartup(compilationMode:CompilationMode)=benchmarkRule.measureRepeated(packageName="com.example.macrobenchmark.target",metrics=listOf(StartupTimingMetric()),compilationMode=compilationMode,iterations=10,startupMode=StartupMode.COLD,setupBlock={pressHome()}){// Waits for the first rendered frame, which represents time to initial display.startActivityAndWait()// Waits for content to be visible, which represents time to fully drawn.device.wait(Until.hasObject(By.res("my-content")),5_000)}}
次のスクリーンショットでは、Google Pixel 7 で実行された Now in Android サンプルアプリの結果を Android Studio で直接確認できます。この結果から、コンパイルなし(324.8 ms)とは対照的に、ベースライン プロファイルを使用した場合にアプリは最速で起動する(229.0 ms)ことがわかります。
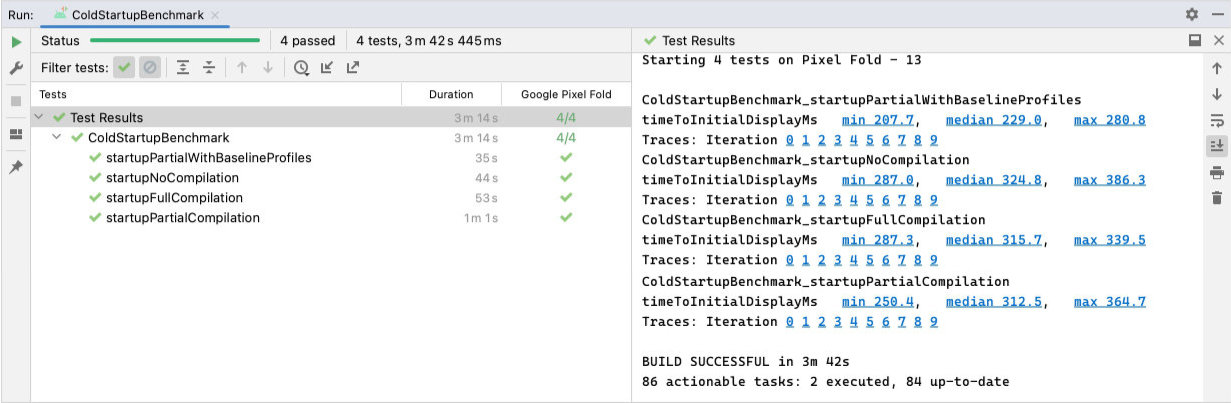
[[["わかりやすい","easyToUnderstand","thumb-up"],["問題の解決に役立った","solvedMyProblem","thumb-up"],["その他","otherUp","thumb-up"]],[["必要な情報がない","missingTheInformationINeed","thumb-down"],["複雑すぎる / 手順が多すぎる","tooComplicatedTooManySteps","thumb-down"],["最新ではない","outOfDate","thumb-down"],["翻訳に関する問題","translationIssue","thumb-down"],["サンプル / コードに問題がある","samplesCodeIssue","thumb-down"],["その他","otherDown","thumb-down"]],["最終更新日 2025-08-27 UTC。"],[],[],null,["We recommend using [Jetpack Macrobenchmark](/topic/performance/benchmarking/macrobenchmark-overview) to test how an app performs when\nBaseline Profiles are enabled, and then compare those results to a benchmark\nwith Baseline Profiles disabled. With this approach, you can measure app startup\ntime---both time to initial and full display---or runtime rendering\nperformance to see if the frames produced can cause jank.\n\nMacrobenchmarks let you control pre-measurement compilation using the\n[`CompilationMode`](/reference/androidx/benchmark/macro/CompilationMode) API. Use different `CompilationMode` values to compare\nperformance with different compilation states. The following code snippet shows\nhow to use the `CompilationMode` parameter to measure the benefit of Baseline\nProfiles: \n\n```kotlin\n@RunWith(AndroidJUnit4ClassRunner::class)\nclass ColdStartupBenchmark {\n @get:Rule\n val benchmarkRule = MacrobenchmarkRule()\n\n // No ahead-of-time (AOT) compilation at all. Represents performance of a\n // fresh install on a user's device if you don't enable Baseline Profiles---\n // generally the worst case performance.\n @Test\n fun startupNoCompilation() = startup(CompilationMode.None())\n\n // Partial pre-compilation with Baseline Profiles. Represents performance of\n // a fresh install on a user's device.\n @Test\n fun startupPartialWithBaselineProfiles() =\n startup(CompilationMode.Partial(baselineProfileMode = BaselineProfileMode.Require))\n\n // Partial pre-compilation with some just-in-time (JIT) compilation.\n // Represents performance after some app usage.\n @Test\n fun startupPartialCompilation() = startup(\n CompilationMode.Partial(\n baselineProfileMode = BaselineProfileMode.Disable,\n warmupIteration = 3\n )\n )\n\n // Full pre-compilation. Generally not representative of real user\n // experience, but can yield more stable performance metrics by removing\n // noise from JIT compilation within benchmark runs.\n @Test\n fun startupFullCompilation() = startup(CompilationMode.Full())\n\n private fun startup(compilationMode: CompilationMode) = benchmarkRule.measureRepeated(\n packageName = \"com.example.macrobenchmark.target\",\n metrics = listOf(StartupTimingMetric()),\n compilationMode = compilationMode,\n iterations = 10,\n startupMode = StartupMode.COLD,\n setupBlock = {\n pressHome()\n }\n ) {\n // Waits for the first rendered frame, which represents time to initial display.\n startActivityAndWait()\n\n // Waits for content to be visible, which represents time to fully drawn.\n device.wait(Until.hasObject(By.res(\"my-content\")), 5_000)\n }\n}\n```\n| **Caution:** Run the benchmarks on a physical device to measure real world performance. Measuring performance on an Android emulator likely provides incorrect results, because resources are shared with its hosting machine.\n\nIn the following screenshot, you can see the results directly in Android Studio\nfor the [Now in Android sample](https://goo.gle/nia) app ran on Google Pixel 7. The\nresults show that app startup is fastest when using Baseline Profiles\n(**229.0ms** ) in contrast with no compilation (**324.8ms**).\n**Figure 1.** Results of `ColdStartupBenchmark` showing time to initial display for no compilation (324ms), full compilation (315ms), partial compilation (312ms), and Baseline Profiles (229ms). **Tip:** You can also retrieve the results as a JSON file to parse them as part of your CI pipeline. For more information, see [Benchmarking in CI](/topic/performance/benchmarking/benchmarking-in-ci).\n\nWhile the previous example shows app startup results captured with\n[`StartupTimingMetric`](/reference/androidx/benchmark/macro/StartupTimingMetric), there are other important metrics worth considering,\nsuch as [`FrameTimingMetric`](/reference/androidx/benchmark/macro/FrameTimingMetric). For more information about all the types of\nmetrics, see [Capture Macrobenchmark metrics](/topic/performance/benchmarking/macrobenchmark-metrics).\n\nTime to full display\n\nThe previous example measures the [time to initial display](/topic/performance/vitals/launch-time#time-initial) (TTID), which is\nthe time taken by the app to produce its first frame. However, this doesn't\nnecessarily reflect the time until the user can start interacting with your app.\nThe [time to full display](/topic/performance/vitals/launch-time#time-full) (TTFD) metric is more useful in measuring and\noptimizing the code paths necessary to have a fully useable app state.\n\nWe recommend optimizing for both TTID and TTFD, as both are important. A low\nTTID helps the user see that the app is actually launching. Keeping the TTFD\nshort is important to help ensure that the user can interact with the app\nquickly.\n\nFor strategies on reporting when the app UI is fully drawn, see [Improve\nstartup timing accuracy](/topic/performance/benchmarking/macrobenchmark-metrics#startup-accuracy).\n\nRecommended for you\n\n- Note: link text is displayed when JavaScript is off\n- \\[Write a Macrobenchmark\\]\\[11\\]\n- \\[Capture Macrobenchmark metrics\\]\\[12\\]\n- \\[App startup analysis and optimization {:#app-startup-analysis-optimization}\\]\\[13\\]"]]