Applicable XR devices
This guidance helps you build experiences for these types of XR devices.
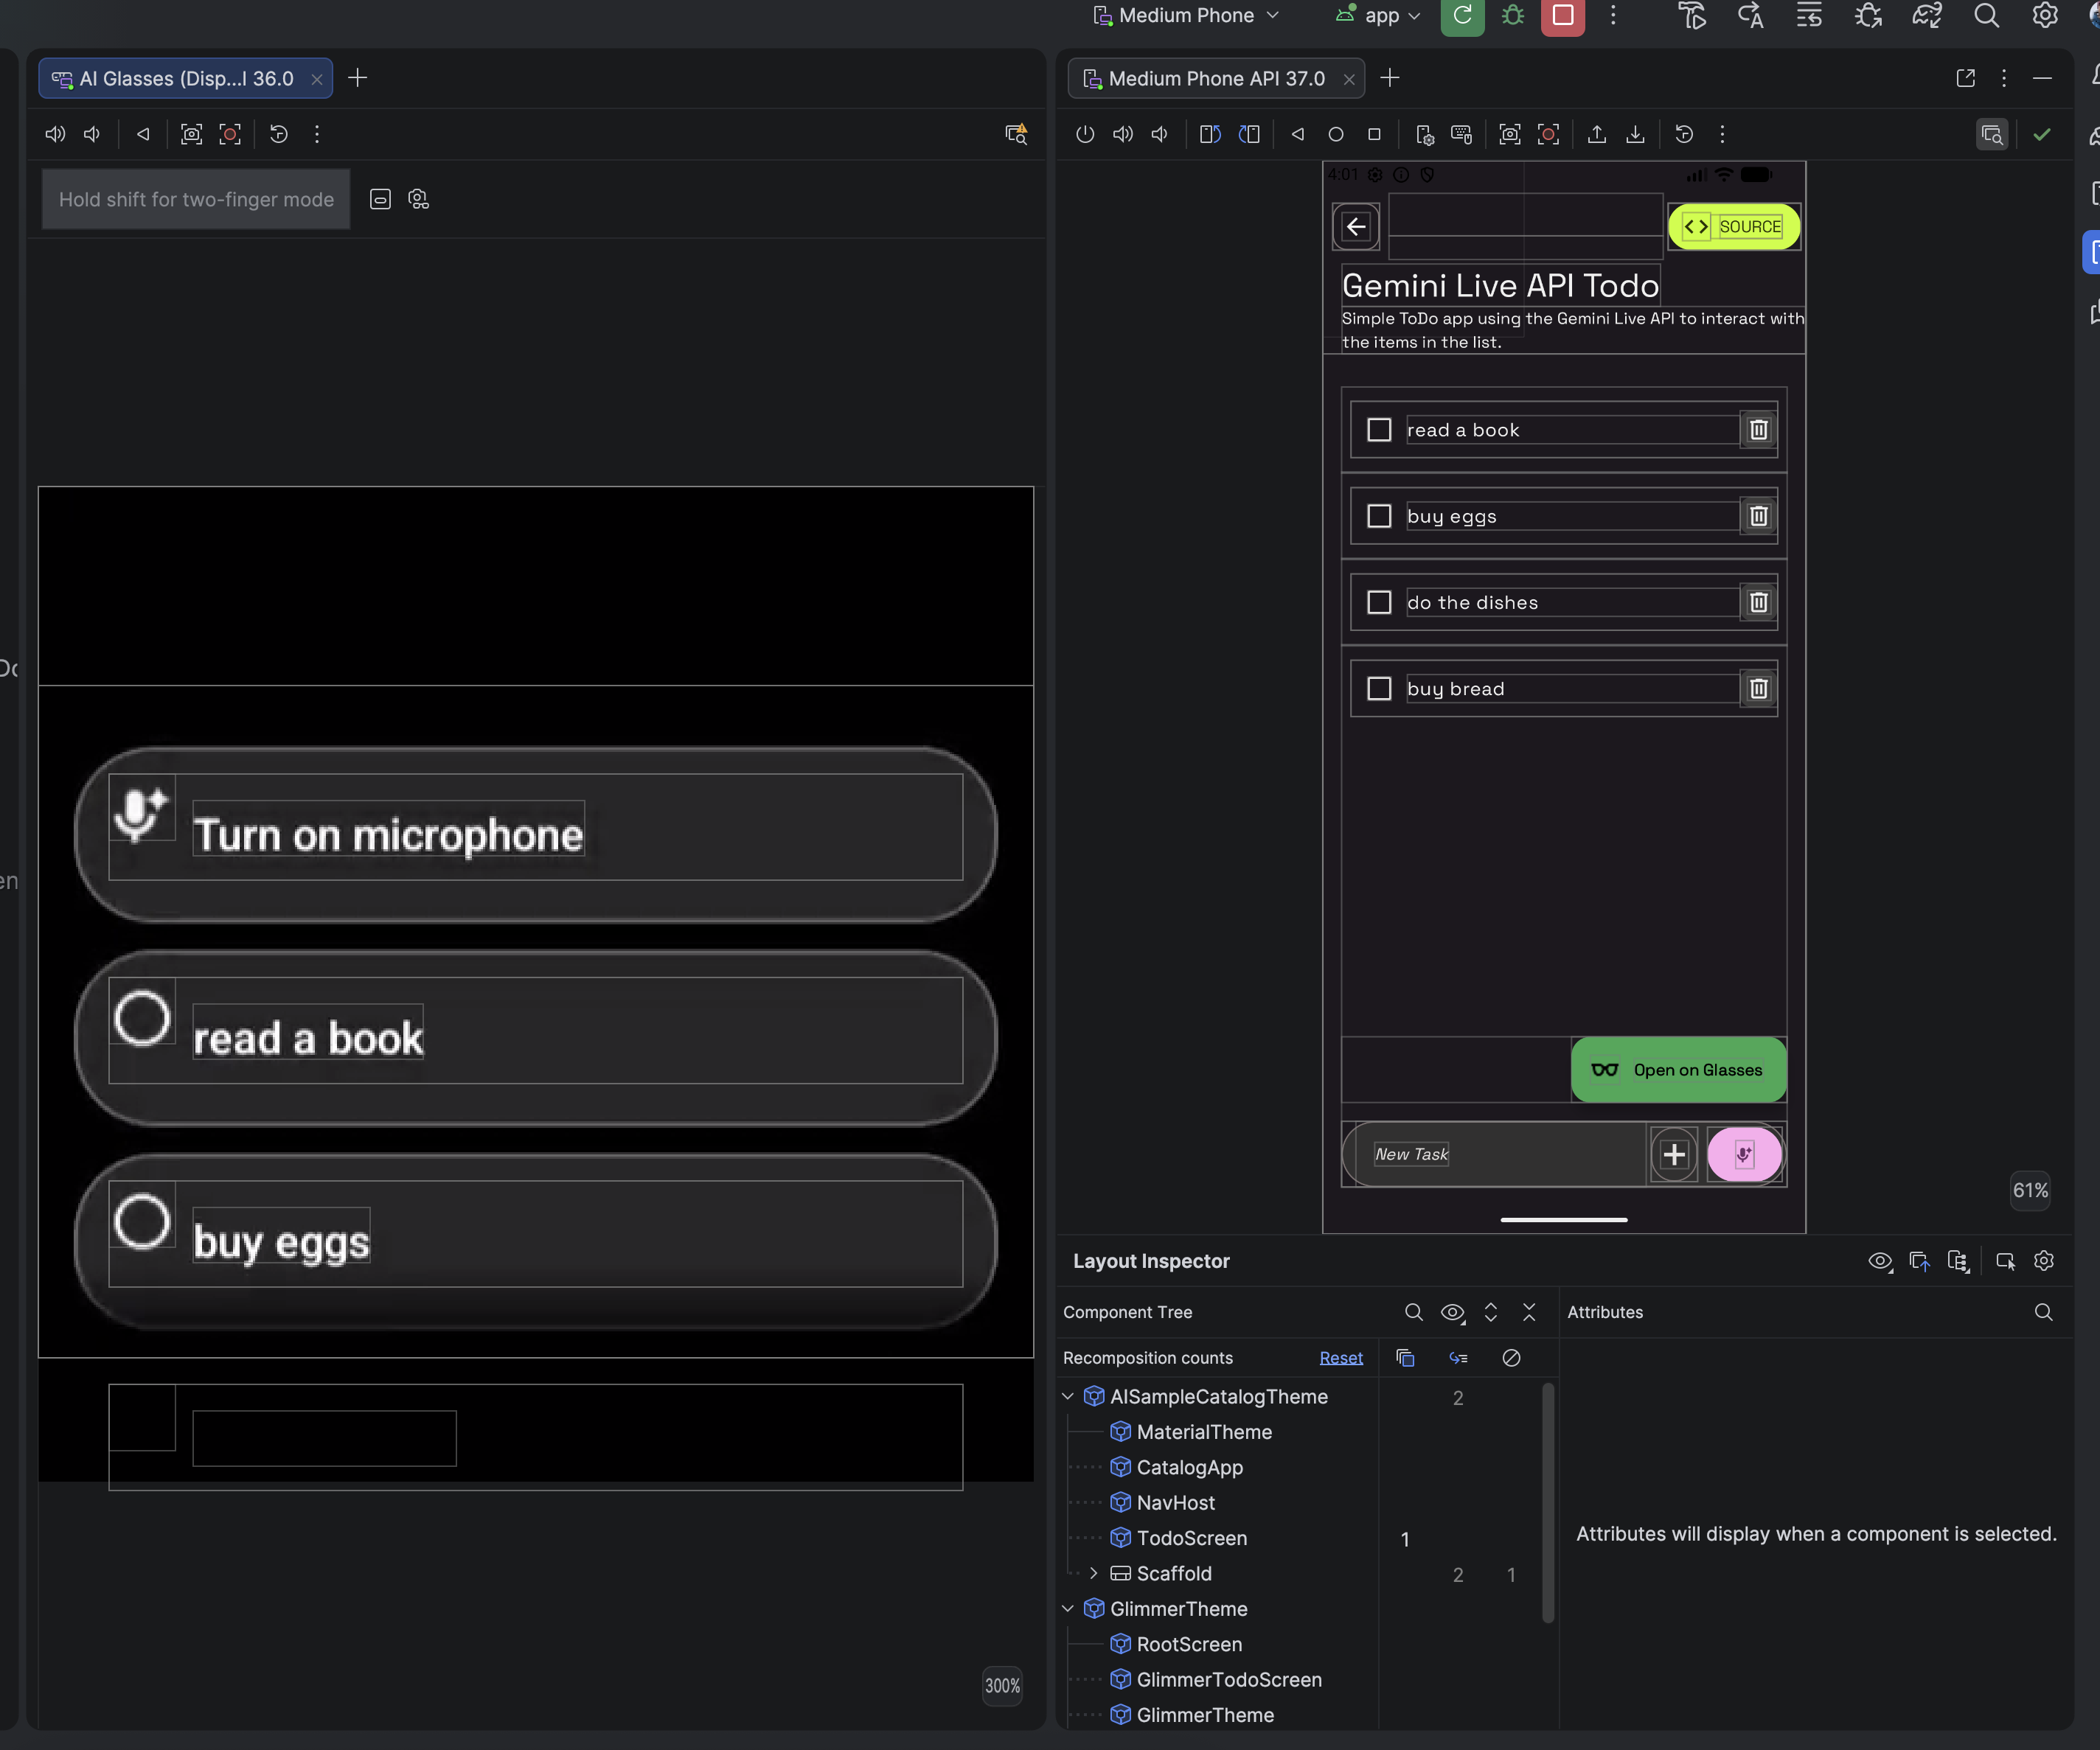
While you're building augmented experiences with Jetpack Compose Glimmer components for display glasses, you can inspect and debug your layout with the Layout Inspector in Android Studio.
Open the Layout Inspector
- In Android Studio, run your app.
When you see a screen you want to inspect, select Tools > Layout Inspector from the menu bar.
The Layout Inspector opens, along with the Attributes and the Component Tree subpanels.
In the Component Tree, find the UI component for the display glasses. Click the component to inspect its attributes.
Inspect component attributes
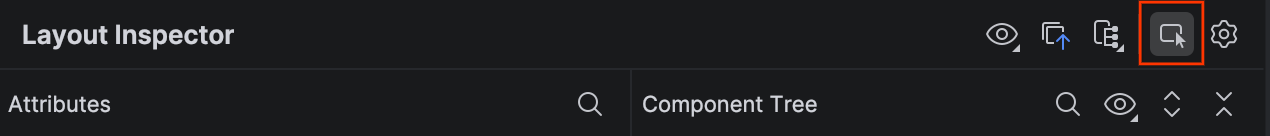
As you interact with your app, click Toggle Deep Inspect to select a component directly on the emulated devices. All of the layout attributes for a selected component appear in the Attributes panel.