
Eine Android-App stürzt immer dann ab, wenn ein unerwarteter Beenden durch eine
unbehandelte Ausnahme oder ein unbehandeltes Signal. Apps, die mit Java oder Kotlin geschrieben wurden
stürzt ab, wenn eine unbehandelte Ausnahme ausgelöst wird, dargestellt durch den
Klasse Throwable. Eine
App, die mit Maschinencode oder C++ geschrieben wurde, stürzt ab, wenn eine unbehandelte
wie SIGSEGV, während der Ausführung erfolgt.
Wenn eine App abstürzt, beendet Android den App-Prozess und zeigt ein Dialogfeld an. um den Nutzer darüber zu informieren, dass die App beendet wurde (siehe Abbildung 1).

Abbildung 1: App-Absturz auf einem Android-Gerät
Eine App muss nicht im Vordergrund ausgeführt werden, damit sie abstürzt. Beliebige App Komponenten, sogar Komponenten wie Übertragungsempfänger oder Contentanbieter, die im Hintergrund ausgeführt werden, kann zum Absturz einer App führen. Diese Abstürze sind Nutzer verwirren häufig, weil sie nicht aktiv mit Ihrer App interagiert haben.
Wenn bei Ihrer App Abstürze auftreten, können Sie anhand der Anleitung auf dieser Seite Folgendes tun: Problem zu diagnostizieren und zu beheben.
Problem erkennen
Sie wissen möglicherweise nicht immer, dass es bei Ihren Nutzern zu Abstürzen kommt, wenn verwenden. Wenn Sie Ihre App bereits veröffentlicht haben, können Sie Android Vitals, um die Absturzraten deiner App zu sehen.
Android Vitals
Mit Android Vitals kannst du die Absturzrate deiner App im Blick behalten und verbessern. In Android Vitals werden verschiedene Absturzraten gemessen:
- Absturzrate:Der Prozentsatz der aktiven Nutzer pro Tag, die dass es zu einem Absturz kommt.
Vom Nutzer wahrgenommene Absturzrate:Prozentsatz der aktiven Nutzer pro Tag bei denen bei der aktiven Nutzung deiner App mindestens ein Absturz aufgetreten ist (ein vom Nutzer wahrgenommener Absturz). Eine App gilt als aktiv genutzt. ob dort Aktivitäten angezeigt oder Dienst im Vordergrund.
Mehrfachabsturzrate:Der Prozentsatz der aktiven Nutzer pro Tag, die mindestens zwei Abstürze aufgetreten.
Ein aktiver Nutzer pro Tag ist ein einzelner Nutzer, der Ihre App verwendet. an einem einzigen Tag und auf einem einzigen Gerät durchführen, möglicherweise über mehrere Sitzungen hinweg. Verwendet ein Nutzer Ihre App an einem Tag auf mehreren Geräten, wie jedes Gerät zur Anzahl der aktiven Nutzer am jeweiligen Tag beiträgt. Wenn mehrere Nutzer dasselbe Gerät an einem Tag verwenden, zählt das als ein aktiver Nutzer.
Die vom Nutzer wahrgenommene Absturzrate ist ein Vitalwert, was bedeutet, dass sie Sichtbarkeit deiner App bei Google Play. Es ist wichtig, weil die Abstürze werden immer dann gezählt, wenn der Nutzer mit der App interagiert, Störungen.
Google Play hat für diesen Messwert zwei Grenzwerte zu unerwünschtem Verhalten definiert:
- Grenzwert zu unerwünschtem Verhalten insgesamt:Mindestens 1,09% der aktiven Nutzer pro Tag auf allen Gerätemodellen einen vom Nutzer wahrgenommenen Absturz wahrnehmen.
- Grenzwert zu unerwünschtem Verhalten pro Gerät:Mindestens 8% der aktiven Nutzer pro Tag einen vom Nutzer wahrgenommenen Absturz bei einem einzelnen Gerätemodell verursachen.
Überschreitet Ihre App den Grenzwert zu unerwünschtem Verhalten insgesamt, ist es höchstwahrscheinlich auf allen Geräten weniger gut sichtbar sind. Wenn deine App das unerwünschte Verhalten pro Gerät überschreitet auf einigen Geräten wahrscheinlich weniger gut sichtbar ist, Außerdem wird in deinem Store-Eintrag möglicherweise eine Warnung angezeigt.
Android Vitals informiert dich über die Play Console Wenn Ihre App übermäßige Abstürze verursacht.
Informationen dazu, wie Google Play Android Vitals-Daten erhebt, findest du in den Play Console Dokumentation.
Abstürze diagnostizieren
Sobald Sie festgestellt haben, dass Ihre App Abstürze meldet, besteht der nächste Schritt darin, sie zu diagnostizieren. Die Lösung von Abstürzen kann schwierig sein. Wenn Sie jedoch die Grundursache eines können Sie höchstwahrscheinlich eine Lösung finden.
Es gibt viele Situationen, die zu einem Absturz Ihrer App führen können. Einige Gründe sind wie die Überprüfung auf einen NULL-Wert oder einen leeren String, subtil sein, z. B. das Übergeben ungültiger Argumente an eine API oder komplexe Multithread- Interaktionen.
Abstürze unter Android erzeugen einen Stacktrace, der eine Momentaufnahme verschachtelte Funktionen, die bis zum Absturz in Ihrem Programm aufgerufen wurden. Sie können Absturz-Stacktraces ansehen in Android Vitals
Stacktrace lesen
Um einen Absturz zu beheben, müssen Sie zuerst herausfinden, wo er aufgetreten ist. Sie können Verwenden Sie den Stacktrace in den Berichtsdetails, wenn Sie Google Play verwenden Konsole oder die Ausgabe des logcat-Tools Wenn Sie Stacktrace nicht verfügbar ist, sollten Sie den Absturz lokal reproduzieren, entweder durch manuelles Testen der App oder durch Kontaktaufnahme mit den betroffenen Nutzern und mit Logcat reproduzieren.
Der folgende Trace zeigt ein Beispiel für einen Absturz bei einer Anwendung, die mit dem Java-Code geschrieben wurde. Programmiersprache:
--------- beginning of crash
AndroidRuntime: FATAL EXCEPTION: main
Process: com.android.developer.crashsample, PID: 3686
java.lang.NullPointerException: crash sample
at com.android.developer.crashsample.MainActivity$1.onClick(MainActivity.java:27)
at android.view.View.performClick(View.java:6134)
at android.view.View$PerformClick.run(View.java:23965)
at android.os.Handler.handleCallback(Handler.java:751)
at android.os.Handler.dispatchMessage(Handler.java:95)
at android.os.Looper.loop(Looper.java:156)
at android.app.ActivityThread.main(ActivityThread.java:6440)
at java.lang.reflect.Method.invoke(Native Method)
at com.android.internal.os.Zygote$MethodAndArgsCaller.run(Zygote.java:240)
at com.android.internal.os.ZygoteInit.main(ZygoteInit.java:746)
--------- beginning of system
Ein Stacktrace enthält zwei Informationen, die für das Debugging eines Absturz:
- Der Typ der ausgelösten Ausnahme.
- Der Codeabschnitt, in dem die Ausnahme ausgelöst wird.
Die Art der ausgelösten Ausnahme gibt in der Regel einen sehr starken Hinweis darauf, was passiert ist
falsch. Prüfen Sie, ob es sich um
IOException, ein
OutOfMemoryError,
oder etwas anderem, und suchen Sie die Dokumentation
zur Ausnahmeklasse.
Klasse, Methode, Datei und Zeilennummer der Quelldatei, bei der die Ausnahme gilt wird in der zweiten Zeile eines Stacktrace angezeigt. Für jede Funktion, die aufgerufen wurde, zeigt eine weitere Zeile die vorherige Aufruf-Website (Stapelframe genannt). Sie gehen den Stack hinauf und sehen sich den Code an, um einen Ort zu finden, einen falschen Wert übergeben. Wenn Ihr Code nicht im Stacktrace erscheint, haben Sie wahrscheinlich irgendwo einen ungültigen Parameter an einen asynchronen . Sie können häufig herausfinden, was passiert ist, indem Sie jede Zeile des des Stacktrace, der Ermittlung der verwendeten API-Klassen und der Bestätigung, dass der korrekt sind und dass der Aufruf von einer Stelle aus erfolgt, Zulässig sind.
Stacktraces für Anwendungen mit C- und C++-Code funktionieren fast auf dieselbe Weise.
*** *** *** *** *** *** *** *** *** *** *** *** *** *** *** ***
Build fingerprint: 'google/foo/bar:10/123.456/78910:user/release-keys'
ABI: 'arm64'
Timestamp: 2020-02-16 11:16:31+0100
pid: 8288, tid: 8288, name: com.example.testapp  >>> com.example.testapp <<<
uid: 1010332
signal 11 (SIGSEGV), code 1 (SEGV_MAPERR), fault addr 0x0
Cause: null pointer dereference
    x0  0000007da81396c0  x1  0000007fc91522d4  x2  0000000000000001  x3  000000000000206e
    x4  0000007da8087000  x5  0000007fc9152310  x6  0000007d209c6c68  x7  0000007da8087000
    x8  0000000000000000  x9  0000007cba01b660  x10 0000000000430000  x11 0000007d80000000
    x12 0000000000000060  x13 0000000023fafc10  x14 0000000000000006  x15 ffffffffffffffff
    x16 0000007cba01b618  x17 0000007da44c88c0  x18 0000007da943c000  x19 0000007da8087000
    x20 0000000000000000  x21 0000007da8087000  x22 0000007fc9152540  x23 0000007d17982d6b
    x24 0000000000000004  x25 0000007da823c020  x26 0000007da80870b0  x27 0000000000000001
    x28 0000007fc91522d0  x29 0000007fc91522a0
    sp  0000007fc9152290  lr  0000007d22d4e354  pc  0000007cba01b640

backtrace:
  #00  pc 0000000000042f89  /data/app/com.example.testapp/lib/arm64/libexample.so (com::example::Crasher::crash() const)
  #01  pc 0000000000000640  /data/app/com.example.testapp/lib/arm64/libexample.so (com::example::runCrashThread())
  #02  pc 0000000000065a3b  /system/lib/libc.so (__pthread_start(void*))
  #03  pc 000000000001e4fd  /system/lib/libc.so (__start_thread)
Wenn Sie in nativen Stacktraces keine Informationen auf Klassen- und Funktionsebene sehen, müssen Sie möglicherweise native Debugging-Symboldatei generieren und lade sie in die Google Play Console hoch. Weitere Informationen finden Sie unter Offenlegung von Absturz-Stacktraces Allgemeine Informationen zu nativen Abstürzen finden Sie unter Native Abstürze diagnostizieren
Tipps zum Reproduzieren eines Absturzes
Es ist möglich, dass Sie das Problem nicht reproduzieren können, indem Sie Emulatoren öffnen oder das Gerät mit dem Computer verbinden. Entwicklungsumgebungen haben in der Regel mehr Ressourcen, z. B. Bandbreite, Arbeitsspeicher und Speicherplatz. Verwenden Sie die Methode Art der Ausnahme, um zu ermitteln, was die Ressource sein könnte, die knapp ist, oder einen Zusammenhang zwischen der Android-Version, dem Gerätetyp oder der Version.
Arbeitsspeicherfehler
Wenn Sie eine
OutOfMemoryError,
können Sie einen Emulator
mit geringer Speicherkapazität erstellen. Abbildung
2 zeigt die AVD-Manager-Einstellungen, in denen Sie die Größe des
auf dem Gerät.
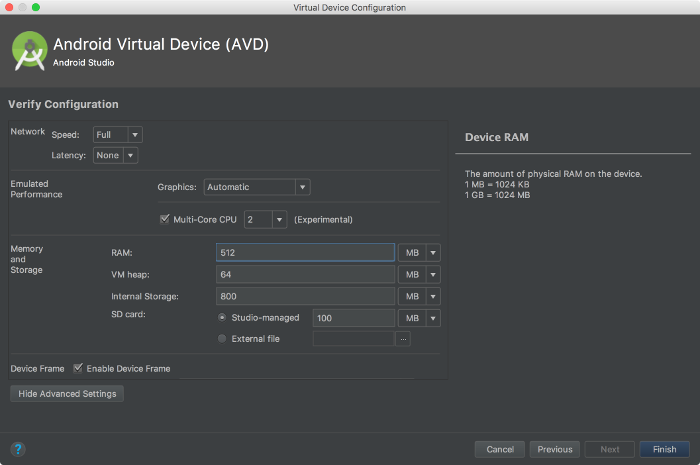
Abbildung 2: Speichereinstellung im AVD-Manager
Netzwerkausnahmen
Da die Nutzer häufig die Mobilfunk- oder WLAN-Abdeckung wechseln, Anwendungsnetzwerkausnahmen sollten normalerweise nicht als Fehler behandelt werden, als normale Betriebsbedingungen, die unerwartet auftreten.
Wenn Sie eine Netzwerkausnahme reproduzieren müssen, z. B. eine
UnknownHostException,
Aktivieren Sie dann den Flugmodus.
Netzwerk.
Eine weitere Möglichkeit besteht darin,
die Netzwerkqualität im Emulator zu reduzieren,
eine Emulation der Netzwerkgeschwindigkeit und/oder
eine Netzwerkverzögerung auswählen. Sie können die
Einstellungen für Geschwindigkeit und Latenz im AVD-Manager oder Start des Emulators
mit den Flags -netdelay und -netspeed, wie im Folgenden gezeigt
Befehlszeilenbeispiel:
emulator -avd [your-avd-image] -netdelay 20000 -netspeed gsm
In diesem Beispiel wird eine Verzögerung von 20 Sekunden für alle Netzwerkanfragen und einen Upload festgelegt. und eine Downloadgeschwindigkeit von 14,4 Kbit/s. Weitere Informationen zu Befehlszeilenoptionen für den Emulator finden Sie unter Starten Sie den Emulator über die Befehlszeile.
Mit Logcat lesen
Sobald Sie über die Schritte zum Reproduzieren des Absturzes verfügen, können Sie ein Tool wie
logcat, um weitere Informationen zu erhalten.
Die Logcat-Ausgabe zeigt Ihnen, welche anderen Protokollmeldungen Sie ausgegeben haben, zusammen mit
mit anderen aus dem System. Vergessen Sie nicht, zusätzliche
Log gibt an, dass du
wurden hinzugefügt, da sie beim Drucken CPU und Akku verschwenden, während Ihre App
ausgeführt wird.
Abstürze aufgrund von Null-Cursor-Ausnahmen verhindern
Null-Pointer-Ausnahmen (identifiziert durch Laufzeitfehlertyp)
NullPointerException) treten auf, wenn Sie versuchen, auf ein Objekt zuzugreifen,
null, in der Regel durch Aufrufen der zugehörigen Methoden oder durch Zugriff auf seine Mitglieder. NULL-Pointer-Zeichen
Ausnahmen sind die Hauptursache für App-Abstürze bei Google Play. Der Zweck der
null gibt an, dass das Objekt fehlt. Beispielsweise wurde es nicht
die noch erstellt oder zugewiesen wurden. Um Nullzeigerausnahmen zu vermeiden, müssen Sie sicherstellen,
dass die Objektverweise, mit denen Sie arbeiten, vor dem Aufruf
oder versuchen, auf ihre Mitglieder zuzugreifen. Wenn der Objektverweis
null, handhaben Sie diesen Fall gut (z. B. beenden Sie eine Methode, bevor Sie die Ausführung
alle Vorgänge auf die Objektreferenz und das Schreiben von Informationen in ein Fehlerbehebungsprotokoll).
Da Sie nicht für jeden Parameter jeder Methode Nullprüfungen durchführen möchten, aufgerufen wird, können Sie sich auf die IDE oder auf den Typ des Objekts verlassen, Null-Zulässigkeit.
Programmiersprache Java
Die folgenden Abschnitte beziehen sich auf die Programmiersprache Java.
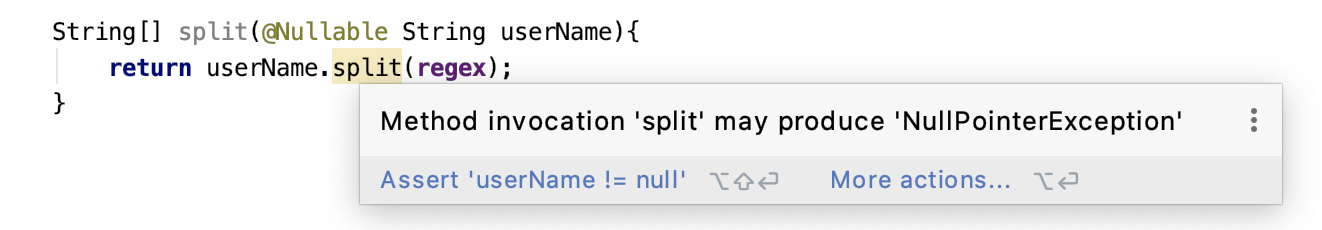
Warnungen bei der Kompilierungszeit
Methoden annotieren und Rückgabewerte mit
@Nullable und
@NonNull, um die Kompilierungszeit zu erhalten
Warnungen von der IDE. Diese Warnungen fordern Sie dazu auf, ein Objekt zu erwarten, für das Nullwerte zulässig sind:
Diese Nullprüfungen beziehen sich auf Objekte, von denen Sie wissen, dass sie null sein können. Eine Ausnahme bei einer
@NonNull-Objekt gibt einen Fehler in Ihrem Code an, der
gesprochen.
Fehler bei der Kompilierungszeit
Da die Null-Zulässigkeit aussagekräftig sein sollte, können Sie sie in die von Ihnen verwendeten Typen einbetten.
sodass eine Kompilierungszeitprüfung auf null erfolgt. Wenn Sie wissen, dass ein Objekt
null zu berechnen, und dass die Null-Zulässigkeit behandelt werden soll, können Sie sie in ein Objekt wie
Optional
Sie sollten immer Typen bevorzugen, die die Null-Zulässigkeit vermitteln.
Kotlin
In Kotlin
Null-Zulässigkeit
ist Teil des Schriftsystems. Beispielsweise muss eine Variable aus
der Anfang als Nullwerte zulässig oder nicht
nullierbar ist. Typen, für die Nullwerte zulässig sind, sind mit einem ? gekennzeichnet:
// non-null
var s: String = "Hello"

// null
var s: String? = "Hello"
Variablen, für die keine Nullwerte zulässig sind, können weder Nullwerte noch Variablen zugewiesen werden, für die Nullwerte zulässig sind müssen auf Null-Zulässigkeit geprüft werden, bevor sie als Nicht-Null verwendet werden.
Wenn Sie nicht explizit nach null suchen möchten, können Sie den sicheren Aufruf von ?. verwenden.
Operator:
val length: Int? = string?.length  // length is a nullable int
                                   // if string is null, then length is null
Als Best Practice sollten Sie bei einem Objekt, in dem Nullwerte zulässig sind, auf die Null-Fall und
oder Ihre App in einen unerwarteten Zustand gelangen kann. Wenn Ihre Anwendung nicht abstürzt
mit NullPointerException, werden Sie nicht mehr wissen, dass diese Fehler existieren.
Sie haben folgende Möglichkeiten, auf null zu prüfen:
ifchecksval length = if(string != null) string.length else 0Durch Smartcast und die Nullprüfung weiß der Kotlin-Compiler, dass der Stringwert nicht null ist, sodass Sie den Verweis direkt verwenden können, ganz ohne den Notruf-Mitarbeiter.
-
Mit diesem Operator können Sie angeben, Objekt; Andernfalls wird etwas anderes zurückgegeben.“
val length = string?.length ?: 0
In Kotlin ist eine NullPointerException weiterhin verfügbar. Im Folgenden finden Sie
Situationen:
- Wenn explizit ein
NullPointerExceptionausgelöst wird. - Wenn Sie den
!!-Operator für Null-Assertions. Dieser Operator wandelt jeden Wert in einen Nicht-Null-Typ um,NullPointerException, wenn der Wert null ist. - Beim Zugriff auf eine Nullreferenz eines Plattformtyps.
Plattformtypen
Plattformtypen sind Objektdeklarationen aus Java. Diese Arten werden speziell behandelt. Null-Prüfungen werden nicht erzwungen, daher ist die Nicht-Null-Garantie die gleiche wie in Java Wenn Sie auf eine Plattformtypreferenz zugreifen, erstellt Kotlin keine Kompilierung Zeitfehler, aber diese Verweise können zu Laufzeitfehlern führen. Weitere Informationen: Beispiel aus der Kotlin-Dokumentation:
val list = ArrayList<String>() // non-null (constructor result) list.add("Item")
val size = list.size // non-null (primitive int) val item = list[0] // platform
type inferred (ordinary Java object) item.substring(1) // allowed, may throw an
                                                       // exception if item == null
Kotlin nutzt Typinferenz, wenn einem Kotlin-Code ein Plattformwert zugewiesen wird.
oder Sie definieren, welchen Typ Sie erwarten. Der beste Weg, um sicherzustellen,
Der korrekte Null-Zulässigkeitsstatus einer Referenz aus Java besteht darin, die Null-Zulässigkeit zu verwenden.
-Annotationen (z. B. @Nullable) im Java-Code. Kotlin-Compiler
stellen diese Verweise als tatsächliche Typen dar, die Nullwerte zulässig sind, oder solche, die keine Nullwerte zulassen können, und nicht als
Plattformtypen.
Java Jetpack APIs wurden je nach Bedarf mit @Nullable oder @NonNull annotiert.
Ein ähnlicher Ansatz wurde in der
Android 11 SDK
Typen aus diesem SDK, die in Kotlin verwendet werden, werden als
sowie Typen, die keine
Nullwerte zulassen können, und keine
Nullwerte zulässig sind.
Aufgrund des Kotlin-Typsystems haben Apps einen deutlichen Rückgang
NullPointerException Abstürze. Die Google Home App verzeichnete 30%
weniger Abstürze aufgrund von Null-Cursor-Ausnahmen in dem Jahr, in dem sie
die Entwicklung neuer Funktionen zu Kotlin migriert.