dmtracedump is a tool that generates
graphical call-stack diagrams from trace log files. The tool uses the Graphviz
Dot utility to create the graphical output, so you need to install Graphviz
before running dmtracedump. If you haven't yet generated trace logs and
saved them from your connected device to your local machine, go to
Generate trace logs by instrumenting your app.
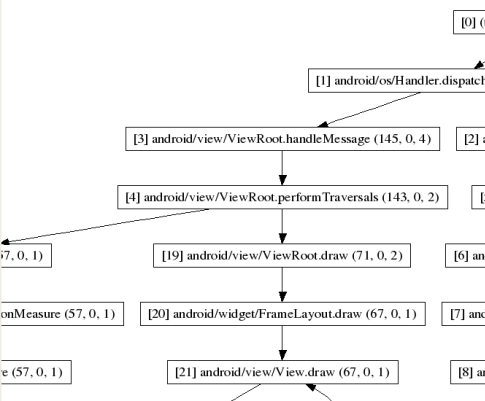
The dmtracedump tool generates the call stack data as a tree diagram, where each
node represents a method call. It shows call flow (from parent node to child nodes)
using arrows. The diagram below shows a sample output of dmtracedump.
The dmtracedump tool is provided in the Android SDK Tools package and is
located in android-sdk/platform-tools/.
Syntax
The usage for dmtracedump is:
dmtracedump [-ho] [-s sortable] [-d trace-base-name] [-g outfile] trace-base-name
The tool then loads trace log data from trace-base-name.data and
trace-base-name.key.
Global options
| Global options | Description |
|---|---|
-h |
Turn on HTML output |
-o |
Dump the trace file instead of profiling |
Commands and command options
| Commands and options | Description |
|---|---|
-d trace-base-name |
Diff with this trace name |
-g outfile |
Generate output to outfile |
-s sortable |
URL base to the location of the sortable javascript file |
-t percent |
Minimum threshold for including child nodes in the graph (child's inclusive time as a percentage of parent inclusive time). If this option is not used, the default threshold is 20%. |
Output

Figure 1. Screenshot of dmtracedump
For each node in the graph, dmtracedump shows the following
information:
ref callname (inc-ms, exc-ms,numcalls)
ref— Call reference number, as used in trace logsinc-ms— Inclusive elapsed time (milliseconds spent in method, including all child methods)exc-ms— Exclusive elapsed time (milliseconds spent in method, not including any child methods)numcalls— Number of calls
