تنظيم صفحاتك في مجموعات
يمكنك حفظ المحتوى وتصنيفه حسب إعداداتك المفضّلة.
يُعرف تسجيل نشاط الجهاز على مدار فترة زمنية قصيرة باسم تتبُّع النظام. تنتج عملية تتبُّع النظام ملف تتبُّع يمكنك استخدامه لإنشاء تقرير نظام. يساعدك هذا التقرير في تحديد أفضل طريقة لتحسين أداء تطبيقك أو لعبتك.
للحصول على مقدّمة شاملة حول التتبُّع وإنشاء الملفات الشخصية، راجِع صفحة مقدمة عن التتبُّع في مستندات Perfetto.
توفّر منصة Android عدة خيارات مختلفة لتسجيل عمليات التتبُّع:
أداة تحليل وحدة المعالجة المركزية والذاكرة في "استوديو Android"
أداة سطر الأوامر Perfetto (الإصدار 10 من نظام التشغيل Android والإصدارات الأحدث)
أداة تتبُّع النظام
أداة Systrace لسطر الأوامر
يفحص محلّل استخدام وحدة المعالجة المركزية في Android Studio استخدام تطبيقك لوحدة المعالجة المركزية ونشاط سلسلة التعليمات في الوقت الفعلي أثناء تفاعلك مع تطبيقك. ويمكنك أيضًا فحص التفاصيل في عمليات تتبُّع الطرق والوظائف والنظام المسجّلة. يقدّم
أداة تحليل استخدام الذاكرة نظرة عامة على استخدام الذاكرة في ما يتعلق بأحداث اللمس وتغييرات Activity وأحداث جمع البيانات غير الضرورية.
Perfetto هي أداة تتبُّع على مستوى النظام الأساسي تم طرحها في Android 10. وهو مشروع متطوّر مفتوح المصدر لتتبُّع الأخطاء على Android وLinux وChrome. وتوفّر مجموعة فرعية من مصادر البيانات مقارنةً بأداة Systrace، كما تتيح لك تسجيل عمليات تتبُّع طويلة بشكل عشوائي في بث ثنائي من بروتوكول المخزن المؤقت. يمكنك فتح عمليات التتبُّع هذه في واجهة مستخدم Perfetto.
أداة "تتبُّع نشاط النظام" هي إحدى أدوات Android التي تحفظ نشاط الجهاز في ملف تتبُّع. على جهاز يعمل بالإصدار 10 من نظام التشغيل Android (المستوى 29 من واجهة برمجة التطبيقات) أو الإصدارات الأحدث، يتم حفظ ملفات التتبُّع بتنسيق Perfetto، كما هو موضّح لاحقًا في هذا المستند. على جهاز يعمل بإصدار أقدم من Android، يتم حفظ ملفات التتبُّع بتنسيق Systrace.
Systrace هي أداة قديمة توفّرها المنصة وتعمل من سطر الأوامر، وهي تسجّل نشاط الجهاز خلال فترة زمنية قصيرة في ملف نصي مضغوط. تُنشئ الأداة تقريرًا يجمع بين بيانات من نواة Android، مثل برنامج جدولة وحدة المعالجة المركزية ونشاط القرص ومواضيع التطبيق. تعمل أداة Systrace على جميع إصدارات منصة Android، ولكن ننصح باستخدام Perfetto على الأجهزة التي تعمل بالإصدار 10 من نظام التشغيل Android والإصدارات الأحدث.
الشكل 1. مثال على عرض تتبُّع Perfetto، يعرض حوالي 20 ثانية من التفاعل مع أحد التطبيقات.
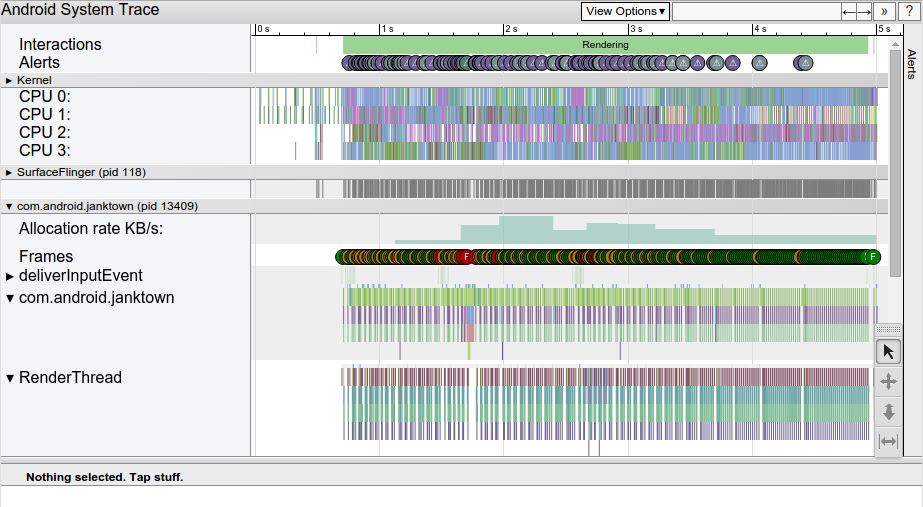
الشكل 2. نموذج لتقرير HTML من Systrace يعرض خمس ثوانٍ من التفاعل مع أحد التطبيقات
يقدّم كلا التقريرَين صورة شاملة عن عمليات نظام جهاز Android خلال فترة زمنية محدّدة. يفحص التقرير أيضًا معلومات التتبُّع التي تم تسجيلها لتسليط الضوء على المشاكل التي يرصدها، مثل بطء واجهة المستخدم أو ارتفاع استهلاك الطاقة.
يمكن استخدام Perfetto وSystrace معًا:
افتح ملفات Perfetto وملفات Systrace في واجهة مستخدم Perfetto. افتح ملفات Systrace باستخدام أداة عرض Systrace القديمة في واجهة مستخدم Perfetto من خلال النقر على الرابط الفتح باستخدام واجهة المستخدم القديمة.
توضّح هذه الصفحة كيفية تسجيل تتبُّع النظام مباشرةً على أي جهاز يعمل بالإصدار 9 (المستوى 28 من واجهة برمجة التطبيقات) أو الإصدارات الأحدث من نظام التشغيل Android.
يفتح عارض عمليات التتبُّع المستند إلى الويب في Perfetto عمليات تتبُّع Perfetto ويعرض تقريرًا كاملاً. يمكنك أيضًا فتح عمليات تتبُّع Systrace في عارض البيانات هذا باستخدام خيار واجهة المستخدم القديمة.
توضّح هذه السمة كيف يمكنك تطبيق تصنيفات مخصّصة على أقسام معيّنة من الرمز،
ما يتيح إجراء تحليل أسهل للسبب الجذري في Systrace أو Perfetto.
يخضع كل من المحتوى وعيّنات التعليمات البرمجية في هذه الصفحة للتراخيص الموضحّة في ترخيص استخدام المحتوى. إنّ Java وOpenJDK هما علامتان تجاريتان مسجَّلتان لشركة Oracle و/أو الشركات التابعة لها.
تاريخ التعديل الأخير: 2025-08-27 (حسب التوقيت العالمي المتفَّق عليه)
[[["يسهُل فهم المحتوى.","easyToUnderstand","thumb-up"],["ساعَدني المحتوى في حلّ مشكلتي.","solvedMyProblem","thumb-up"],["غير ذلك","otherUp","thumb-up"]],[["لا يحتوي على المعلومات التي أحتاج إليها.","missingTheInformationINeed","thumb-down"],["الخطوات معقدة للغاية / كثيرة جدًا.","tooComplicatedTooManySteps","thumb-down"],["المحتوى قديم.","outOfDate","thumb-down"],["ثمة مشكلة في الترجمة.","translationIssue","thumb-down"],["مشكلة في العيّنات / التعليمات البرمجية","samplesCodeIssue","thumb-down"],["غير ذلك","otherDown","thumb-down"]],["تاريخ التعديل الأخير: 2025-08-27 (حسب التوقيت العالمي المتفَّق عليه)"],[],[],null,["# Overview of system tracing\n\nRecording device activity over a short period of time is known as *system\ntracing*. System tracing produces a trace file that you can use to generate a\nsystem report. This report helps you identify how best to improve your app or\ngame's performance.\n\nFor a comprehensive introduction to tracing and profiling, see the\n[Tracing 101](https://perfetto.dev/docs/tracing-101) page in the\nPerfetto documentation.\n\nThe Android platform provides several different options for capturing traces:\n\n- Android Studio CPU and memory profiler\n- Perfetto command-line tool (Android 10 and higher)\n- System tracing utility\n- Systrace command-line tool\n\nThe Android Studio CPU profiler inspects your app's CPU usage and thread\nactivity in real time while you interact with your app. You can also inspect the\ndetails in recorded method traces, function traces, and system traces. The\nmemory profiler gives an overview of memory usage in relation to touch events,\n[`Activity`](/reference/android/app/Activity) changes, and garbage collection\nevents.\n\nPerfetto is the platform-wide tracing tool introduced in\nAndroid 10. It is a sophisticated open source tracing project for\nAndroid, Linux, and Chrome. It offers a superset of data sources compared to\nSystrace and lets you record arbitrarily long traces in a protocol buffer binary\nstream. You can open these traces in the [Perfetto\nUI](https://ui.perfetto.dev/#!/).\n\nThe System tracing utility is an Android tool that saves device activity to a\ntrace file. On a device running Android 10 (API level 29) or higher, trace files\nare saved in Perfetto format, as shown later in this document. On a device\nrunning an earlier version of Android, trace files are saved in the Systrace\nformat.\n\nSystrace is a legacy platform-provided command-line tool that records device\nactivity over a short period of time in a compressed text file. The tool\nproduces a report that combines data from the Android kernel, such as the CPU\nscheduler, disk activity, and app threads. Systrace works on all Android\nplatform versions, but we recommend Perfetto for devices running Android 10 and\nhigher.\n**Figure 1.** A sample Perfetto trace view, which shows about 20 seconds\nof interaction with an app.\n**Figure 2.** A sample Systrace HTML report, which shows five seconds of\ninteraction with an app.\n\nBoth reports provide an overall picture of an Android-powered device's system\nprocesses for a given period of time. The report also inspects the captured\ntracing information to highlight problems that it observes, such as UI jank or\nhigh power consumption.\n\nPerfetto and Systrace are interoperable:\n\n- Open both Perfetto files and Systrace files in the Perfetto UI. Open Systrace files with the legacy Systrace viewer in the Perfetto UI by clicking the **Open with legacy UI** link.\n- [Convert a Perfetto trace to the legacy Systrace text\n format](https://docs.perfetto.dev/#/traceconv.md) using the `traceconv` tool.\n\n| **Note:** Systrace and Perfetto don't collect detailed information about code execution within your app process. For more detailed information about which methods your app is executing and how many CPU resources it's using, use the [CPU profiler](/studio/profile/cpu-profiler) in Android Studio.\n\nSystem tracing guides\n---------------------\n\nTo learn more about system tracing tools, see the following guides:\n\n[**Inspect CPU activity with CPU Profiler**](/studio/profile/cpu-profiler)\n: Shows how to profile your app's CPU usage and thread activity in Android\n Studio.\n\n[**Capture a system trace on a device**](/topic/performance/tracing/on-device)\n: Explains how to capture a system trace directly on any device running\n Android 9 (API level 28) or higher.\n\n[**Capture a system trace on the command line**](/topic/performance/tracing/command-line)\n: Defines the different options and flags that you can pass into the\n command-line interface for Systrace.\n\n[**Run Perfetto using adb**](/studio/command-line/perfetto)\n: Describes how to run the `perfetto` command-line tool to capture traces.\n\n[**Quickstart: Record traces on Android**](https://perfetto.dev/#/running.md)\n: External documentation that describes how to build and run the `perfetto`\n command-line tool to capture traces.\n\n[**Quickstart: Record traces on Android**](https://perfetto.dev/#/running.md)\n: The Perfetto web-based trace viewer opens Perfetto traces and displays a\n complete report. You can also open Systrace traces in this viewer using the\n legacy UI option.\n\n[**Navigate a Systrace report**](/topic/performance/tracing/navigate-report)\n: Lists the elements of a typical report, presents keyboard shortcuts for\n navigating through the report, and describes how to identify types of\n performance problems.\n\n[**Define custom events**](/topic/performance/tracing/custom-events)\n: Describes how you can apply custom labels to specific sections of your code,\n allowing for easier root-cause analysis in Systrace or Perfetto."]]