
Android 平台執行時會將未使用的記憶體視為浪費的記憶體,Android 會持續設法用掉所有可用的記憶體。舉例來說,系統會在應用程式關閉後將其留在記憶體內,方便使用者快速切換回這些應用程式。因此,Android 裝置在執行時,通常不會發生大量記憶體未用到的情況 (請參閱「Android 記憶體分配」一文)。
Android 記憶體不足終止工具 (LMK) 服務程序會監控執行中的 Android 系統記憶體狀態,並在記憶體壓力過高時終止不重要的處理程序,以維持系統效能。
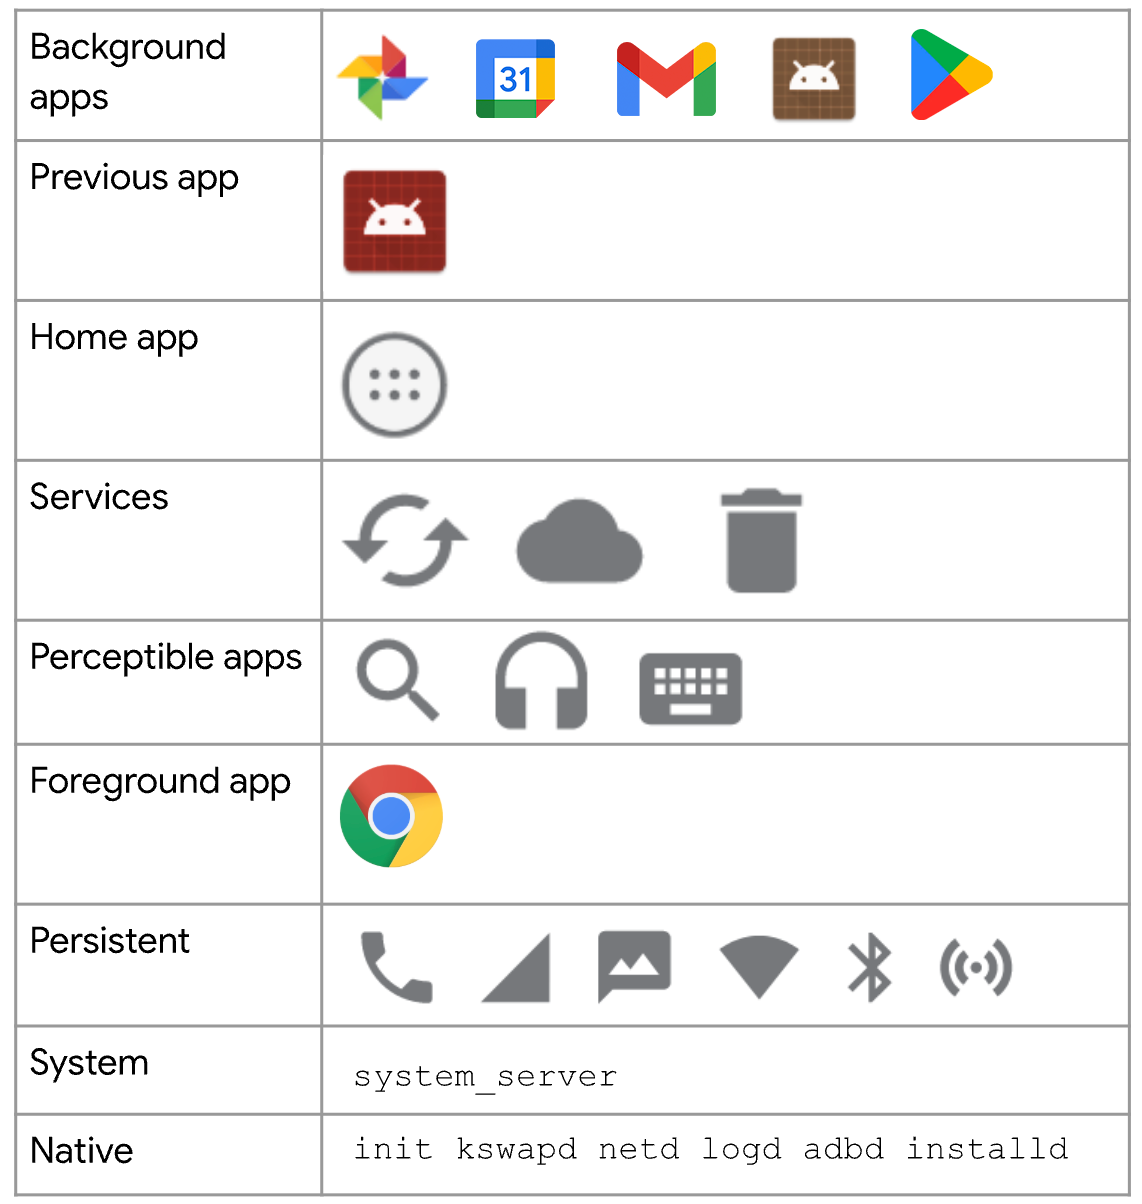
LMK 守護程序會使用稱做 oom_adj_score 的「記憶體不足」分數,為執行中的程序排出優先順序。系統會優先終止分數較高的程序。背景應用程式會先終止,系統程序則會最後終止。下表由高到低列出 LMK 的分數類別。屬於第一列最高分類別的項目會最先遭到終止:
Android Vitals 的 LMK 指標
Android Vitals 可協助您監控及改善應用程式的 LMK 發生率。Android 生命徵象只會評估一項 LMK 事件發生率:使用者感知 LMK 事件發生率。
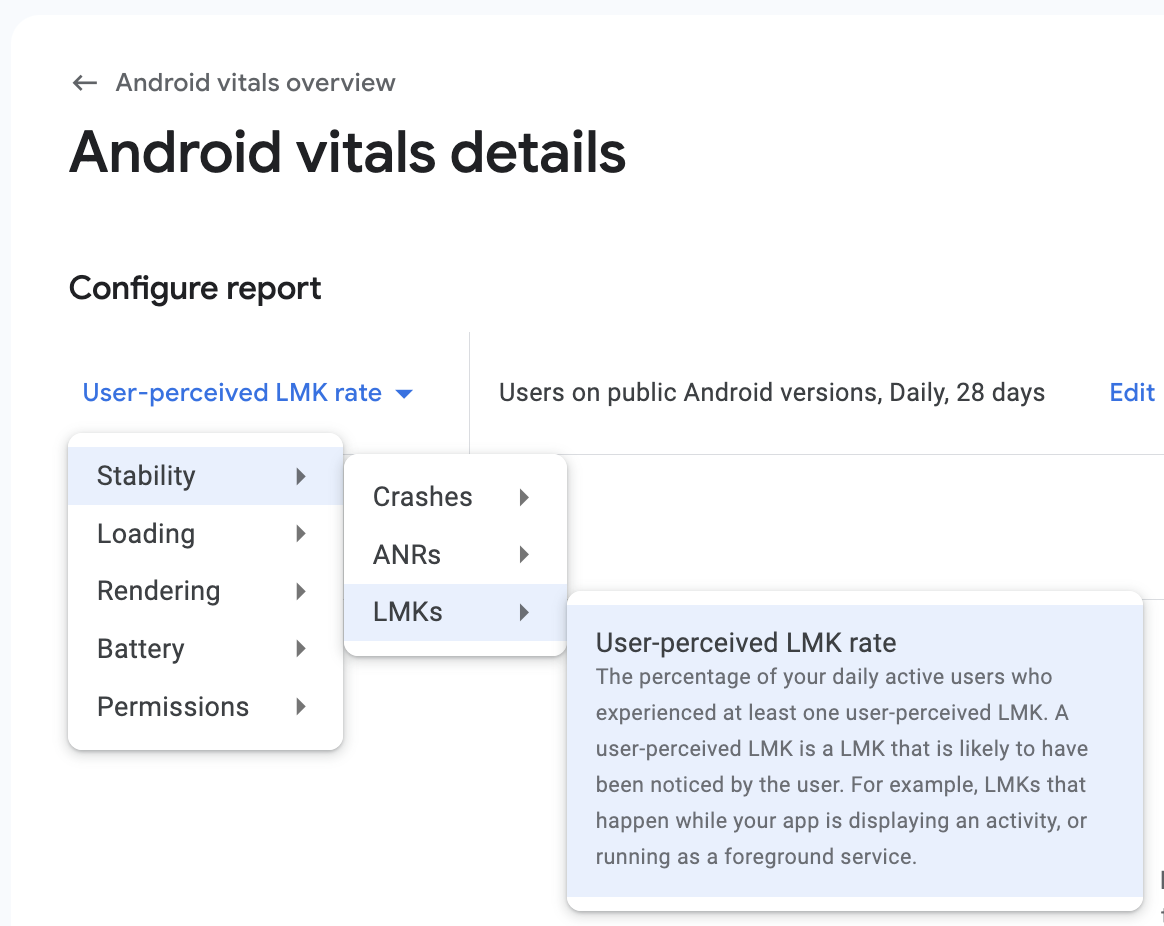
此指標反映感知到發生至少一次 LMK 事件的每日活躍使用者人數百分比。使用者感知 LMK 是指使用者可能注意到的 LMK 情形,例如應用程式在顯示活動或做為前景服務執行時發生的 LMK。
您可以在 Android Vitals 的「Stability」專區下方找到這項指標:
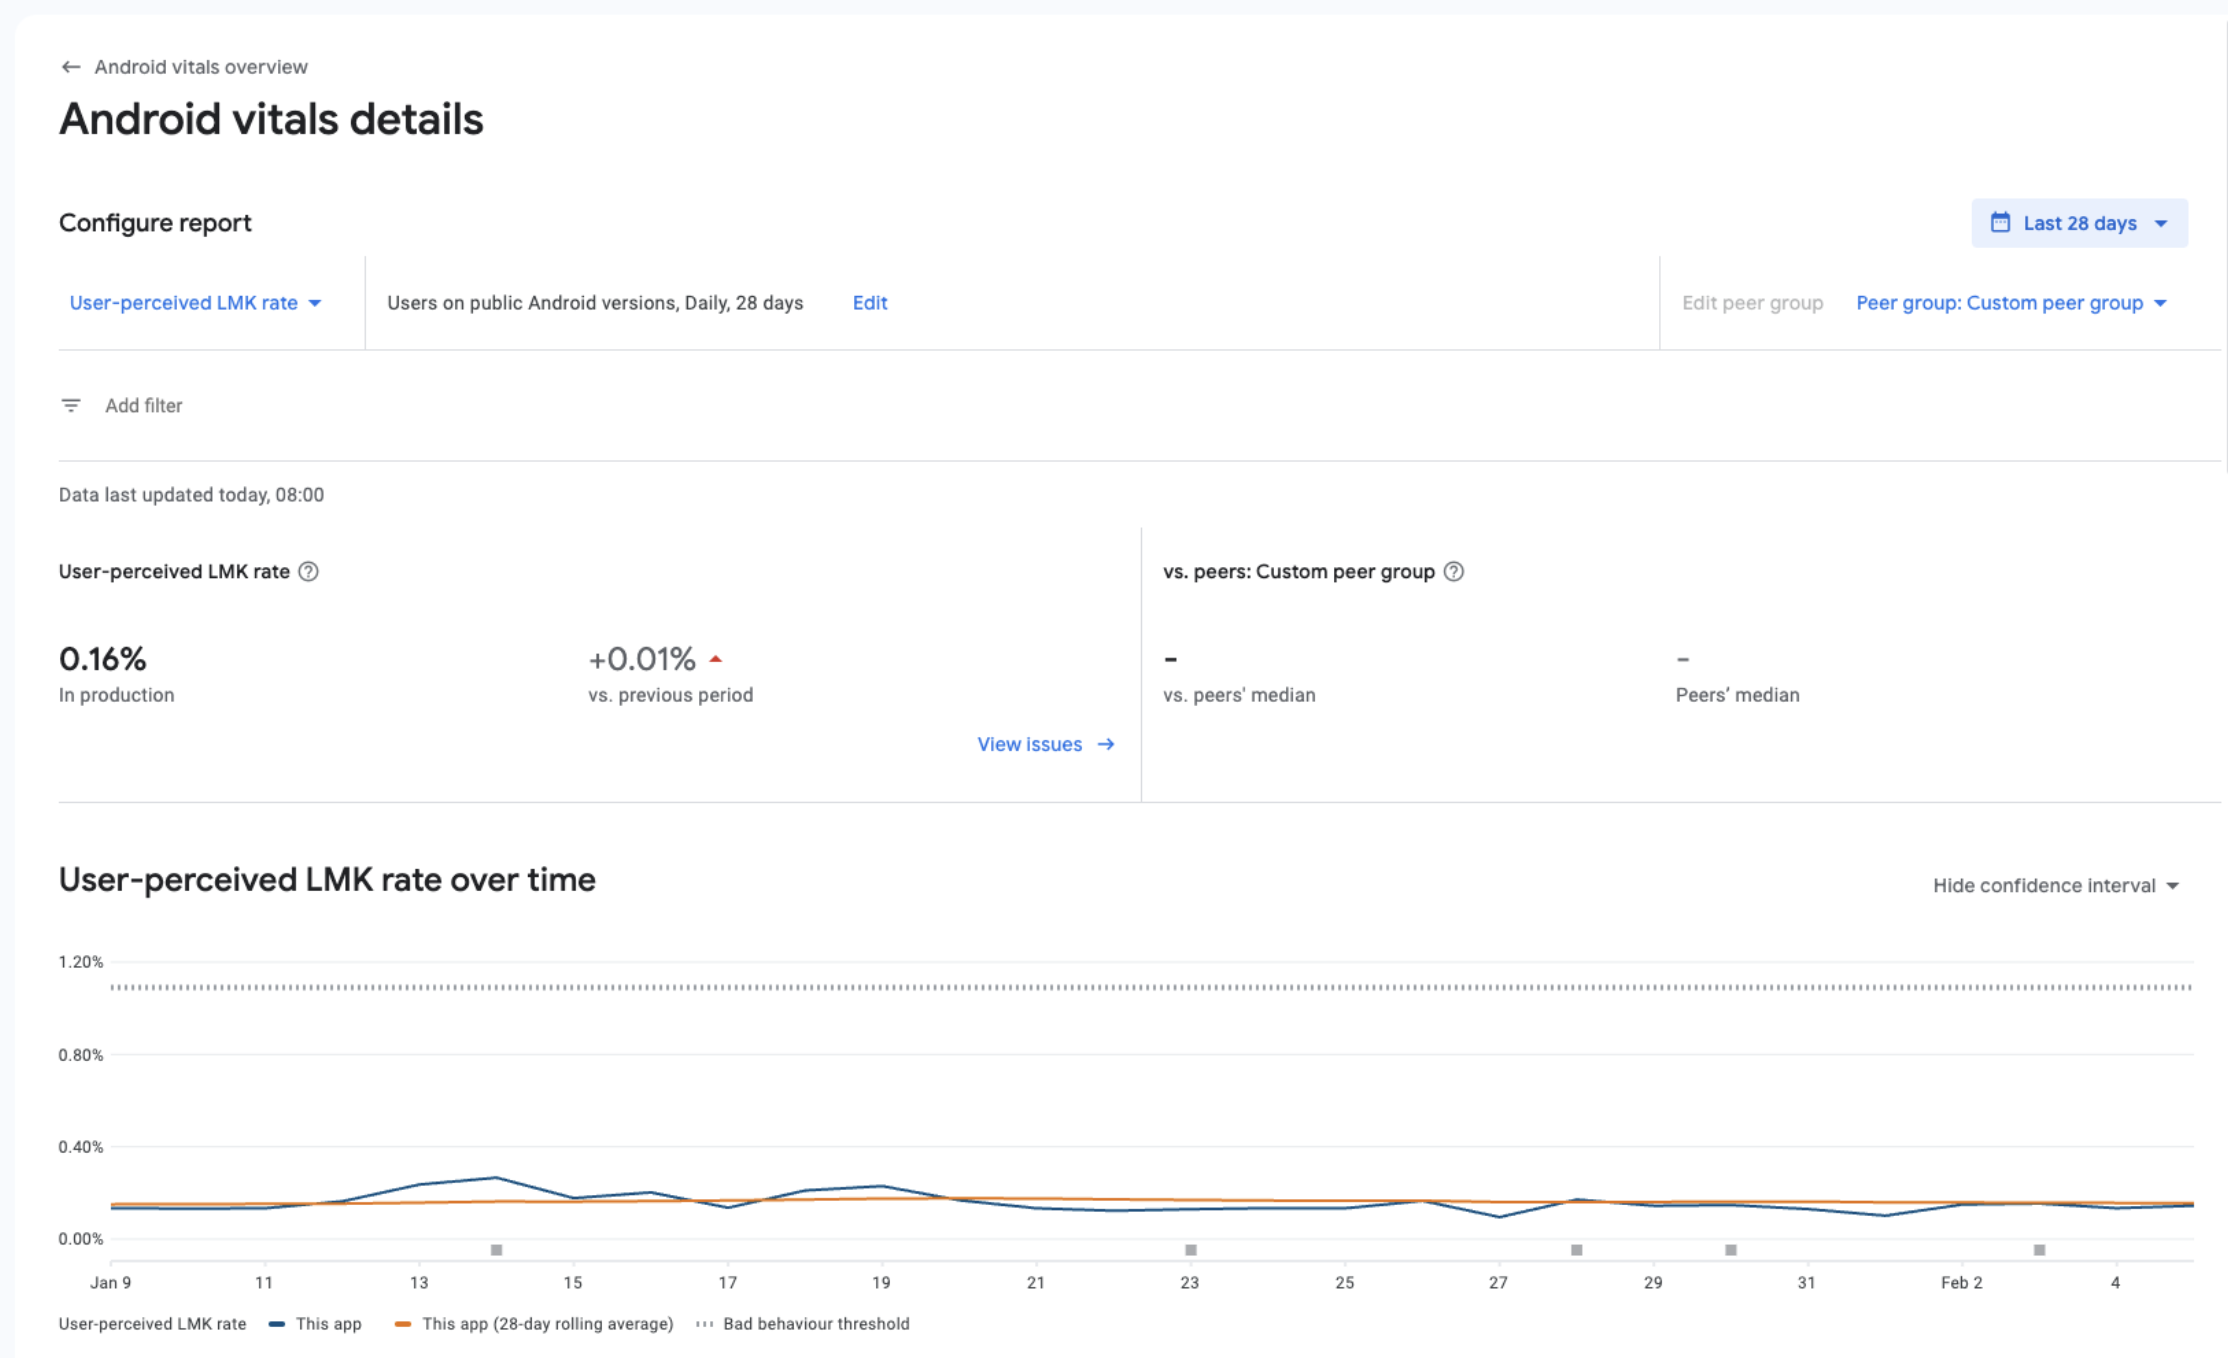
如同其他核心重要指標 (例如 ANR 和當機),您可以篩選指標、比較自己的指標與同類應用程式,或監控指標的長期變化 (最多 3 年)。自 2025 年 1 月 28 日起,現有應用程式可使用這項資料。
記憶體分析工具
以下工具可協助您找出及診斷記憶體問題:
- 瞭解應用程式配置記憶體的變化趨勢。您可以找到即時圖表,瞭解應用程式目前的記憶體用量、已配置的 Java 物件數量,以及進行垃圾收集的時間點。
- 在應用程式執行期間,啟動垃圾收集事件並提供 Java 堆積的數據匯報。
- 記錄應用程式的記憶體配置、檢查所有已配置的物件,並查看每個配置的堆疊追蹤。
如果遊戲是在原生引擎上執行,請使用 HWAddress Sanitizer 偵錯原生記憶體配置。
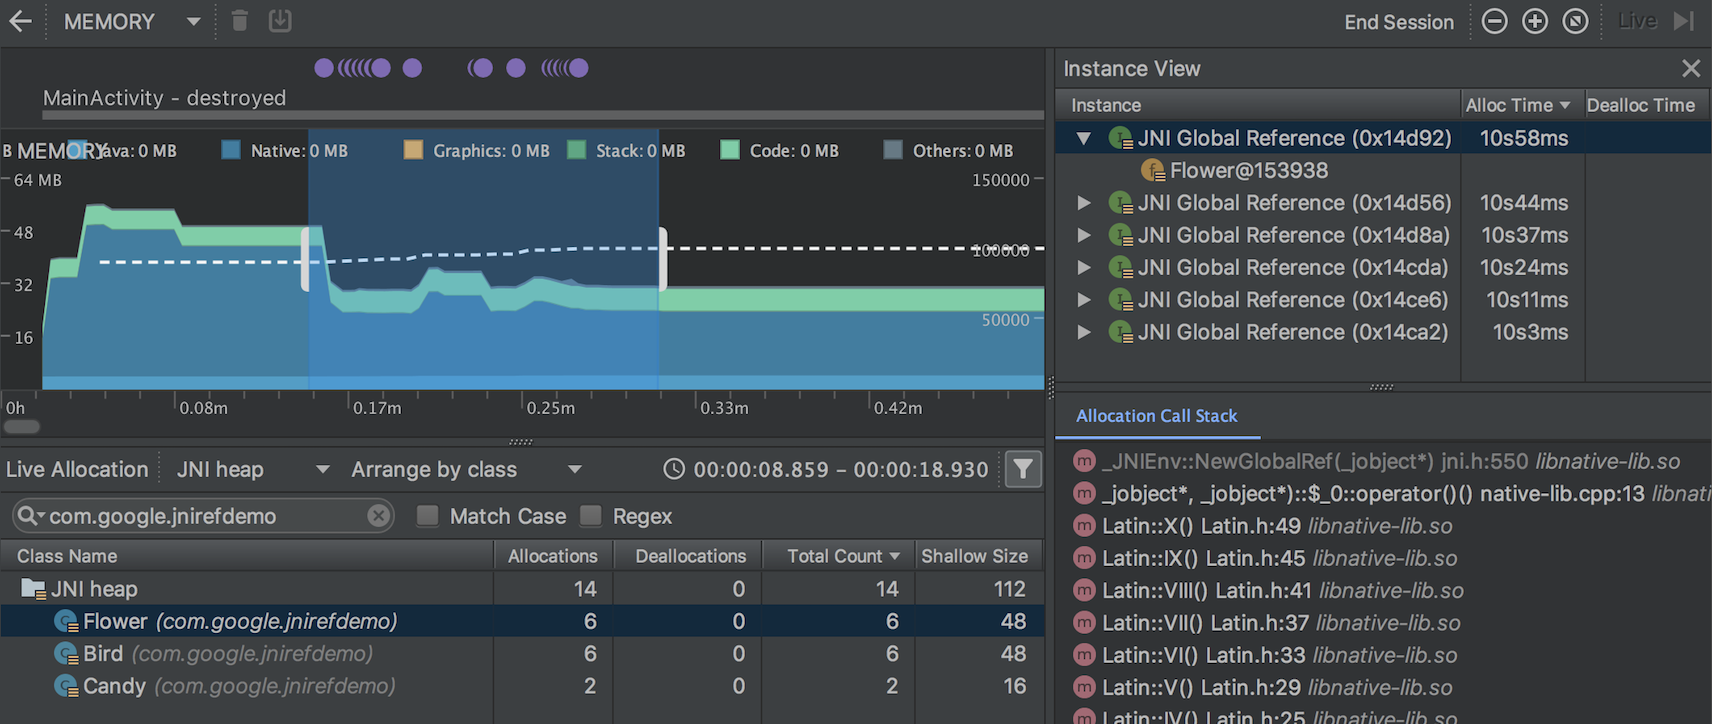
Android Studio 記憶體分析器
Android Studio 提供 記憶體分析器,做為 Android 分析器的元件,可協助您找出可能導致延遲、沒有回應、甚至應用程式異常終止的記憶體流失情形。分析器會顯示應用程式記憶體用量的即時圖表,並可讓您擷取記憶體快照資料、強制執行垃圾收集,以及追蹤記憶體配置。
Unity 記憶體剖析工具
如果您使用 Unity Engine 建構應用程式,可以按照 Unity 記憶體分析指南操作。Unity 提供兩種工具,可分析 Unity 應用程式的記憶體用量。
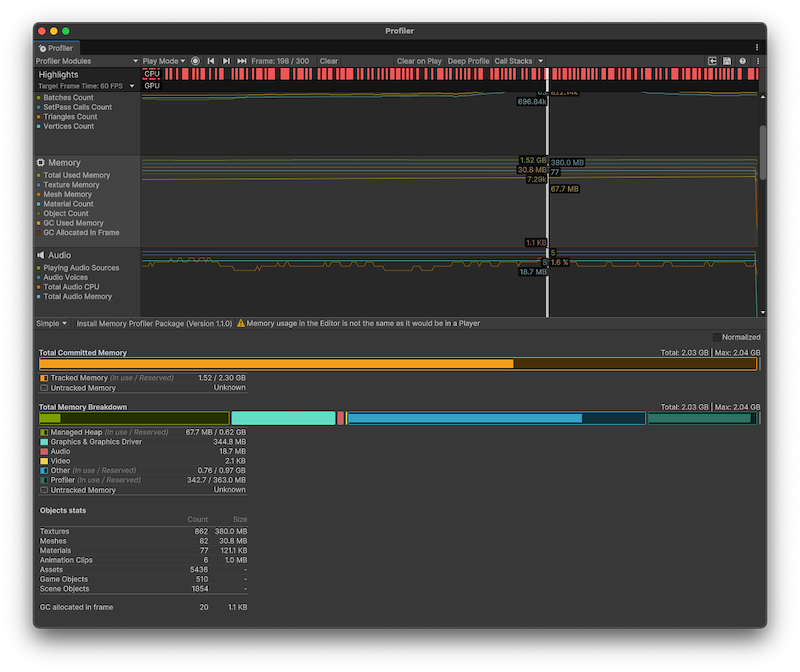
第一個是記憶體分析器模組,這是內建的分析器,可提供應用程式使用記憶體位置的基本資訊。
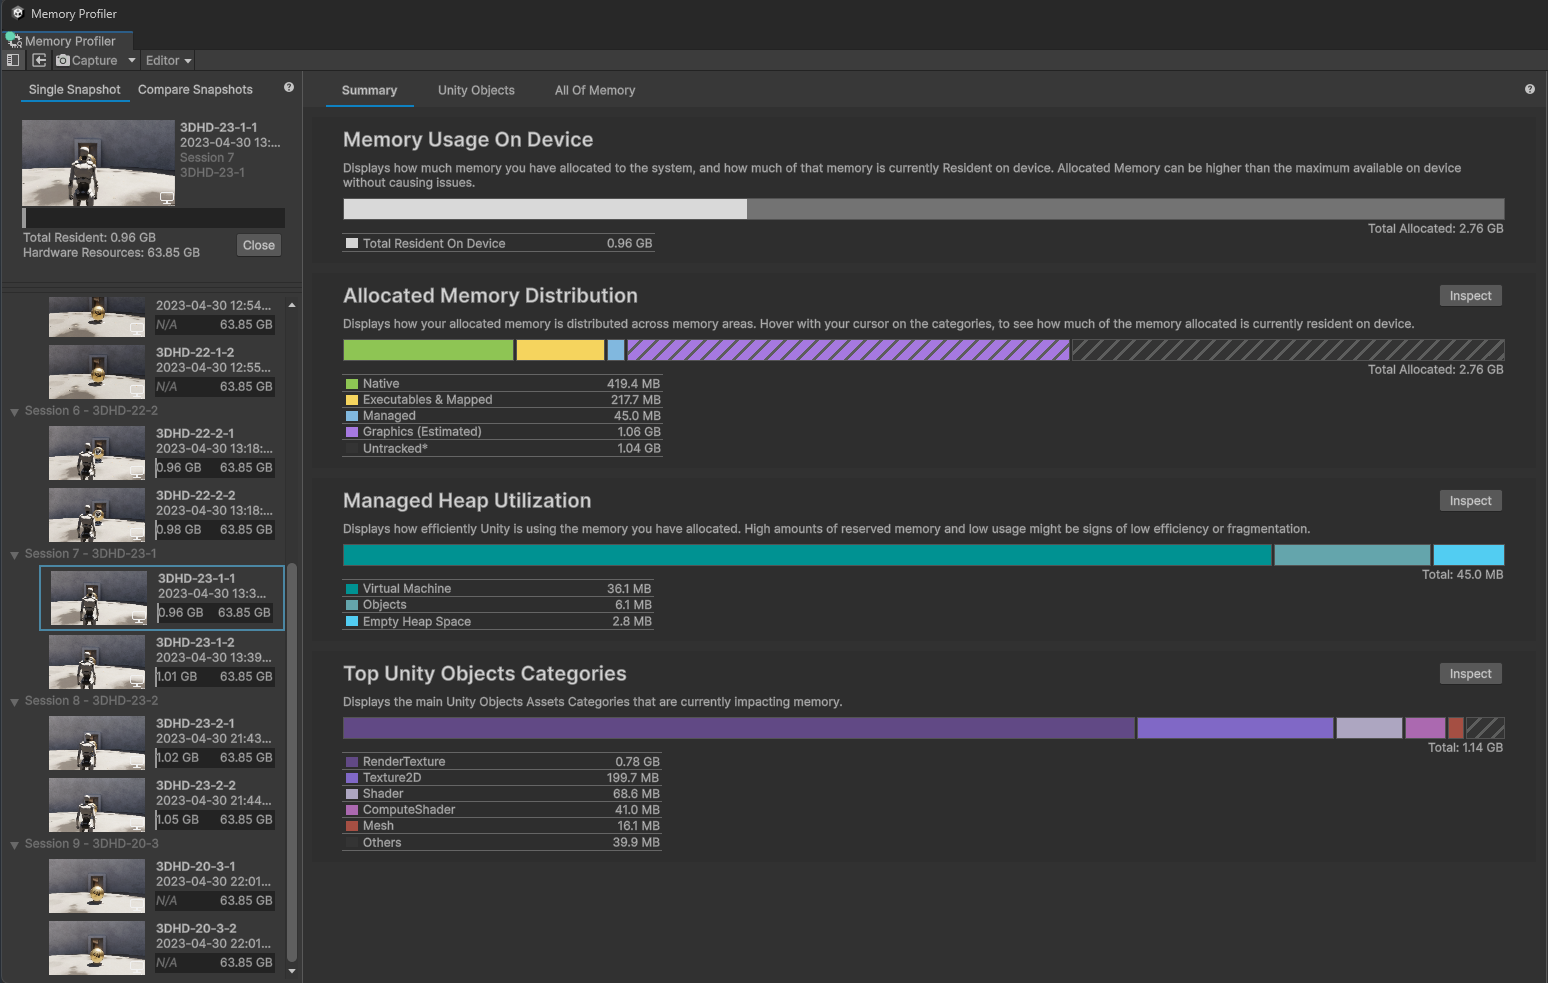
第二個工具是 Memory Profiler 套件,這是可新增至專案的 Unity 套件。這個套件會在 Unity 編輯器中新增額外的記憶體分析器視窗。記憶體分析器可讓您更詳細地分析應用程式的記憶體用量。您可以儲存及比較快照,找出記憶體外洩或查看記憶體版面配置,找出記憶體碎裂問題。
Unreal Memory Insights
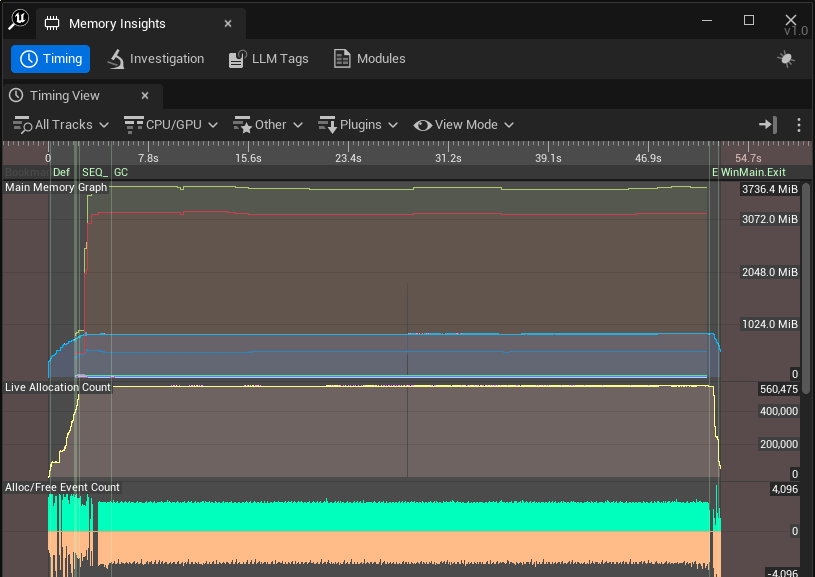
使用 Unreal Engine 建構的應用程式可使用 Unreal Memory Insights 查看記憶體配置和取消配置的詳細資訊,包括與記憶體區塊相關聯的低階記憶體 (LLM) 標記和呼叫堆疊。
記憶體深入分析查詢系統可在任何時間點找出實際分配的記憶體,識別記憶體用量的變化、找出記憶體流失情形,以及區分短期和長期的記憶體分配。
從 UE 5.4 開始,Memory Insights 支援使用呼叫堆疊追蹤 Android 專案的記憶體。
記憶體不足深入分析
Android 提供回呼和 API,可讓您減少遊戲的記憶體需求,並判斷先前遊戲執行作業為何終止。
回呼
請勿為已淘汰的 trim 回呼註冊。當系統執行記憶體限制時,Android 沒有任何 API 可用於偵測原生記憶體壓力事件。裁剪回呼無法有效防止低記憶體殺死事件,因此 Android 已淘汰 TRIM_MEMORY_UI_HIDDEN 和 TRIM_MEMORY_BACKGROUND 以外的所有回呼。
遊戲結束
Android 會嘗試使用所有可用記憶體來快取應用程式和遊戲,確保這些應用程式和遊戲能快速載入 (改善使用者體驗),但當記憶體變得有限時,系統會終止最耗用記憶體的應用程式和遊戲,釋出記憶體,讓裝置能正常運作。
以下資訊、洞察資料和最佳做法有助於您改善遊戲記憶體使用情形:
- 使用
ApplicationExitInfo:這個 API 會傳回 Android 系統終止先前執行的遊戲的原因。使用ApplicationExitInfo檢查先前執行的程序是否因記憶體不足而終止。檢查遊戲是否因記憶體不足而終止,以便對遊戲進行最佳化,讓遊戲在該裝置上使用較少記憶體。 - 查看總體實體 RAM:為避免遊戲在前景中遭到終止,並與裝置的功能相符,請查看每部裝置的實體 RAM 總量,以便根據精細程度調整遊戲記憶體用量。如果目標是避免應用程式在移至背景後不久就遭到終止 (以便讓玩家進行多工處理),請使用 trim 回呼 (具體來說是
TRIM_MEMORY_UI_HIDDEN) 來減少遊戲記憶體用量。