
在執行 Android 9 (API 級別 28) 以上版本的裝置內,有個系統層級的應用程式,稱作「系統追蹤」。這個系統層級的應用程式類似於 systrace 指令列公用程式,但前者可讓您直接從測試裝置錄製追蹤記錄,不用插入裝置並透過 adb 連結。換句話說,只要使用這個應用程式,您就可以和開發團隊分享這些追蹤記錄中的結果。
如果裝置搭載 Android 10 以上版本,會以 Perfetto 格式錄製追蹤記錄,舊版裝置則是以 Systrace 格式記錄。建議您使用 Perfetto 追蹤記錄檢視器開啟這兩種格式的追蹤記錄,然後進行分析。
如果您想處理應用程式的效能相關錯誤,例如啟動速度過慢、轉場過慢、UI 卡頓等,那麼錄製追蹤記錄是不錯的方法。
錄製系統追蹤記錄
使用「系統追蹤」錄製系統追蹤記錄時,您可以選擇使用快速設定方塊或應用程式內的選單。以下各節將說明如何使用這些介面完成錄製程序。
透過「快速設定」方塊錄製
一般來說,如要完成裝置端系統追蹤記錄程序,採用快速設定方塊是比較便利的方法。
設定方塊
如果這是您第一次在測試裝置上使用「系統追蹤」,或是您在裝置的「快速設定」面板裡找不到「系統追蹤」方塊 (如圖 2 所示),請完成以下設定步驟:
- 啟用開發人員選項。
- 開啟「開發人員選項」設定畫面。
- 點選「偵錯」區段的「系統追蹤」。系統會開啟「系統追蹤」應用程式,並顯示應用程式選單。
按照圖 1 所示,啟用應用程式選單中的「顯示快速設定方塊」。系統會把「系統追蹤」方塊新增到「快速設定」面板內,如圖 2 所示。
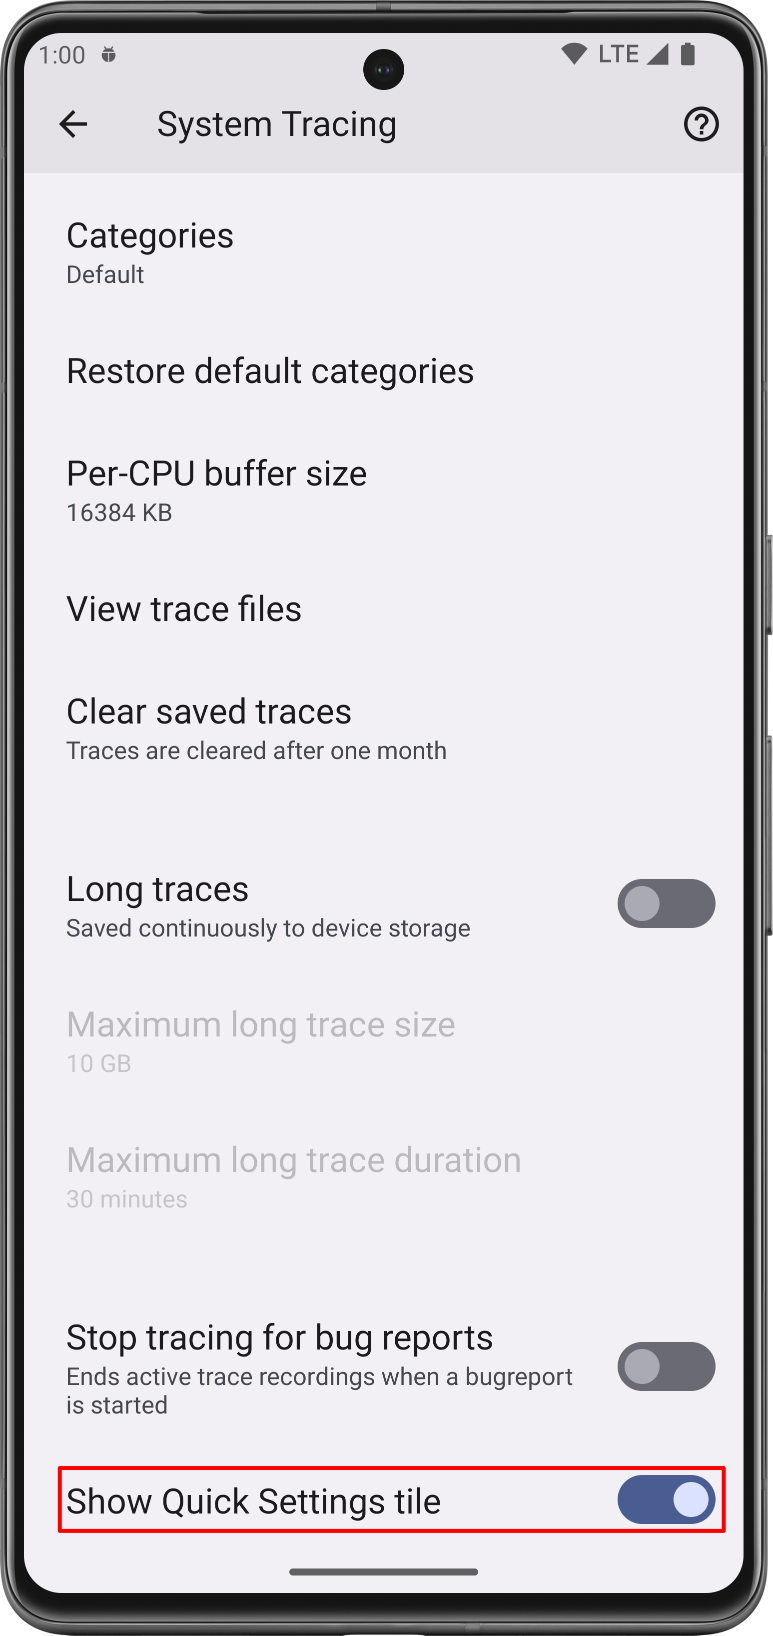
圖 1. 「系統追蹤」應用程式的「顯示快速設定方塊」切換鈕。 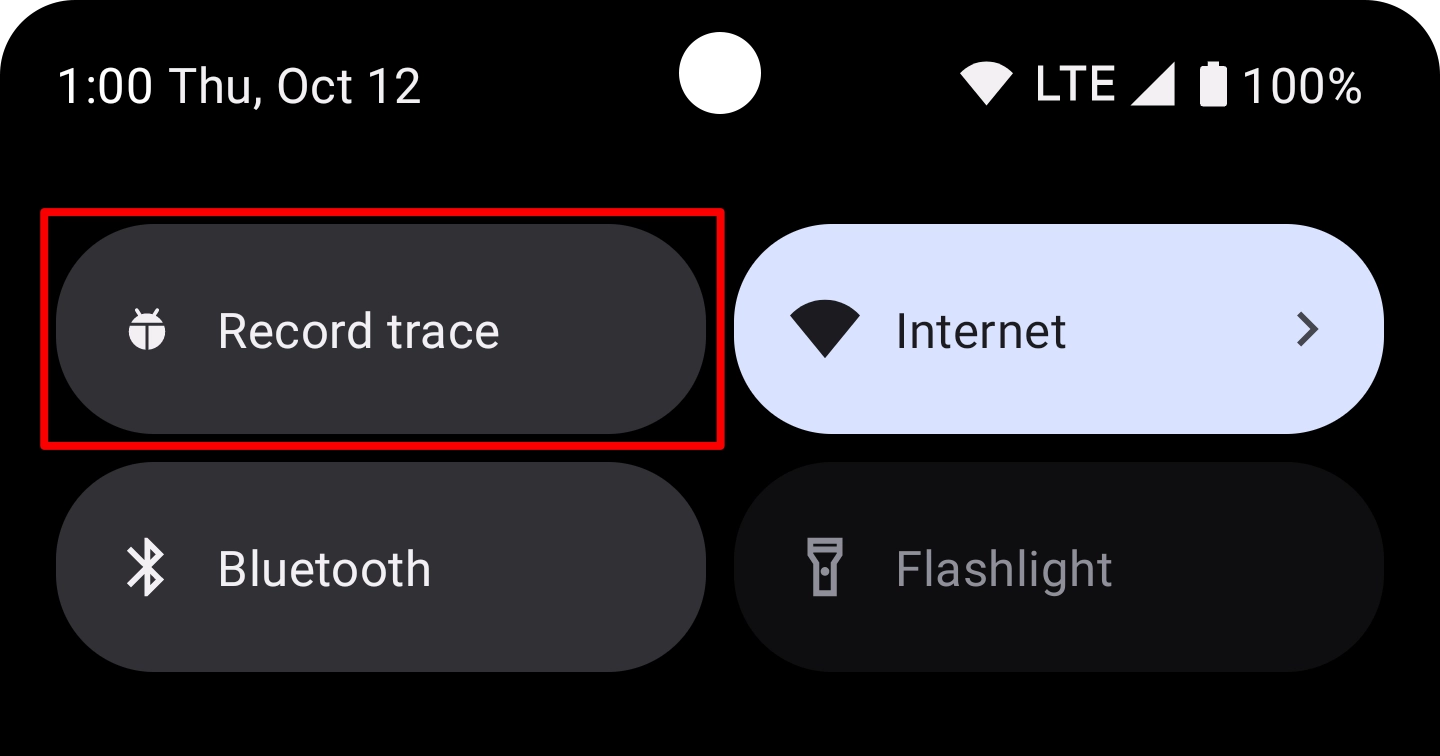
圖 2. 「快速設定」面板裡的「系統追蹤」方塊。 注意:系統預設會把「系統追蹤」方塊放在「快速設定」面板的第一個方塊位置。如果您想讓方塊出現在其他位置,請用面板的編輯模式移動方塊。
完成系統追蹤記錄的錄製程序
如果想使用「快速設定」面板錄製系統追蹤記錄,請按照以下步驟操作:
輕觸「系統追蹤」方塊,該方塊的顯示名稱為「錄製追蹤記錄」。啟用方塊後,系統會顯示常駐通知,讓您知道系統現在正在錄製追蹤記錄,如圖 3 所示:
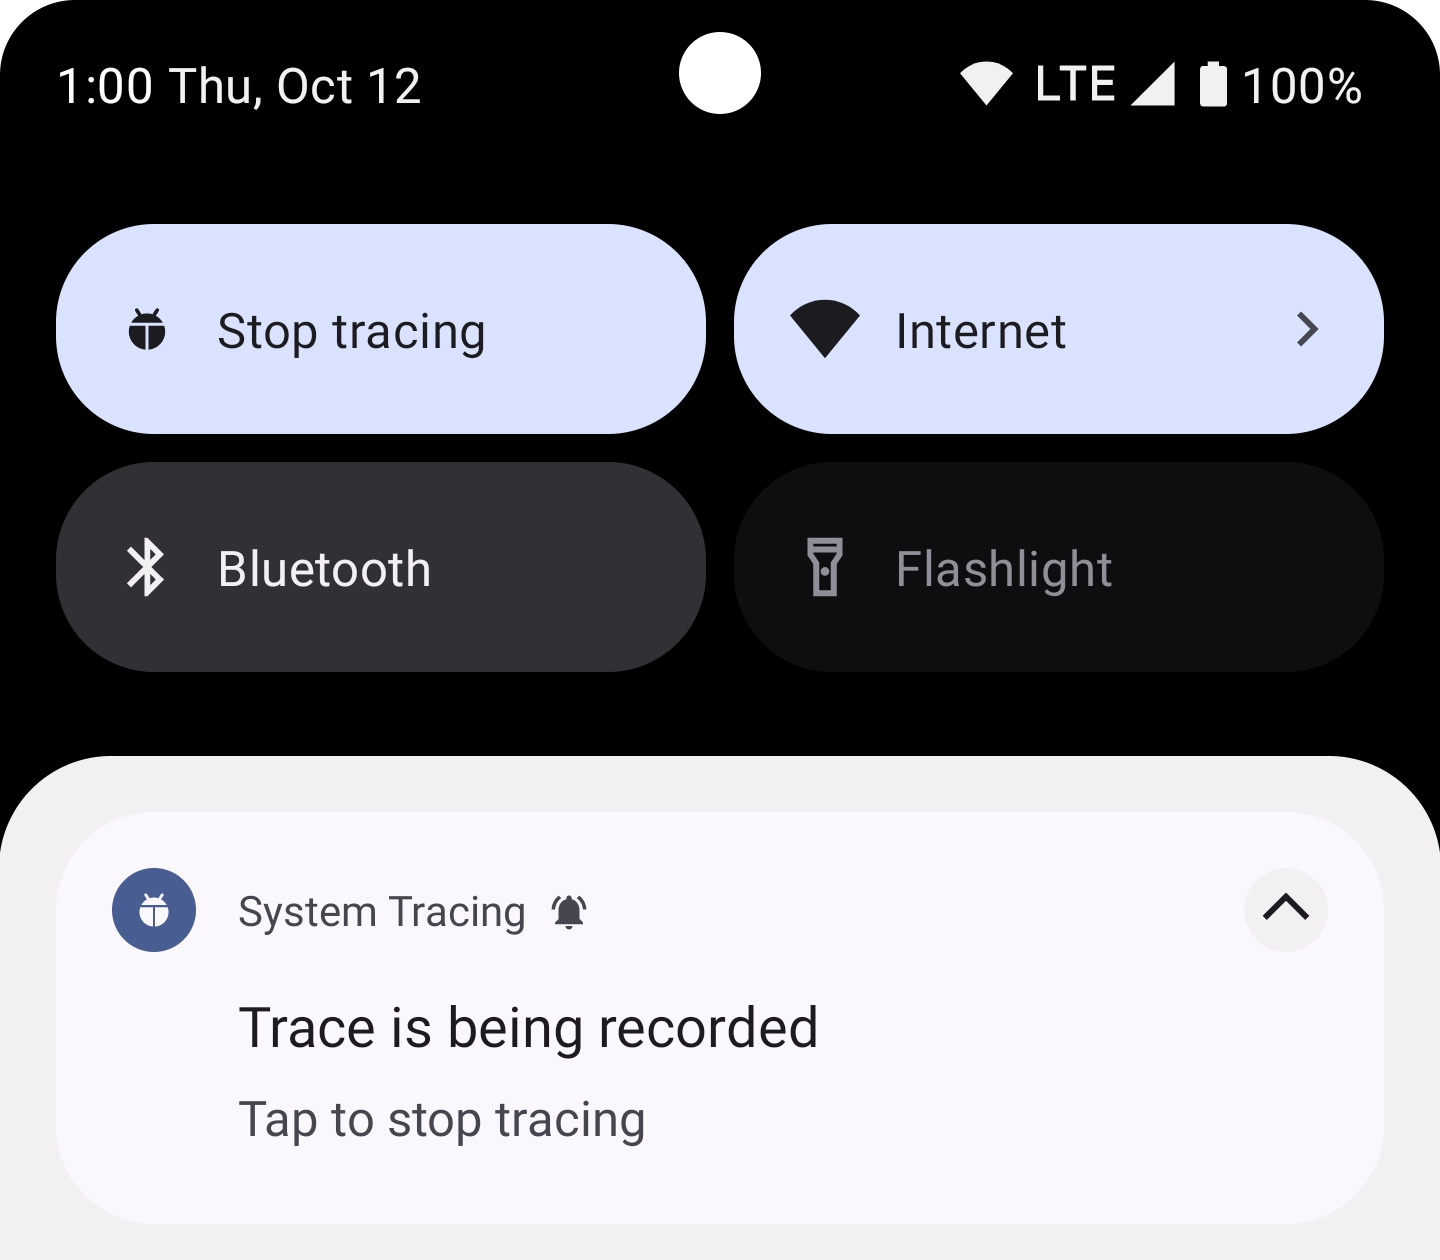
圖 3. 在裝置端啟動系統追蹤後顯示的常駐通知。 在您希望系統檢查的應用程式內執行操作。
如要停止追蹤,請前往「快速設定」面板輕觸「系統追蹤」方塊,或者輕觸「系統追蹤」通知。
系統會顯示新通知,內含「正在儲存追蹤記錄」的訊息。儲存完畢後,系統就會關閉通知並顯示第三則通知,確認追蹤記錄已經儲存,而您也可以分享系統追蹤記錄了,如圖 4 所示:
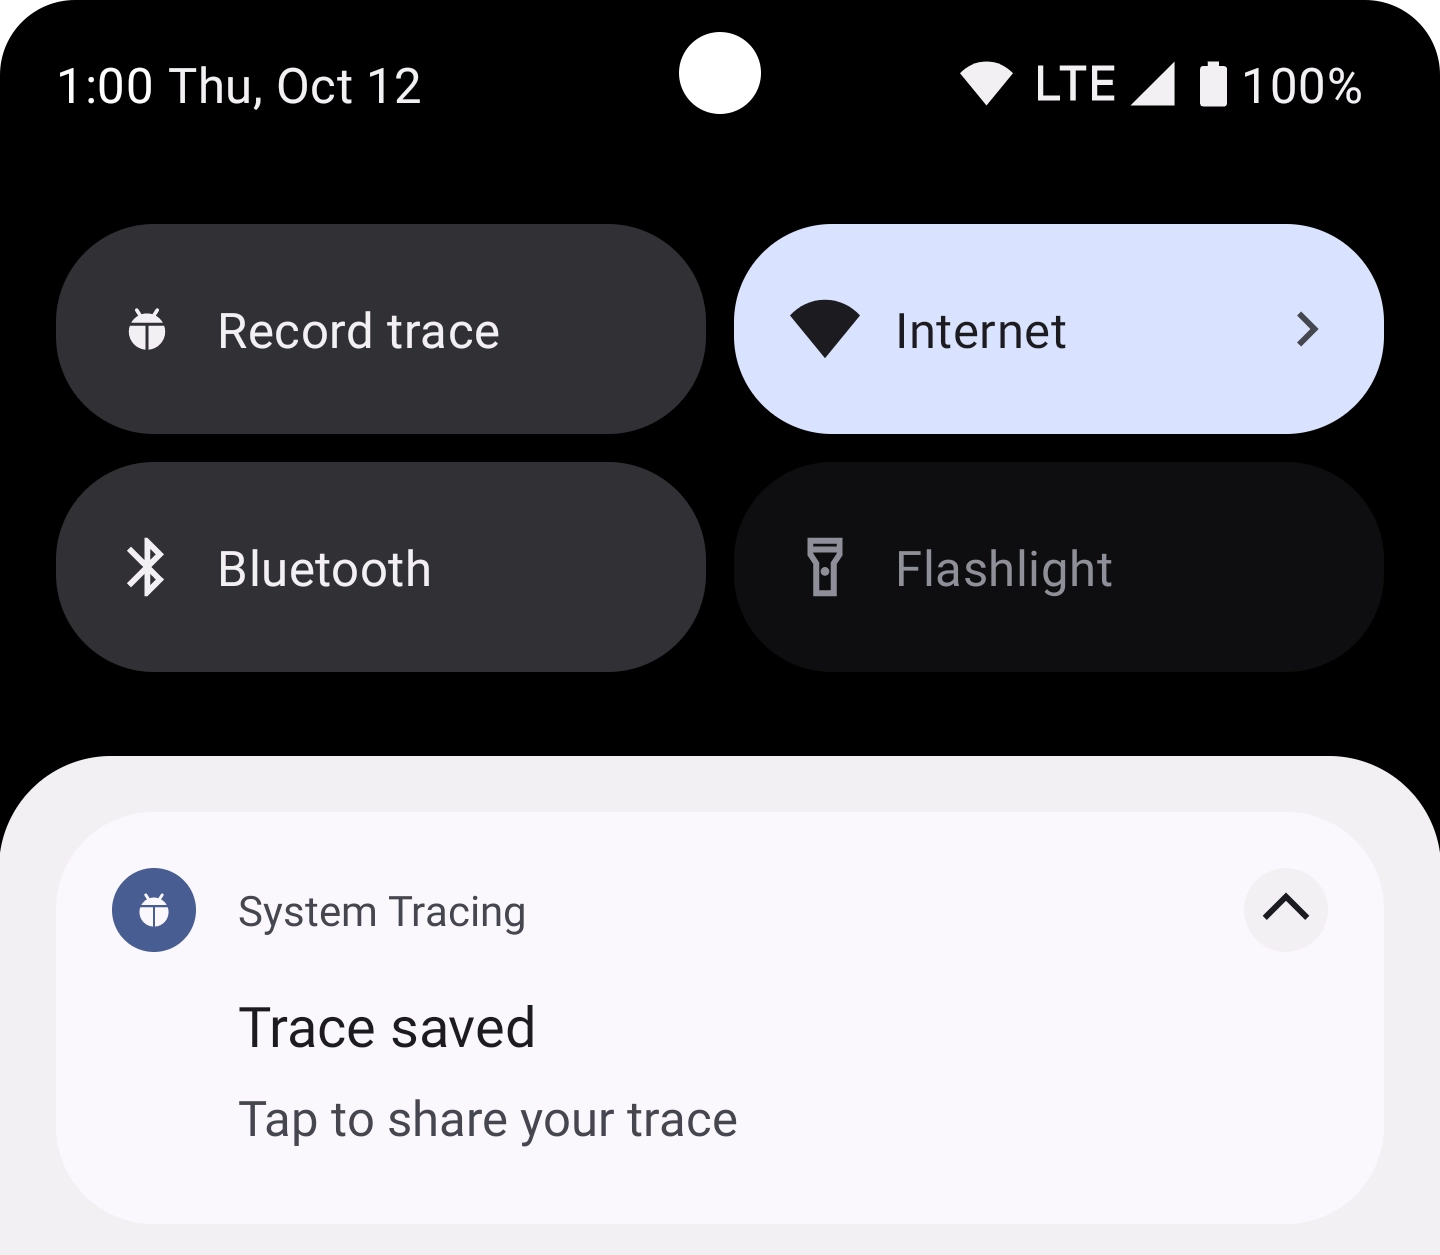
圖 4. 系統儲存完錄製的追蹤記錄後,顯示的常駐通知。
透過應用程式選單錄製
應用程式選單可調整與系統追蹤相關的多項進階設定,並提供用於開始和停止系統追蹤的切換鈕。
如要使用「系統追蹤」應用程式選單錄製系統追蹤記錄,請按照以下步驟操作:
- 啟用開發人員選項。
開啟「開發人員選項」設定畫面。點選「偵錯」區段的「系統追蹤」。系統會開啟「系統追蹤」應用程式。
或者,如果您已設定「系統追蹤」方塊,可以按住該方塊,進入「系統追蹤」應用程式。
確認已選取「追蹤可偵錯的應用程式」,以便將啟用偵錯功能的應用程式也納入系統追蹤記錄內。
您也可以選取要追蹤的系統和感應器呼叫類別,然後選擇每個 CPU 的緩衝區空間 (單位為 KB)。請選取和您要測試的用途對應的類別,例如「音訊」類別可以用來測試藍牙作業,或是「記憶體」類別可以測試堆積分配量。
您可以選取「長期追蹤記錄」,讓系統持續將追蹤記錄儲存到裝置的儲存空間。如果要使用這個選項,請設定「最大長期追蹤記錄大小」和「最大長期追蹤記錄時間長度」限制。
啟用「錄製追蹤記錄」切換鈕,如圖 5 的醒目標示。啟用方塊後,系統會顯示常駐通知,讓您知道系統現在正在錄製追蹤記錄,如圖 3 所示:
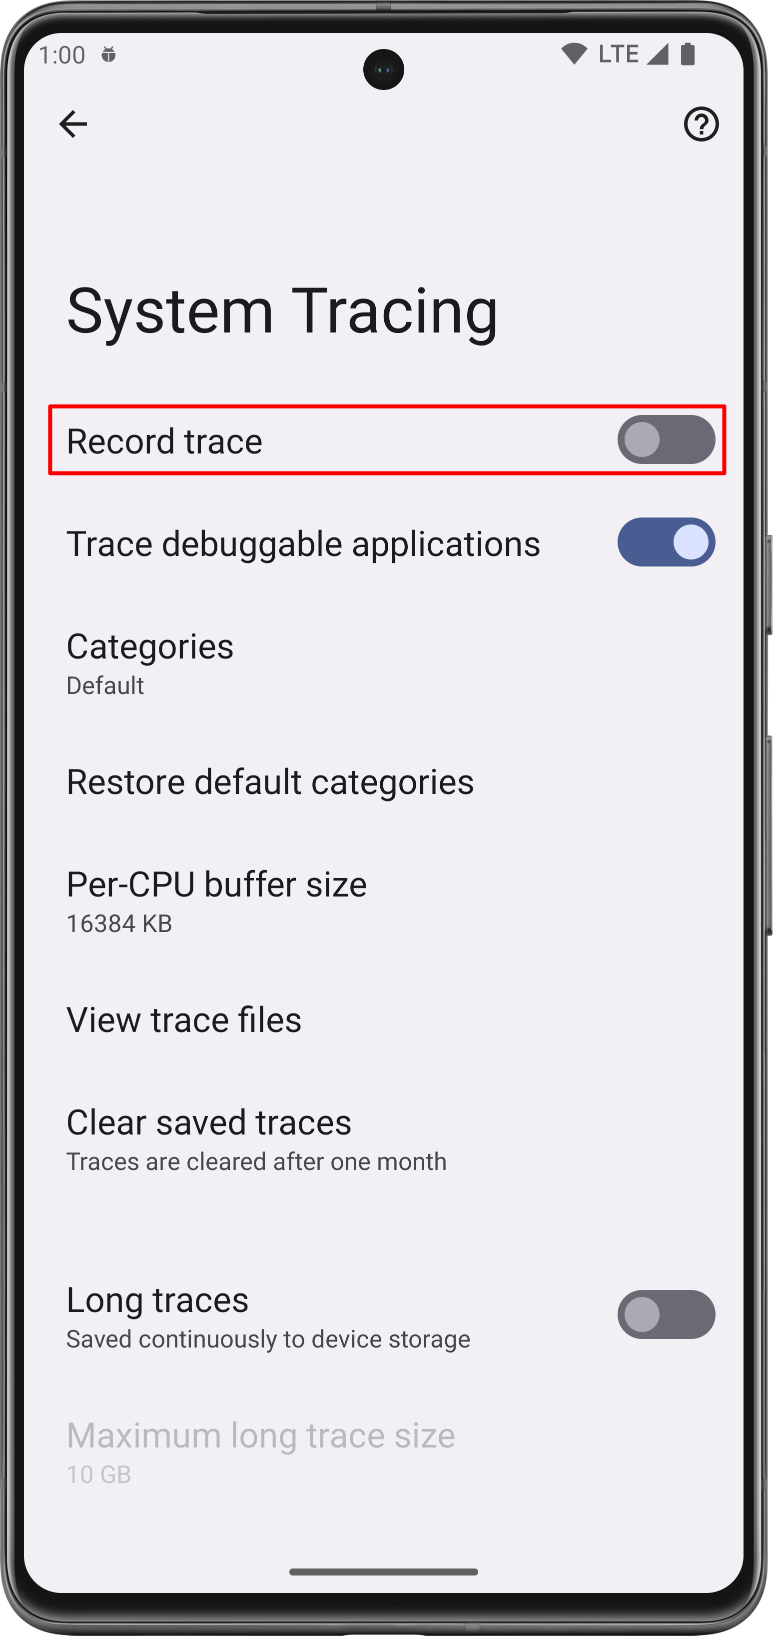
圖 5. 「系統追蹤」設定中的「錄製追蹤記錄」切換鈕。 在您希望系統檢查的應用程式內執行操作。
停用「錄製追蹤記錄」切換鈕即可停止追蹤。
系統會顯示新通知,內含「正在儲存追蹤記錄」的訊息。儲存完畢後,系統就會關閉通知並顯示第三則通知,確認追蹤記錄已經儲存,而您也可以分享系統追蹤記錄了,如圖 4 所示:
分享系統追蹤記錄
您可以使用「系統追蹤」應用程式,在各種工作流程中分享系統追蹤記錄結果。在搭載 Android 10 (API 級別 29) 以上版本的裝置中,追蹤檔會以 .perfetto-trace 副檔名儲存,可使用 Perfetto UI 開啟這類檔案。在搭載較舊版 Android 的裝置中,追蹤檔則以 .ctrace 副檔名儲存,表示這是 Systrace 格式。
透過訊息分享
「系統追蹤」允許您透過裝置上的其他應用程式分享收集到的追蹤記錄。也就是說,您能透過電子郵件或錯誤追蹤應用程式與開發團隊分享追蹤記錄,而無需把裝置連結到開發機器上。
錄製系統追蹤記錄後,請輕觸裝置上顯示的通知 (如圖 4 所示)。此時會顯示平台的意圖挑選器,讓您使用所選的訊息應用程式分享追蹤記錄。
藉由 Files 應用程式分享
在搭載 Android 10 (API 級別 29) 以上版本的裝置上,追蹤記錄會顯示在 Files 應用程式中。您可以用這個應用程式分享追蹤記錄。
使用 ADB 下載報告
您也可以透過 adb 從裝置擷取系統追蹤記錄。請將用於錄製追蹤記錄的裝置連接到開發機器上,然後在終端機視窗執行以下指令:
cd /path-to-traces-on-my-dev-machine && \
  adb pull /data/local/traces/ .
轉換追蹤記錄格式
您可以把 Perfetto 追蹤記錄檔案轉換為 Systrace 格式。詳情請參閱這個網頁,瞭解如何轉換追蹤記錄格式。
建立 HTML 報告
分享追蹤記錄時,報告會位於 .perfetto-trace 檔案中 (搭載 Android 10 以上版本的裝置) 或 .ctrace 檔案內 (其他版本裝置)。
您可以使用網頁式 UI 或指令列從追蹤記錄檔案建立 HTML 報告。
網頁式 UI
使用 Perfetto UI 開啟追蹤記錄檔案並產生報告。
若是 Perfetto 檔案,請按一下「Open trace file」(開啟追蹤記錄檔案)。若是 Systrace 檔案,請按一下「Open with Legacy UI」(使用舊版 UI 開啟)。舊版 UI 的外觀風格和 Systrace 報告相同。
指令列
在終端機視窗執行以下指令,以便從追蹤記錄檔案產生 HTML 報告:
cd /path-to-traces-on-my-dev-machine && \
  systrace --from-file trace-file-name{.ctrace | .perfetto-trace}
如果您還沒有 systrace 指令列程式,可到 GitHub 的 Catapult 專案下載,或直接透過 Android 開放原始碼計畫下載。
為您推薦
- 注意:系統會在 JavaScript 關閉時顯示連結文字
- 持續整合中的基準測試
- 在指令列擷取系統追蹤記錄